


Occupancy rate
67%
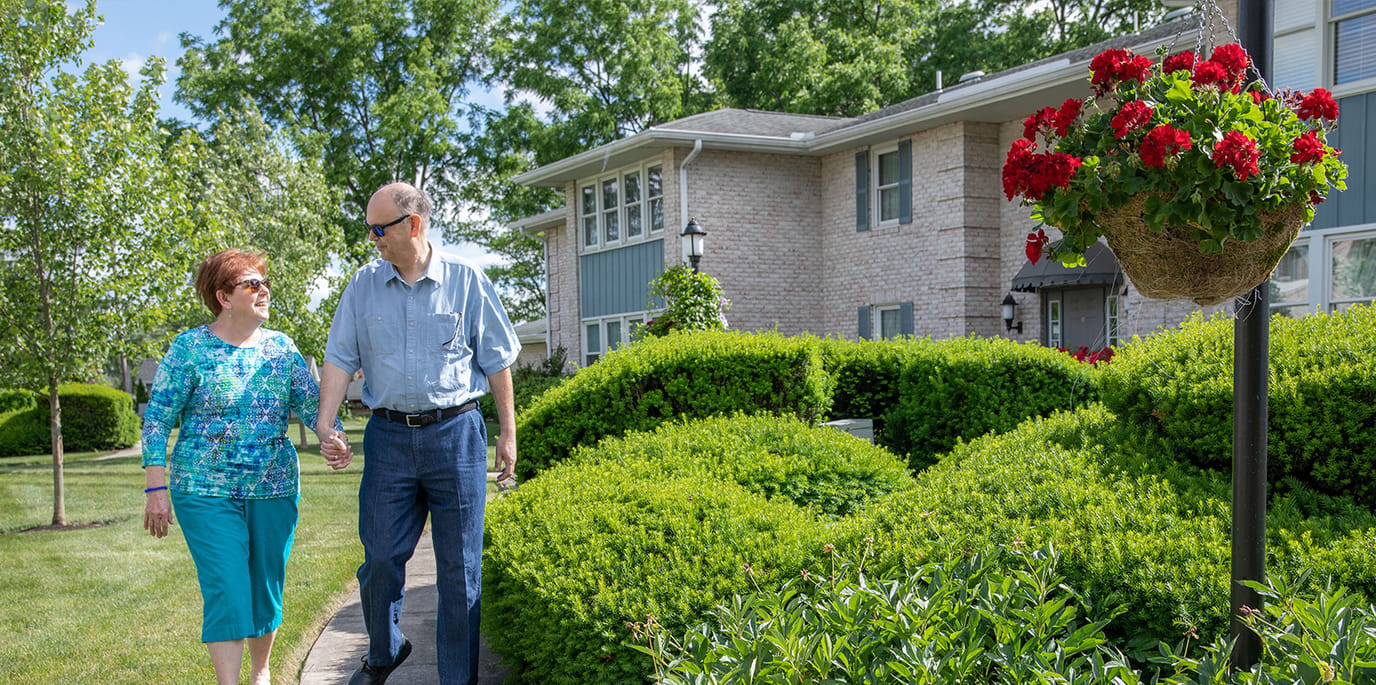


Under Terry Brown’s ownership, Chapel Pointe at Carlisle is a skilled nursing home operated by The Alliance Home Of Carlisle, Pa, Inc in Carlisle, Pennsylvania. Situated on South Hanover Street in a highly walkable neighborhood with a Walk Score of 74, it houses 61 residents with an average stay duration of about 519 days, indicating short-term rehabilitation and longer-stay placements. Accepted are Medicare, Medicaid, and private pay, giving families numerous choices to fund care.
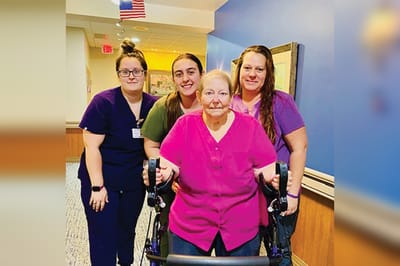
Total daily nursing support averages 5 hours 11 minutes per resident, with care delivered by registered nurses, licensed practical nurses, and nursing aides. This staffing foundation supports the skilled care and rehabilitation services the home provides to occupants in recovery. Daily life includes chef-prepared menus designed for nutritional needs and resident preferences. Occupants can access a beauty salon and barbershop, a resource center with a library and internet access, and shuttle transportation for appointments and outings. Programming and activities are available all week to support engagement and life quality.
State inspections have marked areas where the home still strengthens its operations, particularly around emergency preparedness, medication management, staff training, and care processes. These are matters families can discuss directly with the home’s leadership during a tour to understand current practices and how it supports safe, quality care.
Chapel Pointe at Carlisle’s location puts families at ease with strong walkability for visiting, and the mix of nursing expertise and rehabilitation services makes it a grounded choice for those healing from hospitalization or surgery, plus people needing active skilled care.
| Staff type | Hours / Day / Resident | vs state avg |
|---|---|---|
|
Registered Nurse (RN)
| 1h 1m per day | ▲ 29% State avg: 47m per day · National avg: 41m per day |
|
LPN / LVN
| 58m per day | ▲ 5% State avg: 55m per day · National avg: 52m per day |
|
Nurse Aide
| 3h 11m per day | ▲ 44% State avg: 2h 12m per day · National avg: 2h 20m per day |
|
Weekend Total Nursing
| 4h 50m per day | ▲ 38% State avg: 3h 31m per day · National avg: 3h 26m per day |
|
Physical Therapist
| 2m per day | ▼ 59% State avg: 6m per day · National avg: 4m per day |
|
Weekend RN
| 49m per day | ▲ 50% State avg: 33m per day · National avg: 28m per day |
Chapel Pointe at Carlisle is legally operated by The Alliance Home Of Carlisle, Pa, Inc.
In Pennsylvania, the Department of Human Services (for assisted living facilities) and the Department of Health (for nursing homes) conduct unannounced inspections to verify adherence to state regulations.
5 points above the Pennsylvania average for nursing homes (83/100)
Rank #162 / 460 in Pennsylvania Inspection Score — State benchmarked This home is ranked 162nd out of 460 homes in Pennsylvania for Inspection Score. Shows this facility's inspection score compared to the Pennsylvania average among 460 comparable communities in the ranking pool. Rankings are based only on facilities in Pennsylvania that report data for that category. Facilities without available data are excluded from the ranking. This is a proprietary Assisted Living Magazine score. Inspection score: 88 out of 100. Letter grade B+. 5 points above the Pennsylvania average for nursing homes (83/100)
Citations
| This Facility | PA Average | vs. PA Avg |
|---|---|---|---|
|
Total citations
| 30 | 63 | This facility has 52% fewer total citations than a typical Pennsylvania nursing home (30 vs. PA avg 63).↓ 52% better Rank #195 / 478 Total citations — State benchmarked This home is ranked 195th out of 478 homes in Pennsylvania for Total citations. Shows this facility's total citations compared to the Pennsylvania average among 478 comparable communities in the ranking pool. Rankings are based only on facilities in Pennsylvania that report data for that category. Facilities without available data are excluded from the ranking. |
|
Citations per year
| 6 | 12.6 | This facility has 52% fewer citations per year than a typical Pennsylvania nursing home (6 vs. PA avg 12.6).↓ 52% better |
|
Citations per inspection
| 3.3 | 5.7 | This facility has 42% fewer citations per inspection than a typical Pennsylvania nursing home (3.3 vs. PA avg 5.7).↓ 42% better Rank #205 / 478 Citations per inspection — State benchmarked This home is ranked 205th out of 478 homes in Pennsylvania for Citations per inspection. Shows this facility's citations per inspection compared to the Pennsylvania average among 478 comparable communities in the ranking pool. Rankings are based only on facilities in Pennsylvania that report data for that category. Facilities without available data are excluded from the ranking. |
Inspections
| This Facility | PA Average | vs. PA Avg |
|---|---|---|---|
|
Total inspections
| 9 | 11 | This facility has had 18% fewer total inspections than the Pennsylvania average (9 vs. PA avg 11). More inspections can mean more regulatory scrutiny rather than worse care.↓ 18% fewer |
|
Inspections with citations
| 5 | 8 | This facility has 38% fewer inspections with citations than a typical Pennsylvania nursing home (5 vs. PA avg 8).↓ 38% better |
|
Inspection citation rate
| 56% | 73% | This facility has 17 percentage points lower inspection citation rate than a typical Pennsylvania nursing home (56% vs. PA avg 73%).↓ 17% better Rank #123 / 478 Inspection citation rate — State benchmarked This home is ranked 123rd out of 478 homes in Pennsylvania for % of inspections with citations. Shows this facility's % of inspections with citations compared to the Pennsylvania average among 478 comparable communities in the ranking pool. Rankings are based only on facilities in Pennsylvania that report data for that category. Facilities without available data are excluded from the ranking. |
Complaints & Investigations
| This Facility | PA Average | vs. PA Avg |
|---|---|---|---|
|
Total complaints
| 2 | 4 | This facility has 50% fewer total complaints than a typical Pennsylvania nursing home (2 vs. PA avg 4).↓ 50% better Rank #1 / 478 Total complaints — State benchmarked This home is ranked 1st out of 478 homes in Pennsylvania for Complaint inspections. Shows this facility's complaint inspections compared to the Pennsylvania average among 478 comparable communities in the ranking pool. Rankings are based only on facilities in Pennsylvania that report data for that category. Facilities without available data are excluded from the ranking. |
|
Complaints per year
| 0.4 | 0.8 | This facility has 50% fewer complaints per year than a typical Pennsylvania nursing home (0.4 vs. PA avg 0.8).↓ 50% better |
Pennsylvania average 6.7
Last Health inspection on Mar 2025
Pennsylvania average 31.3
Pennsylvania average 4.4
Health citations are formal notices following inspections when they fail to comply with safety and care standards.
All 6 citations resulted from standard inspections.
Pennsylvania average: 0.3
Pennsylvania average: 0.6
Reporting period: October 1 – December 31, 2025 (Q4 2025). Source: CMS Payroll-Based Journal report.
Manages medical care and health needs.
Assists with medical care and medications.
Helps with daily care and mobility.
Total hours from contractors
2,338 contractor hours this quarter
| Certified Nursing Assistant | 54 | 0 | 54 | 16,890 | 92 | 100% | 6.8 |
| Licensed Practical Nurse | 14 | 0 | 14 | 4,747 | 92 | 100% | 7.4 |
| Registered Nurse | 16 | 0 | 16 | 4,366 | 92 | 100% | 7 |
| Speech Language Pathologist | 0 | 3 | 3 | 1,062 | 69 | 75% | 5.6 |
| Clinical Nurse Specialist | 4 | 0 | 4 | 570 | 77 | 84% | 3.3 |
| Administrator | 1 | 0 | 1 | 471 | 64 | 70% | 7.4 |
| Nurse Practitioner | 1 | 0 | 1 | 431 | 71 | 77% | 6.1 |
| Physical Therapy Assistant | 0 | 5 | 5 | 395 | 64 | 70% | 5.2 |
| RN Director of Nursing | 1 | 0 | 1 | 386 | 60 | 65% | 6.4 |
| Physical Therapy Aide | 0 | 2 | 2 | 386 | 63 | 68% | 5.8 |
| Dietitian | 1 | 0 | 1 | 374 | 44 | 48% | 8.5 |
| Dental Services Staff | 1 | 0 | 1 | 357 | 50 | 54% | 7.1 |
| Respiratory Therapy Technician | 0 | 5 | 5 | 218 | 63 | 68% | 2.6 |
| Occupational Therapy Aide | 0 | 1 | 1 | 115 | 13 | 14% | 8.8 |
| Qualified Social Worker | 0 | 1 | 1 | 81 | 34 | 37% | 2.4 |
| Medical Director | 0 | 1 | 1 | 54 | 14 | 15% | 3.9 |
| Occupational Therapy Assistant | 0 | 1 | 1 | 28 | 3 | 3% | 9.3 |
Federal penalties imposed by CMS for regulatory violations, including civil money penalties (fines) and denials of payment for new Medicare/Medicaid admissions.
Source: CMS Penalties Database
No penalties in the past 3 years
No civil money penalties or payment denials were reported in the last 3 years.
These measures show how residents usually do over time at this home, based on health outcomes and preventive care.
Pennsylvania average: 11.0
Pennsylvania average: 22.2
Pennsylvania average: 19.0%
Pennsylvania average: 21.1%
Pennsylvania average: 26.7%
Pennsylvania average: 3.2%
Pennsylvania average: 5.5%
Pennsylvania average: 1.8%
Pennsylvania average: 6.6%
Pennsylvania average: 5.5%
Pennsylvania average: 17.1%
Pennsylvania average: 86.9%
Pennsylvania average: 93.5%
Pennsylvania average: 1.68
Pennsylvania average: 1.20
Pennsylvania average: 68.8%
Pennsylvania average: 1.5%
Pennsylvania average: 68.7%
Pennsylvania average: 23.1%
Pennsylvania average: 9.8%
Pennsylvania average: 0.8%
Pennsylvania average: 50.6%
Quality measures are calculated from Minimum Data Set (MDS) assessments. For most measures, lower percentages indicate better care quality.
29% of new residents, usually for short-term rehab.
61% of new residents, often for short stays.
10% of new residents, often for long-term daily care.
Source: CMS Long-Term Care Facility Characteristics (Data as of Jan 2026)
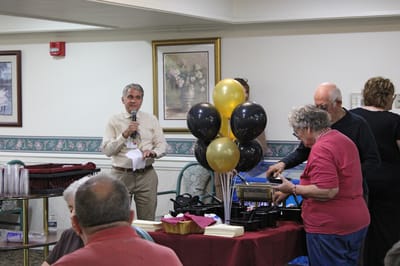
Residents meet regularly to discuss policies, care quality, and activities
Part of a Continuing Care Retirement Community offering multiple care levels
Organized group of residents that meets regularly to discuss facility policies, quality of life, and activities.
Data sourced from CMS Long-Term Care Facility Characteristics quarterly report. Payer mix reflects the current resident census by primary payment source.
Historical financial and operational data for Chapel Pointe at Carlisle from 2011–2023, based on CMS SNF Cost Reports.
Key figures below are for fiscal year ending in 12/2023.
Based on CMS SNF Cost Report for fiscal year ending in 12/2023.
Residents typically stay for brief periods, with frequent admissions and discharges throughout the year.
Most new residents arrive under private pay (61% of admissions), and a typical private pay stay runs around 3 years.
Coverage residents most often arrive under.
Coverage residents most often leave under.
![]() 0.0 miles from city center
0.0 miles from city center
![]() Estimated distance in miles from Carlisle's city center to Chapel Pointe at Carlisle's address, calculated via Google Maps.
Estimated distance in miles from Carlisle's city center to Chapel Pointe at Carlisle's address, calculated via Google Maps.
Add your location
The information below is reported by the Pennsylvania Department of Human Services and Department of Health.
| Chapel Pointe at Carlisle | NH IL SNF | Carlisle | 61
Facility
61
PA AVG
94
Rank
#396 / 555 |
67.2%
Facility
67.2%
PA AVG
—
Rank
#294 / 518 | - | 5.19
Facility
5.19
PA AVG
4.15
Rank
#32 / 207 | +19% | +25% | $0
Facility
$0
PA AVG
$61.2k
Rank
#1 / 210 | 88
Facility
88
PA AVG
83
Rank
#162 / 460 | 6
Facility
6
PA AVG
31.3
Rank
#38 / 207 | 3.0
Facility
3.0
PA AVG
4.4
Rank
#71 / 207 | - | 41 | - |
74
Facility
74
PA AVG
46
Rank
#118 / 668 | Terry Brown | $11.4MFiscal year ending 12/2023
Facility
$11.4MFiscal year ending 12/2023
PA AVG
$32.8M
Rank
#138 / 209 | $9.6MFiscal year ending 12/2023
Facility
$9.6MFiscal year ending 12/2023
PA AVG
$6.7M
Rank
#107 / 209 | 83.6%Fiscal year ending 12/2023
Facility
83.6%Fiscal year ending 12/2023
PA AVG
40%
Rank
#46 / 209 | 395923 | ||||
| Cumberland Crossings Retirement Community | NH AL IL MC SNF | Wings Carlisle | 59
Facility
59
PA AVG
94
Rank
#415 / 555 |
72.9%
Facility
72.9%
PA AVG
—
Rank
#236 / 518 | - | 4.82
Facility
4.82
PA AVG
4.15
Rank
#55 / 207 | -76% | +16% | $0
Facility
$0
PA AVG
$61.2k
Rank
#1 / 210 | 91
Facility
91
PA AVG
83
Rank
#112 / 460 | 16
Facility
16
PA AVG
31.3
Rank
#100 / 207 | 5.3
Facility
5.3
PA AVG
4.4
Rank
#156 / 207 | - | 43 | - |
74
Facility
74
PA AVG
46
Rank
#118 / 668 | Bradford Weiser | $10.1MFiscal year ending 12/2023
Facility
$10.1MFiscal year ending 12/2023
PA AVG
$32.8M
Rank
#129 / 209 | $5.3MFiscal year ending 12/2023
Facility
$5.3MFiscal year ending 12/2023
PA AVG
$6.7M
Rank
#172 / 209 | 52.6%Fiscal year ending 12/2023
Facility
52.6%Fiscal year ending 12/2023
PA AVG
40%
Rank
#191 / 209 | 395876 | ||||
| Claremont Nursing and Rehabilitation Center | NH MC PC RC SNF | Carlisle (Claremont Road) | 282
Facility
282
PA AVG
94
Rank
#7 / 555 |
91.7%
Facility
91.7%
PA AVG
—
Rank
#217 / 518 | - | 3.75
Facility
3.75
PA AVG
4.15
Rank
#148 / 207 | -40% | -9% | $13.8k
Facility
$13.8k
PA AVG
$61.2k
Rank
#162 / 210 | - | 50
Facility
50
PA AVG
31.3
Rank
#181 / 207 | 5.0
Facility
5.0
PA AVG
4.4
Rank
#141 / 207 | 3 | 259 | - |
11
Facility
11
PA AVG
46
Rank
#595 / 668 | Elazar Weinberg | $27.4MFiscal year ending 12/2023
Facility
$27.4MFiscal year ending 12/2023
PA AVG
$32.8M
Rank
#71 / 209 | $8.6MFiscal year ending 12/2023
Facility
$8.6MFiscal year ending 12/2023
PA AVG
$6.7M
Rank
#37 / 209 | 31.4%Fiscal year ending 12/2023
Facility
31.4%Fiscal year ending 12/2023
PA AVG
40%
Rank
#32 / 209 | 395660 |
Chapel Pointe at Carlisle is located in CARLISLE, Pennsylvania.
Here are the financial assistance programs available to residents in Pennsylvania.
Chapel Pointe at Carlisle is legally operated by The Alliance Home Of Carlisle, Pa, Inc.
Chapel Pointe at Carlisle has a walk score of 74. Very walkable. Most errands can be accomplished on foot, and many essentials are within a short walk.
According to PA state health department records, Chapel Pointe at Carlisle's license number is 343370.
According to PA state health department records, Chapel Pointe at Carlisle's license expires on June 3, 2027.
Chapel Pointe at Carlisle's occupancy is 67%.
Chapel Pointe at Carlisle is registered as a non-profit in PA.
Chapel Pointe at Carlisle has 61 beds.
Care Cost Calculator: See Prices in Your Area
Nursing Home Data Explorer
Don’t Wait Too Long: 7 Red Flag Signs Your Parent Needs Assisted Living Now
The True Cost of Assisted Living in 2025 – And How Families Are Paying For It
Understanding Senior Living Costs: Pricing Models, Discounts & Financial Assistance


