Charlwell House Health & Rehabilitation Center
Nursing Home · Norwood, MA
CMS overall rating Info The Overall CMS Rating is scored from 1 to 5 stars and combines results from health inspections, staffing levels, and quality measures. Health inspections carry the most weight. Staffing and quality scores can increase or decrease the final rating based on performance compared to state and national standards.

Charlwell House Health & Rehabilitation Center

Nursing Home · Norwood, MA
CMS overall rating Info The Overall CMS Rating is scored from 1 to 5 stars and combines results from health inspections, staffing levels, and quality measures. Health inspections carry the most weight. Staffing and quality scores can increase or decrease the final rating based on performance compared to state and national standards.
Calculator: See prices in your area
Charlwell House Health & Rehabilitation Center accepts Medicare, Medicaid, and private pay.

Overview of Charlwell House Health & Rehabilitation Center

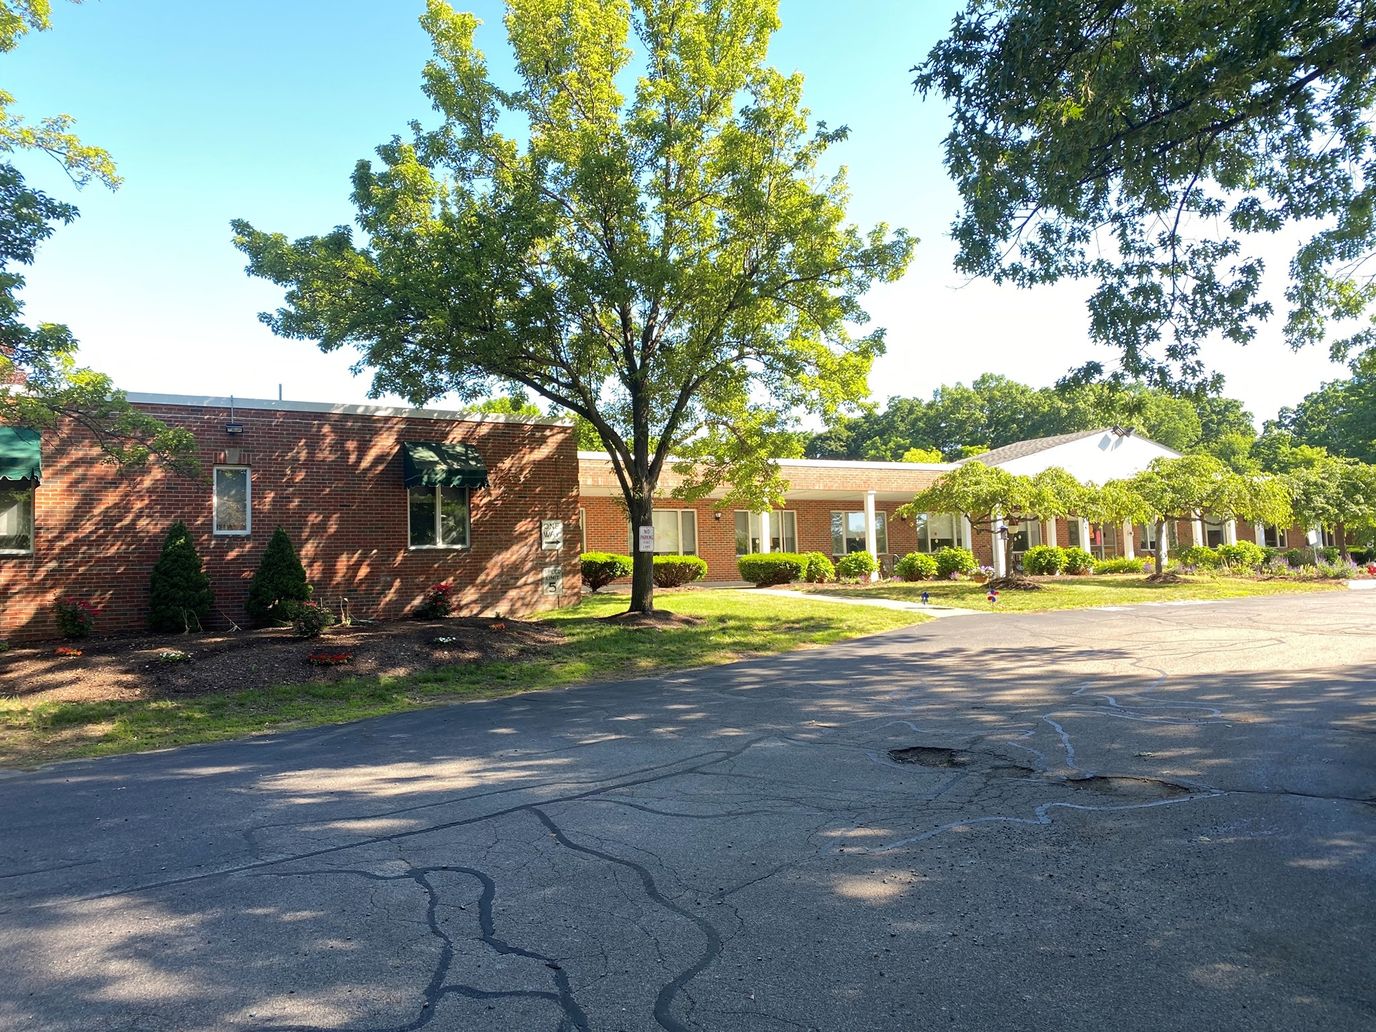
Charlwell House Health & Rehabilitation Center is a nursing home in Norwood, MA, offering rehabilitation and skilled nursing. With a compassionate and supportive environment, the community ensures older adults are treated well throughout their stay. Exceptional services, including 24-hour care, three well-balanced meals daily, and social services, are also provided to improve residents’ quality of life. Through individualized care plans, residents receive the utmost attention and care tailored to their specific needs and habits.

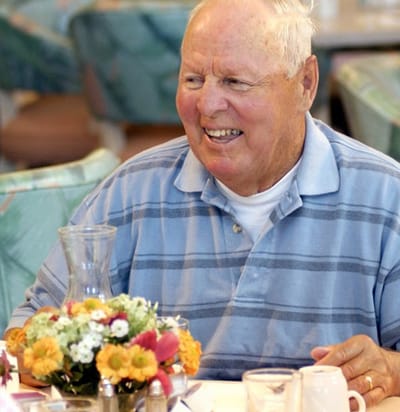
Weekly dog therapy visits, musical entertainment, and a variety of recreational activities encourage residents to have fun and gain meaningful experiences. Residents can also rest and focus on their wellness with a beauty salon and spacious dayrooms. Situated near Ellis Pons in the quiet residential area of Norwood, the community guarantees a stress-free retirement. This nursing home ensures older adults can thrive in retirement, making it a good option for senior living in Massachusetts.

(781) 762-7700

Quality ratings

Measured by Centers for Medicare & Medicaid Services (CMS)

Overall rating Info The Overall CMS Rating combines results from health inspections, staffing levels and quality measures. Health inspections carry the most weight. Staffing and quality scores can increase or decrease the final rating based on performance compared to state and national standards.
▼ 31.0% Below MA avg. ▼ 31.0% Below MA avg.Click the badge to see the full State ranking.Click here to see the full State ranking.
Health Inspection Info Based on the results of the facility's three most recent standard inspections and any complaint investigations. CMS reviews the number, scope, and severity of deficiencies, with more recent findings weighted more heavily.
▼ 29.7% Below MA avg. ▼ 29.7% Below MA avg.Click the badge to see the full State ranking.Click here to see the full State ranking.
Staffing Info Measures average nursing staff hours per resident per day, including Registered Nurses (RNs) and total nursing staff. Ratings are adjusted based on the level of care residents require and are compared to state and national benchmarks.
At MA avg. At MA avg.Click the badge to see the full State ranking.Click here to see the full State ranking.
Quality Measures Info Based on clinical and physical health indicators reported to CMS, such as hospital readmissions, falls, pressure ulcers, and improvements in mobility. These measures reflect how well residents' health needs are being managed.
▼ 37.1% Below MA avg. ▼ 37.1% Below MA avg.Click the badge to see the full State ranking.Click here to see the full State ranking.

Staffing hours breakdown

Info Daily nursing hours per resident by staff type, reported to CMS. Higher is generally better — compare this facility to state and national averages to see where staffing stands.

Hours per resident per day — compared to Massachusetts state averages

Total nursing care / resident Info This home is ranked 69th out of 89 homes in Massachusetts. Total adjusted nursing hours per resident per day, combining RN, LPN, and aide time. CMS adjusts this for case-mix so facilities can be fairly compared.
3h 33m per day
Rank #69 / 89Nurse hours — State benchmarkedThis home is ranked 69th out of 89 homes in Massachusetts. Shows adjusted nurse hours per resident per day benchmarked to the Massachusetts average, with a ranking across 89 Massachusetts SNFs. More hours mean more direct care. The national average is about 3.5 hrs; below 3.0 is a red flag.Click the rank badge to see the full State ranking.Click here to see the full State ranking.
This facility Massachusetts avg (3h 56m per day)
vs Massachusetts avg
-10%
Staff typeHours / Day / Residentvs state avg
Weekend Total Nursing Info Combined nursing hours (RN + LPN + Nurse Aide) per resident per day on weekends. Staffing often drops on weekends — this figure reveals whether the facility maintains adequate coverage outside of weekday hours. 2h 59m per day

Types of Care at Charlwell House Health & Rehabilitation Center

Nursing Home

Capacity and availability

This home usually has limited availability

Occupancy between 85% and 95% suggests balanced demand.

Higher occupancy than the Massachusetts average: 82%
Occupancy rate 87.4% Rank #40 / 92Occupancy rate — State benchmarkedThis home is ranked 40th out of 92 homes in Massachusetts. Shows this facility's occupancy rate versus the Massachusetts average, with its Statewide rank out of 92. Higher occupancy signals strong local demand and financial stability.Click the rank badge to see the full State ranking.Click here to see the full State ranking.
Avg. Length of Stay 114 days
Occupancy rate
87.4% Rank #40 / 92Occupancy rate — State benchmarkedThis home is ranked 40th out of 92 homes in Massachusetts. Shows this facility's occupancy rate versus the Massachusetts average, with its Statewide rank out of 92. Higher occupancy signals strong local demand and financial stability.Click the rank badge to see the full State ranking.Click here to see the full State ranking.
Avg. Length of Stay
114 days
Walk Score
Walk Score: 46 / 100 Rank #281 / 499Walk Score — State benchmarkedThis home is ranked 281st out of 499 homes in Massachusetts. Shows how walkable this facility's neighborhood is compared to the average Walk Score across Massachusetts SNFs. Higher scores benefit residents, families, and staff.Click the rank badge to see the full State ranking.Click here to see the full State ranking.
Somewhat walkable. A few nearby services may be reachable on foot, but most trips require transportation.

Contact Charlwell House Health & Rehabilitation Center

Staffing Data

Reporting period: October 1 – December 31, 2025 (Q4 2025). Source: CMS Payroll-Based Journal report.

Total staff 146
Employees 79
Contractors 67
Staff to resident ratio 1.85:1
11% better than Massachusetts average
Massachusetts average ratio: 1.66:1 Massachusetts average ratio: 1.66:1See full Massachusetts ranking
Avg staff/day 45
Average shift 7.2 hours
9% worse than Massachusetts average
Massachusetts average: 7.9 hours Massachusetts average shift: 7.9 hoursSee full Massachusetts ranking
Total staff hours (quarter) 29,969

Nursing staff breakdown

Q4 2025 · Oct 1 – Dec 31 More info This data comes from the CMS Payroll-Based Journal report covering October 1 – December 31, 2025.
Registered Nurse

Manages medical care and health needs.

RN Staff 49
Average shift length Info Average shift length. Calculated as total hours divided by days worked and average staff per day. 7.4 hours

This role is partially covered by contractors.

Licensed Practical Nurse

Assists with medical care and medications.

LPN Staff 18
Average shift length Info Average shift length. Calculated as total hours divided by days worked and average staff per day. 8.3 hours

This role is partially covered by contractors.

Certified Nursing Assistant

Helps with daily care and mobility.

CNA Staff 37
Average shift length Info Average shift length. Calculated as total hours divided by days worked and average staff per day. 7.2 hours

This role is partially covered by contractors.

Contractor staffing

Q4 2025 · Oct 1 – Dec 31 More info This data comes from the CMS Payroll-Based Journal report covering October 1 – December 31, 2025.

Total hours from contractors

9.2%

2,769 contractor hours this quarter

Registered Nurse: 40 Licensed Practical Nurse: 9 Physical Therapy Assistant: 7 Respiratory Therapy Technician: 3 Speech Language Pathologist: 2 Certified Nursing Assistant: 1 Occupational Therapy Assistant: 1 Physical Therapy Aide: 1 Medical Director: 1 Mental Health Service Worker: 1 Qualified Social Worker: 1

Staff by category

Q4 2025 · Oct 1 – Dec 31 More info This data comes from the CMS Payroll-Based Journal report covering October 1 – December 31, 2025.
Certified Nursing Assistant3613713,13192100%7.2
Physical Therapist120123,82692100%6.7
Registered Nurse940493,77692100%7.4
Licensed Practical Nurse99183,02392100%8.3
RN Director of Nursing5051,5248795%7.8
Other Dietary Services Staff3036908188%7.3
Clinical Nurse Specialist1015346470%8.3
Speech Language Pathologist0225126470%7.8
Respiratory Therapy Technician0334936368%7.1
Nurse Practitioner1014575863%7.9
Physical Therapy Aide0114486368%7.1
Administrator1014335358%8.2
Dietitian1014015155%7.9
Physical Therapy Assistant0772574043%5.7
Qualified Social Worker0112112932%7.3
Occupational Therapy Aide1011402123%6.6
Medical Director0114833%16
Mental Health Service Worker011361011%3.6
Occupational Therapy Assistant011332830%1.2
37 Certified Nursing Assistant
% of Days 100%
12 Physical Therapist
% of Days 100%
49 Registered Nurse
% of Days 100%
18 Licensed Practical Nurse
% of Days 100%
5 RN Director of Nursing
% of Days 95%
3 Other Dietary Services Staff
% of Days 88%
1 Clinical Nurse Specialist
% of Days 70%
2 Speech Language Pathologist
% of Days 70%
3 Respiratory Therapy Technician
% of Days 68%
1 Nurse Practitioner
% of Days 63%
1 Physical Therapy Aide
% of Days 68%
1 Administrator
% of Days 58%
1 Dietitian
% of Days 55%
7 Physical Therapy Assistant
% of Days 43%
1 Qualified Social Worker
% of Days 32%
1 Occupational Therapy Aide
% of Days 23%
1 Medical Director
% of Days 3%
1 Mental Health Service Worker
% of Days 11%
1 Occupational Therapy Assistant
% of Days 30%

Penalties and fines

Federal penalties imposed by CMS for regulatory violations, including civil money penalties (fines) and denials of payment for new Medicare/Medicaid admissions.

Source: CMS Penalties Database

No penalties in the past 3 years

No civil money penalties or payment denials were reported in the last 3 years.

Quality of care over time

These measures show how residents usually do over time at this home, based on health outcomes and preventive care.

High-risk clinical events score Info A composite score based on pressure ulcers, falls with injury, weight loss, walking ability decline, and activities of daily living decline. 10.7
In line with Massachusetts average

Massachusetts average: 10.2

Functional decline score Info A composite score based on activities of daily living decline, walking ability decline, and incontinence. 21.9
9% worse than Massachusetts average

Massachusetts average: 20.0

Long-stay resident measures
Need for Help with Daily Activities Increased Info Percent of long-stay residents whose need for help with daily activities has increased 22.7%
21% worse than Massachusetts average

Massachusetts average: 18.7%

Walking Ability Worsened Info Percent of long-stay residents whose ability to move independently worsened 19.2%
In line with Massachusetts average

Massachusetts average: 19.3%

Low Risk Residents with Bowel/Bladder Incontinence Info Percent of low risk long-stay residents who lose control of their bowels or bladder 23.7%
7% worse than Massachusetts average

Massachusetts average: 22.1%

Falls with Major Injury Info Percent of long-stay residents experiencing one or more falls with major injury 2.4%
33% better than Massachusetts average

Massachusetts average: 3.6%

High Risk Residents with Pressure Ulcers Info Percent of long-stay high risk residents with pressure ulcers 6.1%
32% worse than Massachusetts average

Massachusetts average: 4.7%

Urinary Tract Infection Info Percent of long-stay residents with a urinary tract infection 0.4%
80% better than Massachusetts average

Massachusetts average: 2.1%

Lost Too Much Weight Info Percent of long-stay residents who lose too much weight 3.2%
39% better than Massachusetts average

Massachusetts average: 5.2%

Depressive Symptoms Info Percent of long-stay residents who have depressive symptoms 2.3%
79% better than Massachusetts average

Massachusetts average: 10.7%

Antipsychotic Use Info Percent of long-stay residents who received an antipsychotic medication 15.6%
23% better than Massachusetts average

Massachusetts average: 20.3%

Pneumococcal Vaccine Info Percent of long-stay residents assessed and appropriately given the pneumococcal vaccine 97.2%
6% better than Massachusetts average

Massachusetts average: 91.9%

Influenza Vaccine Info Percent of long-stay residents assessed and appropriately given the seasonal influenza vaccine 94.0%
In line with Massachusetts average

Massachusetts average: 94.8%

Short-stay resident measures
Pneumococcal Vaccine Info Percent of short-stay residents assessed and appropriately given the pneumococcal vaccine 65.8%
14% worse than Massachusetts average

Massachusetts average: 76.7%

Antipsychotic medication increase Info Percent of short-stay residents who newly received an antipsychotic medication 0.0%
100% better than Massachusetts average

Massachusetts average: 1.3%

Influenza Vaccine Info Percent of short-stay residents assessed and appropriately given the seasonal influenza vaccine 39.2%
50% worse than Massachusetts average

Massachusetts average: 77.7%

Breakdown by payment type

Medicare

46% of new residents, usually for short-term rehab.

Typical stay 25 days

Private pay

37% of new residents, often for short stays.

Typical stay 2 - 3 months

Medicaid

17% of new residents, often for long-term daily care.

Typical stay 1 years

Facility Characteristics

Source: CMS Long-Term Care Facility Characteristics (Data as of Jan 2026)

Total residents 79
Medicare
11
13.9% of residents
Medicaid
41
51.9% of residents
Private pay or other
27
34.2% of residents
Programs & Services
Residents Group

Residents meet regularly to discuss policies, care quality, and activities

Active Resident Council

Organized group of residents that meets regularly to discuss facility policies, quality of life, and activities.

Finances and operations

Privately-owned community
Operated by a partnership between two or more business owners.
Home revenue
$17.1M
Operating loss
-$2.2M
Privately-owned community Operated by a partnership between two or more business owners.
Home revenue
$17.1M Rank #60 / 92Revenue — State benchmarkedThis home is ranked 60th out of 92 homes in Massachusetts. Shows this facility's annual revenue compared to the Massachusetts SNF average. Higher revenue generally means more resources for staffing and capital — read alongside Payroll %.Click the rank badge to see the full State ranking.Click here to see the full State ranking.
Operating loss
-$2.2M
Payroll costs Info The portion of the home's budget spent on staff, including nurses, caregivers, and other employees who support care and operations. Rank #62 / 92Payroll — State benchmarkedThis home is ranked 62nd out of 92 homes in Massachusetts. Shows total annual staff payroll benchmarked to the Massachusetts average. Higher payroll investment relative to peers often signals better staffing and less reliance on cheaper contract labor.Click the rank badge to see the full State ranking.Click here to see the full State ranking.
$8.3M
48.7% of revenue Rank #50 / 92Payroll % — State benchmarkedThis home is ranked 50th out of 92 homes in Massachusetts. Shows payroll as a percentage of revenue versus the Massachusetts average. Well-run Massachusetts SNFs typically land around 54–65% — the top third Statewide. Below 25% may signal understaffing or heavy agency use — read with Staffing ratings.Click the rank badge to see the full State ranking.Click here to see the full State ranking.
Other operating costs Info All remaining costs needed to run the home, such as food, utilities, building maintenance, supplies and administrative expenses.
$11.0M
Total costs $19.3M

What does this home offer?

Building type icon
Building type icon

Building Type: 3-story

On-site medical care and health services icon

On-site Medical Care and Health Services

Rehabilitative support icon

Rehabilitative Support

Beauty services icon

Beauty Services

Dining services icon

Dining Services

Social and recreational activities icon

Social and Recreational Activities

Who this home usually serves

TYPE OF STAY

Mostly short-term rehab stays

Most residents typically stay for a few weeks or months before returning home or moving on.

Places of interest near Charlwell House Health & Rehabilitation Center

Address 1.3 miles from city center Info Estimated distance in miles from Norwood's city center to Charlwell House Health & Rehabilitation Center's address, calculated via Google Maps.

Calculate Travel Distance to Charlwell House Health & Rehabilitation Center

Add your location

Address

Financial Assistance for
Nursing Home in Massachusetts

Charlwell House Health & Rehabilitation Center is located in Norwood, Massachusetts.
Here are the financial assistance programs available to residents in Massachusetts.

Get Financial aid guidance

Home Care Program

MassHealth Home Care

Age 60+
General Massachusetts resident, at risk of nursing home placement.
Income Limits (2025) ~$1,500/month individual, varies by region
Asset Limits $2,000 individual, excludes home, car
MA

Coordinated through Aging Services Access Points (ASAPs); high demand in urban areas.

Benefits
In-home care (3-5 hours/day) Homemaker services Respite care (up to 14 days/year) Adult day care (~$75/day)

Frail Elder Waiver

Massachusetts Medicaid FE Waiver

Age 65+
General Massachusetts resident, Medicaid-eligible, nursing home-level care need.
Income Limits (2025) ~$2,829/month 300% FBR, individual
Asset Limits $2,000 (individual), $3,000 (couple).
MA

Requires clinical eligibility determination.

Benefits
Personal care (5-7 hours/day) Respite care (240 hours/year) Adult day care (~$75/day) Home health services

Senior Care Options (SCO)

Massachusetts Senior Care Options

Age 65+
General Massachusetts resident, eligible for MassHealth (Medicare optional), nursing home-level care need.
Income Limits (2025) ~$2,829/month (300% FBR, individual); QIT allowed.
Asset Limits $2,000 (individual), $3,000 (couple) (excludes home up to $713,000, car).
MA

Not available in Dukes/Nantucket Counties; multiple SCO providers (e.g., CCA, Tufts).

Benefits
Personal care (5-7 hours/day) Medical care Respite (240 hours/year) Adult

Medicare Savings Program (MSP)

Massachusetts Medicare Savings Program (MassHealth Buy-In)

Age 65+ or disabled
General Massachusetts resident, Medicare Part A/B.
Income Limits (2025) ~$2,510/month (QMB), ~$3,380/month (SLMB), ~$3,598/month (QI)—individual.
Asset Limits $9,430 (individual), $14,130 (couple).
MA

Three tiers; no waitlist; includes Extra Help for Part D.

Benefits
Covers Part B premiums ($174.70/month) Deductibles ($240/year) Copays (~20%)

National Family Caregiver Support Program (NFCSP) Respite

Massachusetts NFCSP Respite Care

Age
General Caregivers of 60+ needing care or 55+ caregivers of others; Massachusetts resident; functional needs (2+ ADLs).
Income Limits (2025) Prioritizes ~$24,980/year (individual); no strict cap.
Asset Limits Not assessed; need-based.
MA

27 ASAPs; prioritizes low-income, rural caregivers.

Benefits
Respite (4-6 hours/week or 5 days/year) Adult day care ($60/day) Caregiver training Supplies (~$500/year)

Prescription Advantage

Massachusetts Prescription Advantage

Age 65+ or disabled
General Massachusetts resident, enrolled in Medicare Part D (or ineligible for Medicare).
Income Limits (2025) No strict limit; copays vary by income ~$24,980-$75,000/year individual
Asset Limits Not assessed.
MA

Supplements Medicare Part D; no enrollment fee for low-income.

Benefits
Covers prescription copays ($5-$40/drug) Fills coverage gaps Catastrophic cost protection ($4,000+ covered)

VA Aid and Attendance (A&A) and Housebound Benefits

Massachusetts VA Aid and Attendance/Housebound

Age 65+ or disabled veteran/spouse
General Massachusetts resident, wartime service, need for ADL help (A&A) or homebound.
Income Limits (2025) Net income < ~$1,984/month (veteran with dependent, A&A); pension offsets income.
Asset Limits ~$155,356 net worth limit
MA

High veteran demand statewide.

Benefits
Cash (~$1,433-$2,642/month veteran, ~$951-$1,318 spouse) for care costs (e.g., in-home, assisted living)

Compare Nursing Home around Norwood

The information below is reported by the Massachusetts Executive Office of Elder Affairs and Department of Public Health.

3 facilities compared · CMS & MA Dept. of Health data

Filter by care type
Victoria Haven Rehabilitation & Skilled Nursing Center
NH

Nursing Home Licensed facility providing 24/7 skilled nursing care for residents with complex, ongoing medical needs. Staffed by RNs, LPNs, and CNAs. Inspected and star-rated annually by CMS. Accepts Medicare (short-term rehab) and Medicaid (long-term care).

Norwood92 97.0% +18%3.88 -11%-1%$0115.5-86 79 Jennifer Crowley$16.8M$7.6M45.1%225334
The Ellis Rehabilitation and Nursing Center
NH

Nursing Home Licensed facility providing 24/7 skilled nursing care for residents with complex, ongoing medical needs. Staffed by RNs, LPNs, and CNAs. Inspected and star-rated annually by CMS. Accepts Medicare (short-term rehab) and Medicaid (long-term care).

HC

Home Care Professional care delivered in the person's own home — from companionship and errands to skilled nursing and therapy. Allows seniors to age in place. Medicare covers skilled home health when medically necessary.

RC

Respite Care Short-term temporary care — days to weeks — to give family caregivers a break. Full care provided during the stay. Often used after hospitalization or to trial a facility before a permanent placement decision.

Norwood191 63.3% -23%3.65 -41%-7%$147.1k436.13128 40 Anthony Franchi$20.4M$10.8M52.9%225211
Charlwell House Health & Rehabilitation Center
NH

Nursing Home Licensed facility providing 24/7 skilled nursing care for residents with complex, ongoing medical needs. Staffed by RNs, LPNs, and CNAs. Inspected and star-rated annually by CMS. Accepts Medicare (short-term rehab) and Medicaid (long-term care).

Norwood109 87.4% +7%3.55 +164%-10%$06315.8475 46 -$17.1M$8.3M48.7%225208

Frequently Asked Questions about Charlwell House Health & Rehabilitation Center

Is Charlwell House Health & Rehabilitation Center in a walkable area?

Charlwell House Health & Rehabilitation Center has a walk score of 46. Somewhat walkable. A few nearby services may be reachable on foot, but most trips require transportation.

What is the address of Charlwell House Health & Rehabilitation Center?

Charlwell House Health & Rehabilitation Center is located at 305 Walpole St, Norwood, MA 02062.

What is the phone number of Charlwell House Health & Rehabilitation Center?

(781) 762-7700 will put you in contact with the team at Charlwell House Health & Rehabilitation Center.

Is Charlwell House Health & Rehabilitation Center Medicare or Medicaid certified?

Yes — Charlwell House Health & Rehabilitation Center is a CMS-certified provider of Medicare and Medicaid.

Guides for Better Senior Living

Care Cost Calculator: See Prices in Your Area

Nursing Home Data Explorer

Don’t Wait Too Long: 7 Red Flag Signs Your Parent Needs Assisted Living Now

The True Cost of Assisted Living in 2025 – And How Families Are Paying For It

Understanding Senior Living Costs: Pricing Models, Discounts & Financial Assistance

Explore Open Rooms
1 Contact details
2 What type of senior care service are you looking for?
3 What budget do you have in mind for senior care?
4 How soon do you need to find care?
5 Additional details

Thank you for your interest!

Our team will be in touch shortly to help with next steps.