City Park Healthcare and Rehabilitation Center
CMS overall rating Info CMS (the Centers for Medicare & Medicaid Services) is the federal agency that rates nursing home quality. Its Overall Rating runs from 1 to 5 stars, combining health inspections, staffing, and quality measures, with inspections weighted most heavily.

City Park Healthcare and Rehabilitation Center

CMS overall rating Info CMS (the Centers for Medicare & Medicaid Services) is the federal agency that rates nursing home quality. Its Overall Rating runs from 1 to 5 stars, combining health inspections, staffing, and quality measures, with inspections weighted most heavily.
Calculator: See prices in your area
City Park Healthcare and Rehabilitation Center accepts Medicaid, Medicare, and private pay.

Overview of City Park Healthcare and Rehabilitation Center

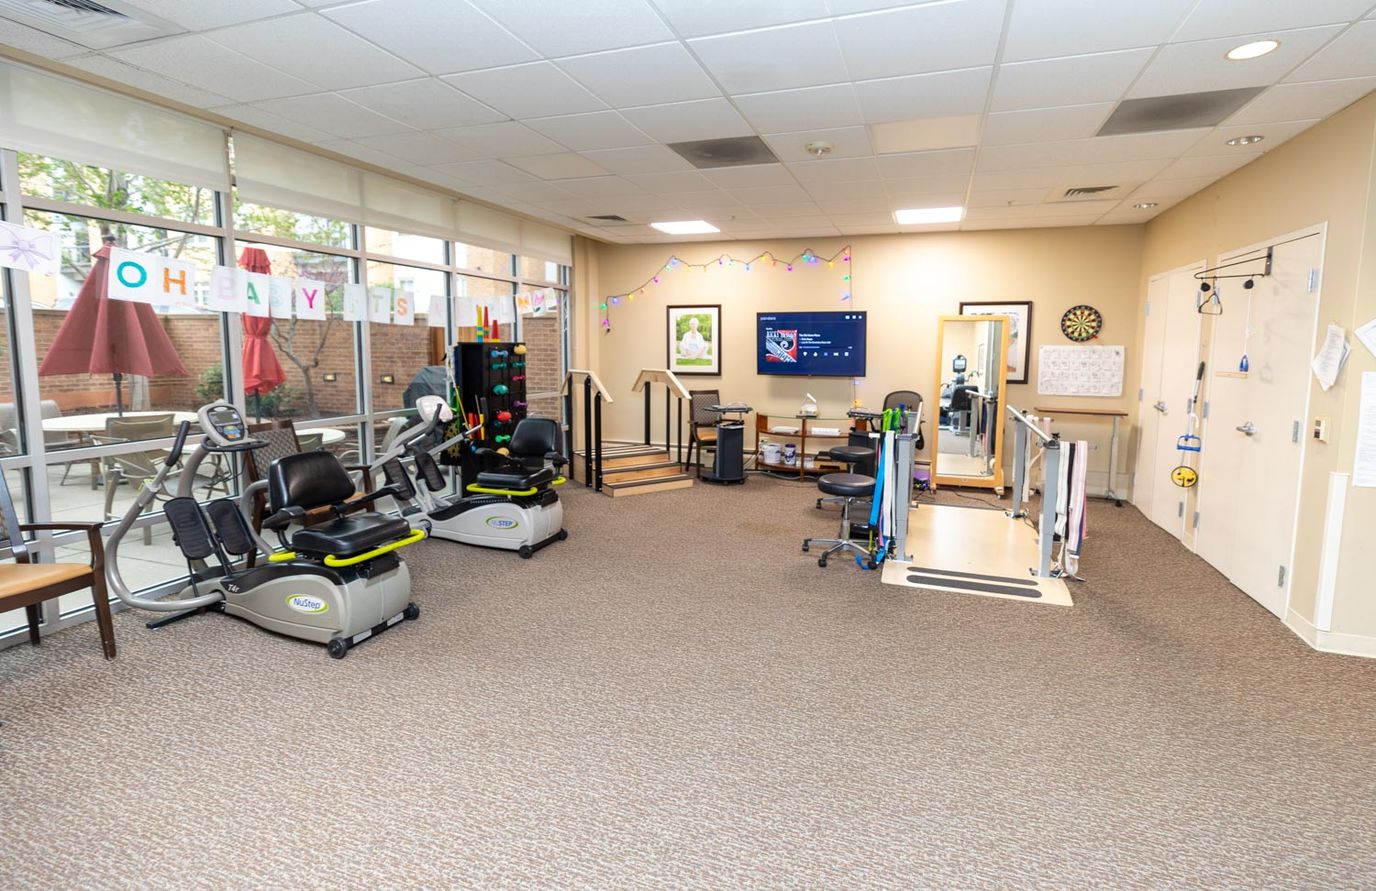
City Park Healthcare and Rehabilitation Center is a 150-bed SNF in Denver serving residents who need post-acute rehabilitation and continuous nursing care. Located at 1667 Saint Paul St in a walker’s paradise neighborhood with a Walk Score of 95, the community accepts Medicare, Medicaid, and private pay, offering flexible coverage options for families.

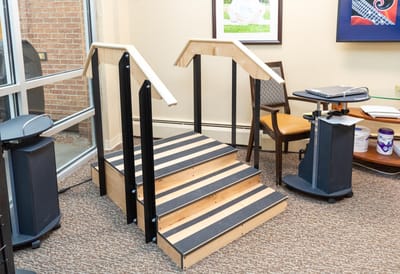
The facility maintains 150 beds with strong occupancy at 88 percent. Residents stay 138 days on average, indicating a mix of short-term rehabilitation and longer-term care. The community is well-staffed for hands-on care, with total nursing support averaging 2 hours 47 minutes per resident daily. This includes registered nurses, nurse aides, and licensed practical nurses working across three shifts to ensure consistent attention. Clinically, City Park Healthcare and Rehabilitation Center focuses on rehabilitation services with in-house therapy and maintains a physician on staff to oversee medical needs. The 24-hour staffing model means occupants get support 24/7, whether for post-surgical recovery, orthopedic rehab, or active skilled nursing care. The neighborhood location near downtown Denver and strong transit access make it convenient for family visits and access to community resources.

If City Park Healthcare and Rehabilitation Center is considered by families for a loved one’s care, they should tour it to see the rooms, meet the care team, and talk about particular rehabilitation goals or active care needs directly with the personnel.

Quality ratings

Measured by Centers for Medicare & Medicaid Services (CMS)

Overall rating Info The Overall CMS Rating combines results from health inspections, staffing levels and quality measures. Health inspections carry the most weight. Staffing and quality scores can increase or decrease the final rating based on performance compared to state and national standards.
▼ 4.6% Below CO avg. ▼ 4.6% Below CO avg.CO average: 3.1Click the badge to see the full State ranking.Click here to see the full State ranking.
Health Inspection Info Based on the results of the facility's three most recent standard inspections and any complaint investigations. CMS reviews the number, scope, and severity of deficiencies, with more recent findings weighted more heavily.
▼ 27.8% Below CO avg. ▼ 27.8% Below CO avg.CO average: 2.8Click the badge to see the full State ranking.Click here to see the full State ranking.
Staffing Info Measures average nursing staff hours per resident per day, including Registered Nurses (RNs) and total nursing staff. Ratings are adjusted based on the level of care residents require and are compared to state and national benchmarks.
At CO avg. At CO avg.CO average: 3.0Click the badge to see the full State ranking.Click here to see the full State ranking.
Quality Measures Info Based on clinical and physical health indicators reported to CMS, such as hospital readmissions, falls, pressure ulcers, and improvements in mobility. These measures reflect how well residents' health needs are being managed.
▲ 20.5% Above CO avg. ▲ 20.5% Above CO avg.CO average: 4.1Click the badge to see the full State ranking.Click here to see the full State ranking.

Staffing hours breakdown

Info Daily nursing hours per resident by staff type, reported to CMS. Higher is generally better — compare this facility to state and national averages to see where staffing stands.

Hours per resident per day — compared to Colorado state averages

Total nursing care / resident Info This home is ranked 197th out of 215 homes in Colorado for nurse hours. Total adjusted nursing hours per resident per day, combining RN, LPN, and aide time. CMS adjusts this for case-mix so facilities can be fairly compared.
2h 47m per day
Rank #197 / 215Nurse hours — State benchmarkedThis home is ranked 197th out of 215 homes in Colorado. Shows adjusted nurse hours per resident per day benchmarked to the Colorado average, with a ranking across 215 Colorado facilities. More hours mean more direct care. The national average is about 3.5 hrs; below 3.0 is a red flag.Rankings are based only on facilities in Colorado that report data for that category. Facilities without available data are excluded from the ranking.Click the rank badge to see the full State ranking.Click here to see the full State ranking.
This facility Colorado avg (3h 52m per day)
vs Colorado avg
-28%

6 of 6 metrics below state avg

Staff typeHours / Day / Residentvs state avg
Registered Nurse (RN) Info RNs hold the highest nursing license and can assess residents, interpret test results, and direct care plans. More RN hours per day often signals stronger clinical oversight and faster response to health changes. 29m per day ▼ 42% State avg: 50m per day · National avg: 41m per day
LPN / LVN Info Licensed Practical Nurses (LPNs) or Licensed Vocational Nurses (LVNs) deliver routine hands-on care — medication administration, wound dressing, and monitoring vital signs. They work under RN supervision and make up a large share of daily bedside care. 36m per day ▼ 12% State avg: 41m per day · National avg: 52m per day
Nurse Aide Info Certified Nurse Aides (CNAs) provide the most direct day-to-day assistance: bathing, dressing, feeding, and mobility. Nurse aide hours are typically the largest staffing category and directly affect residents' quality of life. 1h 53m per day ▼ 14% State avg: 2h 12m per day · National avg: 2h 20m per day
Weekend Total Nursing Info Combined nursing hours (RN + LPN + Nurse Aide) per resident per day on weekends. Staffing often drops on weekends — this figure reveals whether the facility maintains adequate coverage outside of weekday hours. 2h 39m per day ▼ 19% State avg: 3h 16m per day · National avg: 3h 26m per day
Physical Therapist Info Hours per resident per day provided by licensed Physical Therapists (PTs) or PT Assistants. PT services help residents recover mobility after injury or illness and are especially important for post-acute (short-stay) rehabilitation. 2m per day ▼ 53% State avg: 5m per day · National avg: 4m per day
Weekend RN Info Registered nurse hours specifically on weekends. Facilities sometimes reduce RN presence on Saturdays and Sundays — a low weekend RN figure compared to weekday hours can indicate reduced clinical oversight when most administrative staff are absent. 16m per day ▼ 54% State avg: 36m per day · National avg: 28m per day

Capacity and availability

Avg. Length of Stay
138 days
Bed community size
150-bed community Rank #43 / 533Bed count — State benchmarkedThis home is ranked 43rd out of 533 homes in Colorado. Shows this facility's certified or reported bed count compared to other Colorado facilities. Larger communities may offer more amenities, programs, and on-site services for residents and families.Rankings are based only on facilities in Colorado that report data for that category. Facilities without available data are excluded from the ranking.Click the rank badge to see the full State ranking.Click here to see the full State ranking.
A larger shared setting that may offer more common spaces and organized community services.
Walk Score
Walk Score: 95 / 100 Rank #7 / 872Walk Score — State benchmarkedThis home is ranked 7th out of 872 homes in Colorado. Shows how walkable this facility's neighborhood is compared to the average Walk Score across Colorado facilities. Higher scores benefit residents, families, and staff.Rankings are based only on facilities in Colorado that report data for that category. Facilities without available data are excluded from the ranking.Click the rank badge to see the full State ranking.Click here to see the full State ranking.
Walker's paradise. Daily errands do not require a car, with many shops and services nearby.

About this community

Occupancy

Occupancy rate
88%
Rank #60 / 221Occupancy rate — State benchmarkedThis home is ranked 60th out of 221 homes in Colorado. Shows this facility's occupancy rate versus the Colorado average, with its Statewide rank out of 221. Higher occupancy signals strong local demand and financial stability.Rankings are based only on facilities in Colorado that report data for that category. Facilities without available data are excluded from the ranking.Click the rank badge to see the full State ranking.Click here to see the full State ranking.
Higher than the Colorado average: 76.5%
Occupied beds
132 / 150
Average occupied beds in Colorado homes 72 beds

License Details

Facility TypeSnf/nf Dual Certification
StatusActive

Ownership & Operating Entity

City Park Healthcare and Rehabilitation Center is administered by Fasil Wondmagegn.

Owner NameHarmony Hill Healthcare, Inc

Payment & Insurance

2 services
Accept Medicaid
Accept Medicare

Therapy & Rehabilitation

1 service
Rehabilitation Services

Staffing & Medical

2 services
Doctor on Staff
24-Hour Staffing

Amenities & Lifestyle

Specific ProgramsIn-House Therapy

Contact City Park Healthcare and Rehabilitation Center

Inspection History

In Colorado, the Department of Public Health and Environment, Health Facilities Division is the regulatory body that performs unannounced surveys and publishes facility inspection findings.

Since 2021 · 5 years of data 51 deficiencies 8 inspections

Inspection Scorecard Info This scorecard compares key inspection, citation, and complaint metrics at this facility against the Colorado state average. Metrics rated ≥15% worse than average are highlighted in red; those ≥15% better are highlighted in green.

Since 2021 vs. Colorado state average
Overall vs. CO average 4 Worse Metrics worse than Colorado average:
• Total deficiencies (70% above)
• Deficiencies per year (70% above)
• Deficiencies per inspection (28% above)
• Total inspections (33% above)
0 Better No metrics in this bucket.
Latest Inspection December 10, 2025 Other An inspection that falls outside standard annual surveys and formal complaint investigations. May include administrative compliance checks, documentation reviews, focused surveys on specific concerns, or revisit surveys to verify prior corrections.

Deficiencies Info Deficiencies are formal regulatory issues recorded during state inspections.

This FacilityCO Averagevs. CO Avg
Total deficiencies Info Formal regulatory issues recorded by inspectors across all inspection types. 5130 This facility has 70% more total deficiencies than a typical Colorado nursing home (51 vs. CO avg 30).↑ 70% worse
Deficiencies per year Info Average deficiencies per year since 2021. 10.26 This facility has 70% more deficiencies per year than a typical Colorado nursing home (10.2 vs. CO avg 6).↑ 70% worse
Deficiencies per inspection Info Average deficiencies per inspection. 6.45 This facility has 28% more deficiencies per inspection than a typical Colorado nursing home (6.4 vs. CO avg 5).↑ 28% worse

Inspections Info State inspections evaluate whether the facility meets health and safety standards.

This FacilityCO Averagevs. CO Avg
Total inspections Info Combined count of all routine and focused inspections. Excludes complaint investigations. 86 This facility has 33% more total inspections than a typical Colorado nursing home (8 vs. CO avg 6).↑ 33% worse

Health Inspection History

Inspections since 2021
Total health inspections 7

Colorado average 4.8


Last Health inspection on Oct 2025

Total health citations
55 Rank #214 / 221Health citations — State benchmarkedThis home is ranked 214th out of 221 homes in Colorado. Shows this facility's total health deficiency citations benchmarked to the Colorado State average, with a ranking across all 221 CO facilities. Lower citation counts earn a better rank.Rankings are based only on facilities in Colorado that report data for that category. Facilities without available data are excluded from the ranking.Click the rank badge to see the full State ranking.Click here to see the full State ranking.

Colorado average 24.8

Citations per inspection
7.86 Rank #193 / 221Citations per inspection — State benchmarkedThis home is ranked 193rd out of 221 homes in Colorado. Shows average deficiency citations per CMS inspection for this facility versus the Colorado mean across 221 facilities with citation data. Lower is better.Rankings are based only on facilities in Colorado that report data for that category. Facilities without available data are excluded from the ranking.Click the rank badge to see the full State ranking.Click here to see the full State ranking.

Colorado average 5.2


Health citations are formal notices following inspections when they fail to comply with safety and care standards.

48 of 55 citations resulted from standard inspections; 6 of 55 resulted from complaint investigations; and 1 of 55 came from combined inspections (standard and complaint).

Breakdown of citation severity (last 5 years)
Critical health citations
1
150% worse than Colorado average

Colorado average: 0.4


Serious health citations
1
52% better than Colorado average

Colorado average: 2.1

1 critical citation Colorado average: 0.4

1 serious citation Colorado average: 2.1

53 moderate citations Colorado average: 22.2

0 minor citations Colorado average: 0.2
Citations history (last 5 years)
Abuse/Neglect serious citation Oct 30, 2025
Corrected

Abuse/Neglect moderate citation Mar 18, 2024
Corrected

Pharmacy moderate citation Jan 11, 2024
Corrected

Quality of Care moderate citation Jan 11, 2024
Corrected

Staffing Data

Reporting period: October 1 – December 31, 2025 (Q4 2025). Source: CMS Payroll-Based Journal report.

Total staff 133
Employees 122
Contractors 11
Staff to resident ratio 1.25 : 1
33% fewer staff per resident than Colorado average
Colorado average ratio: 1.88 : 1 Colorado average ratio: 1.88 : 1See full Colorado ranking
Avg staff/day 58
Average shift 8.1 hours
0% compared with Colorado average
Colorado average: 8.3 hours Colorado average shift: 8.3 hoursSee full Colorado ranking
Total staff hours (quarter) 43,407

Nursing staff breakdown

Q4 2025 · Oct 1 – Dec 31 More info This data comes from the CMS Payroll-Based Journal report covering October 1 – December 31, 2025.
Registered Nurse

Manages medical care and health needs.

RN Staff Info All 10 RN Staff are full-time employees. No contractors work on this role. 10
Average shift length Info Average shift length. Calculated as total hours divided by days worked and average staff per day. 10.4 hours
Licensed Practical Nurse

Assists with medical care and medications.

LPN Staff Info All 16 LPN Staff are full-time employees. No contractors work on this role. 16
Average shift length Info Average shift length. Calculated as total hours divided by days worked and average staff per day. 9.6 hours
Certified Nursing Assistant

Helps with daily care and mobility.

CNA Staff Info 67 total: 56 full-time employees and 11 contractors. 67
Average shift length Info Average shift length. Calculated as total hours divided by days worked and average staff per day. 7.7 hours

Contractor staffing

Q4 2025 · Oct 1 – Dec 31 More info This data comes from the CMS Payroll-Based Journal report covering October 1 – December 31, 2025.

Total hours from contractors

0.3%

148 contractor hours this quarter

Certified Nursing Assistant: 11

Staff by category

Q4 2025 · Oct 1 – Dec 31 More info This data comes from the CMS Payroll-Based Journal report covering October 1 – December 31, 2025.
Certified Nursing Assistant56116720,42592100%7.7
Licensed Practical Nurse160165,93492100%9.6
Registered Nurse100103,35292100%10.4
Other Dietary Services Staff7072,8739199%7.6
Dental Services Staff8082,7479199%7.7
Clinical Nurse Specialist5051,3846672%8.6
Speech Language Pathologist2029766773%7.9
Physical Therapy Aide2029417683%8.9
Physical Therapy Assistant3038076975%8.6
Qualified Social Worker4047896975%7.1
RN Director of Nursing1015766470%9
Nurse Practitioner1015586470%8.7
Administrator1015286672%8
Occupational Therapy Aide1015166672%7.8
Dietitian1014806065%8
Respiratory Therapy Technician2024255459%7.6
Medication Aide/Technician101971314%7.4
Occupational Therapy Assistant101211%1.5
67 Certified Nursing Assistant
% of Days 100%
16 Licensed Practical Nurse
% of Days 100%
10 Registered Nurse
% of Days 100%
7 Other Dietary Services Staff
% of Days 99%
8 Dental Services Staff
% of Days 99%
5 Clinical Nurse Specialist
% of Days 72%
2 Speech Language Pathologist
% of Days 73%
2 Physical Therapy Aide
% of Days 83%
3 Physical Therapy Assistant
% of Days 75%
4 Qualified Social Worker
% of Days 75%
1 RN Director of Nursing
% of Days 70%
1 Nurse Practitioner
% of Days 70%
1 Administrator
% of Days 72%
1 Occupational Therapy Aide
% of Days 72%
1 Dietitian
% of Days 65%
2 Respiratory Therapy Technician
% of Days 59%
1 Medication Aide/Technician
% of Days 14%
1 Occupational Therapy Assistant
% of Days 1%

Penalties and fines

Federal penalties imposed by CMS for regulatory violations, including civil money penalties (fines) and denials of payment for new Medicare/Medicaid admissions.

Source: CMS Penalties Database

No penalties in the past 3 years

No civil money penalties or payment denials were reported in the last 3 years.

Quality of care over time

These measures show how residents usually do over time at this home, based on health outcomes and preventive care.

High-risk clinical events score Info A composite score based on pressure ulcers, falls with injury, weight loss, walking ability decline, and activities of daily living decline. 11.1
23% worse than Colorado average

Colorado average: 9.0

Functional decline score Info A composite score based on activities of daily living decline, walking ability decline, and incontinence. 19.6
In line with Colorado average

Colorado average: 18.8

Long-stay resident measures
Significantly above average Info CMS star rating based on long-stay quality measure performance. 5 stars = significantly above average, 1 star = significantly below average.
Need for Help with Daily Activities Increased Info Percent of long-stay residents whose need for help with daily activities has increased 22.6%
41% worse than Colorado average

Colorado average: 16.0%

Walking Ability Worsened Info Percent of long-stay residents whose ability to move independently worsened 20.6%
21% worse than Colorado average

Colorado average: 17.0%

Low Risk Residents with Bowel/Bladder Incontinence Info Percent of low risk long-stay residents who lose control of their bowels or bladder 15.5%
33% better than Colorado average

Colorado average: 23.2%

Falls with Major Injury Info Percent of long-stay residents experiencing one or more falls with major injury 2.3%
32% better than Colorado average

Colorado average: 3.3%

High Risk Residents with Pressure Ulcers Info Percent of long-stay high risk residents with pressure ulcers 4.0%
In line with Colorado average

Colorado average: 3.9%

Urinary Tract Infection Info Percent of long-stay residents with a urinary tract infection 0.5%
64% better than Colorado average

Colorado average: 1.4%

Lost Too Much Weight Info Percent of long-stay residents who lose too much weight 6.2%
19% worse than Colorado average

Colorado average: 5.2%

Depressive Symptoms Info Percent of long-stay residents who have depressive symptoms 23.0%
220% worse than Colorado average

Colorado average: 7.2%

Antipsychotic Use Info Percent of long-stay residents who received an antipsychotic medication 12.8%
32% better than Colorado average

Colorado average: 18.8%

Pneumococcal Vaccine Info Percent of long-stay residents assessed and appropriately given the pneumococcal vaccine 88.8%
5% worse than Colorado average

Colorado average: 93.3%

Influenza Vaccine Info Percent of long-stay residents assessed and appropriately given the seasonal influenza vaccine 92.2%
In line with Colorado average

Colorado average: 94.7%

Hospitalizations per 1,000 days Info Number of hospitalizations per 1,000 long-stay resident days. 1.06
18% better than Colorado average

Colorado average: 1.30

ED visits per 1,000 days Info Number of outpatient emergency department visits per 1,000 long-stay resident days. 0.31
81% better than Colorado average

Colorado average: 1.67

Short-stay resident measures
Significantly above average Info CMS star rating based on short-stay quality measure performance. 5 stars = much above average, 1 star = much below average.
Pneumococcal Vaccine Info Percent of short-stay residents assessed and appropriately given the pneumococcal vaccine 83.9%
10% better than Colorado average

Colorado average: 76.6%

Antipsychotic medication increase Info Percent of short-stay residents who newly received an antipsychotic medication 1.7%
19% worse than Colorado average

Colorado average: 1.4%

Influenza Vaccine Info Percent of short-stay residents assessed and appropriately given the seasonal influenza vaccine 85.9%
14% better than Colorado average

Colorado average: 75.6%

Re-hospitalized after SNF stay Info Percentage of short-stay residents who were re-hospitalized after their nursing home admission. 19.3%
5% better than Colorado average

Colorado average: 20.3%

Emergency department visits Info Percentage of short-stay residents who had an outpatient emergency department visit. 3.5%
73% better than Colorado average

Colorado average: 12.8%

Falls with major injury Info Percentage of SNF residents who experience falls with major injury during their stay. 0.0%
100% better than Colorado average

Colorado average: 0.8%

Ability to care for self at discharge Info Percentage of residents at or above expected ability to care for themselves at discharge. 81.8%
52% better than Colorado average

Colorado average: 53.7%

Breakdown by payment type

Medicare

10% of new residents, usually for short-term rehab.

Typical stay 21 days

Private pay

48% of new residents, often for short stays.

Typical stay 2 - 3 months

Medicaid

42% of new residents, often for long-term daily care.

Typical stay 7 - 8 months

Facility Characteristics

Source: CMS Long-Term Care Facility Characteristics (Data as of Jan 2026)

Total residents 106
Medicare
2
1.9% of residents
Medicaid
55
51.9% of residents
Private pay or other
49
46.2% of residents
Programs & Services
Residents Group

Residents meet regularly to discuss policies, care quality, and activities

Active Resident Council

Organized group of residents that meets regularly to discuss facility policies, quality of life, and activities.

Finances and operations

Based on CMS SNF Cost Report for fiscal year ending in 12/2023.

Voluntary non-profit community
Operated by a church.
Net patient revenue Info Net patient revenue — what the home actually collects for resident care, after contractual allowances, bad debt and discounts are subtracted from its gross charges (CMS cost report, Worksheet G-3). It covers resident care only; money the home earns from other sources is shown separately as "Other income."
$13.4M
Net patient income Info Net patient income: net patient revenue minus the home's total operating expenses. A positive figure means it earns more from resident care than it spends to deliver it; a negative figure means the opposite. It excludes non-operating "other income."
-$365.0K
Voluntary non-profit community Operated by a church.
Net patient revenue Info Net patient revenue — what the home actually collects for resident care, after contractual allowances, bad debt and discounts are subtracted from its gross charges (CMS cost report, Worksheet G-3). It covers resident care only; money the home earns from other sources is shown separately as "Other income."
$13.4M Rank #70 / 221Revenue — State benchmarkedThis home is ranked 70th out of 221 homes in Colorado. Shows this facility's annual revenue compared to the Colorado average. Higher revenue generally means more resources for staffing and capital — read alongside Payroll %.Rankings are based only on facilities in Colorado that report data for that category. Facilities without available data are excluded from the ranking.Click the rank badge to see the full State ranking.Click here to see the full State ranking.
Net patient income Info Net patient income: net patient revenue minus the home's total operating expenses. A positive figure means it earns more from resident care than it spends to deliver it; a negative figure means the opposite. It excludes non-operating "other income."
-$365.0K
Other income Info Money the home earns outside of resident care — such as investments, grants, rentals and other non-operating sources (CMS cost report, Worksheet G-3). It is tracked separately from net patient revenue: it is not part of that figure, and it is not included in net patient income.
$459.1K
Payroll costs Info Staff salaries plus wage-related costs — benefits such as payroll taxes, health insurance and retirement — from the home's own accounting records (CMS cost report, Worksheet A). Contract or agency labor is counted separately, under other operating costs. Rank #56 / 221Payroll — State benchmarkedThis home is ranked 56th out of 221 homes in Colorado. Shows total annual staff payroll benchmarked to the Colorado average. Higher payroll investment relative to peers often signals better staffing and less reliance on cheaper contract labor.Rankings are based only on facilities in Colorado that report data for that category. Facilities without available data are excluded from the ranking.Click the rank badge to see the full State ranking.Click here to see the full State ranking.
$6.7M 50% of net patient revenue Info Payroll as a share of revenue: staff salaries and wage-related benefits divided by net patient revenue. A higher figure means more of each revenue dollar goes to staff pay. Rank #92 / 221Payroll % — State benchmarkedThis home is ranked 92nd out of 221 homes in Colorado. Shows payroll as a percentage of revenue versus the Colorado average. Well-run Colorado facilities typically land around 59–66% — the top third Statewide. Below 25% may signal understaffing or heavy agency use — read with Staffing ratings.Rankings are based only on facilities in Colorado that report data for that category. Facilities without available data are excluded from the ranking.Click the rank badge to see the full State ranking.Click here to see the full State ranking.
Other operating costs Info Everything it costs to run the home apart from payroll — food, utilities, supplies, maintenance, contract labor and administration. Calculated as total operating expense minus payroll (staff salaries and wage-related benefits).
$7.1M
Total costs Info The home's total operating expense for the year — all the costs of running it, salaries included (CMS cost report, Worksheet G-3).
$13.8M

Who this home usually serves

TYPE OF STAY

Mix of rehab and long-term care

This home supports both short-term rehab and long-term care, with residents staying for a wide range of durations.

New residents most often arrive under private pay (48% of admissions), and a typical private pay stay runs around 2 - 3 months.

Admissions
290 total

Coverage residents most often arrive under.

Medicare 10%
Private pay 48%
Medicaid 42%
Discharges
290 total

Coverage residents most often leave under.

Medicare 3%
Private pay 56%
Medicaid 40%

Places of interest near City Park Healthcare and Rehabilitation Center

Address 0.0 miles from city center Info Estimated distance in miles from Denver's city center to City Park Healthcare and Rehabilitation Center's address, calculated via Google Maps.

Calculate Travel Distance to City Park Healthcare and Rehabilitation Center

Add your location

Address

Compare Nursing Homes around Denver

The information below is reported by the Colorado Department of Public Health and Environment, Health Facilities Division.

5 facilities compared · CMS & CO Dept. of Health data

Hallmark Nursing Center
NH
Denver (Fort Logan)
143
Facility 143
CO AVG 76
Rank #51 / 533
62.9%
Facility 62.9%
CO AVG 76.5%
Rank #165 / 221
-18%
3.72
Facility 3.72
CO AVG 3.86
Rank #96 / 215
+24%-4%
$6.8k
Facility $6.8k
CO AVG $39.2k
Rank #90 / 221
22
Facility 22
CO AVG 24.8
Rank #100 / 221
3.7
Facility 3.7
CO AVG 5.2
Rank #60 / 221
494A+
16
Facility 16
CO AVG 51
Rank #777 / 872
Pueblo Medical Investors, LLC
$10.9M
Facility $10.9M
CO AVG $11.2M
Rank #99 / 221
$7.8M
Facility $7.8M
CO AVG $4.9M
Rank #45 / 221
71.2%
Facility 71.2%
CO AVG 46.6%
Rank #8 / 221
65233
Berkley Manor Care Center
NH
HC
Denver
118
Facility 118
CO AVG 76
Rank #94 / 533
74.3%
Facility 74.3%
CO AVG 76.5%
Rank #130 / 221
-3%
4.33
Facility 4.33
CO AVG 3.86
Rank #45 / 215
-4%+12%
$17.2k
Facility $17.2k
CO AVG $39.2k
Rank #124 / 221
29
Facility 29
CO AVG 24.8
Rank #147 / 221
9.7
Facility 9.7
CO AVG 5.2
Rank #214 / 221
272A+
95
Facility 95
CO AVG 51
Rank #7 / 872
Morgan Rustad
$8.3M
Facility $8.3M
CO AVG $11.2M
Rank #140 / 221
$6.1M
Facility $6.1M
CO AVG $4.9M
Rank #102 / 221
74.2%
Facility 74.2%
CO AVG 46.6%
Rank #38 / 221
65223
Briarwood Health Care Center
NH
RC
Denver
201
Facility 201
CO AVG 76
Rank #10 / 533
75.3%
Facility 75.3%
CO AVG 76.5%
Rank #123 / 221
-2%
4.42
Facility 4.42
CO AVG 3.86
Rank #34 / 215
-10%+15%
$9.1k
Facility $9.1k
CO AVG $39.2k
Rank #102 / 221
22
Facility 22
CO AVG 24.8
Rank #100 / 221
5.5
Facility 5.5
CO AVG 5.2
Rank #132 / 221
589A+
95
Facility 95
CO AVG 51
Rank #7 / 872
Hollie Hoyle
$9.8M
Facility $9.8M
CO AVG $11.2M
Rank #132 / 221
$6.7M
Facility $6.7M
CO AVG $4.9M
Rank #67 / 221
68.6%
Facility 68.6%
CO AVG 46.6%
Rank #11 / 221
65255
City Park Healthcare and Rehabilitation Center
NH
Denver
150
Facility 150
CO AVG 76
Rank #43 / 533
88.0%
Facility 88.0%
CO AVG 76.5%
Rank #60 / 221
+15%
2.78
Facility 2.78
CO AVG 3.86
Rank #197 / 215
-47%-28%
$12.7k
Facility $12.7k
CO AVG $39.2k
Rank #111 / 221
55
Facility 55
CO AVG 24.8
Rank #214 / 221
7.9
Facility 7.9
CO AVG 5.2
Rank #193 / 221
2118-
95
Facility 95
CO AVG 51
Rank #7 / 872
-
$13.4M
Facility $13.4M
CO AVG $11.2M
Rank #70 / 221
$6.7M
Facility $6.7M
CO AVG $4.9M
Rank #56 / 221
50%
Facility 50%
CO AVG 46.6%
Rank #92 / 221
65009
Brookdale Lowry -
NH
AL
IL
MC
Denver (East)
172
Facility 172
CO AVG 76
Rank #23 / 533
69.9%
Facility 69.9%
CO AVG 76.5%
Rank #146 / 221
-9%------------
90
Facility 90
CO AVG 51
Rank #36 / 872
$4.6M
Facility $4.6M
CO AVG $11.2M
Rank #204 / 221
$3.5M
Facility $3.5M
CO AVG $4.9M
Rank #191 / 221
76.9%
Facility 76.9%
CO AVG 46.6%
Rank #56 / 221
65433

Financial Assistance for
Nursing Home in Colorado

City Park Healthcare and Rehabilitation Center is located in DENVER, Colorado.
Here are the financial assistance programs available to residents in Colorado.

Get Financial aid guidance

Elderly, Blind, and Disabled Waiver

Colorado Medicaid EBD Waiver

Age 65+ or disabled
General Colorado resident, Medicaid- eligible, nursing home-level care need.
Income Limits (2025) ~$2,829/month 300% FBR, individual
Asset Limits $2,000 (individual), $3,000 (couple).
CO

Requires level-of-care assessment by case manager.

Benefits
Personal care (5-7 hours/day) Respite care (up to 240 hours/year) Adult day care ($65/day) Home modifications ($1,500 avg.)

Old Age Pension (OAP) Health Care Program

Colorado OAP

Age 60+
General Colorado resident.
Income Limits ~$1,215/month individual
Asset Limits $2,000 individual
CO

Supplements SSI; limited medical coverage.

Benefits
Cash (~$100-$800/month) Limited in-home care (2-3 hours/week) Medical assistance

Program of All-Inclusive Care for the Elderly (PACE)

Colorado Medicaid PACE

Age 55+
General Colorado resident, nursing home-level care need, safe with PACE support.
Income Limits (2025) ~$2,829/month 300% FBR
Asset Limits $2,000 (individual), $3,000 (couple).
CO

Limited to specific regions (e.g., Denver, Pueblo).

Benefits
All-inclusive care—personal care (5-7 hours/day) Meals Transportation Therapy Medical visits

Home Care Allowance (HCA)

Colorado Home Care Allowance (HCA)

Age
General Seniors typically 65+, Age 5+ with disability, Colorado resident, financial/functional need.
Income Limits (2025) ~$1,004/month individual, stricter than waivers
Asset Limits $2,000 (individual), $3,000 (couple).
CO

Must need help with ADLs; not Medicaid-waiver eligible.

Benefits
Personal care (~4-6 hours/day, paid to provider) E.g. Bathing Dressing

Frequently Asked Questions about City Park Healthcare and Rehabilitation Center

What neighborhood is City Park Healthcare and Rehabilitation Center in?

City Park Healthcare and Rehabilitation Center is in the USA neighborhood of DENVER.

Who is the owner of City Park Healthcare and Rehabilitation Center?

The legal owner and operator of City Park Healthcare and Rehabilitation Center is Harmony Hill Healthcare, Inc..

Is City Park Healthcare and Rehabilitation Center in a walkable area?

City Park Healthcare and Rehabilitation Center has a walk score of 95. Walker's paradise. Daily errands do not require a car, with many shops and services nearby.

What is the occupancy rate at City Park Healthcare and Rehabilitation Center?

City Park Healthcare and Rehabilitation Center's occupancy is 88%.

Who is the administrator of City Park Healthcare and Rehabilitation Center?

Fasil Wondmagegn is the administrator of City Park Healthcare and Rehabilitation Center.

How many beds does City Park Healthcare and Rehabilitation Center have?

City Park Healthcare and Rehabilitation Center has 150 beds.

Are there photos of City Park Healthcare and Rehabilitation Center?

Yes — there are 8 photos of City Park Healthcare and Rehabilitation Center in the photo gallery on this page.

Guides for Better Senior Living

Care Cost Calculator: See Prices in Your Area

Nursing Home Data Explorer

Don’t Wait Too Long: 7 Red Flag Signs Your Parent Needs Assisted Living Now

The True Cost of Assisted Living in 2025 – And How Families Are Paying For It

Understanding Senior Living Costs: Pricing Models, Discounts & Financial Assistance