Explore Open Rooms
1 Contact details
2 What type of senior care service are you looking for?
3 What budget do you have in mind for senior care?
4 How soon do you need to find care?
5 Additional details

Thank you for your interest!

Our team will be in touch shortly to help with next steps.

Nursing Home in Tarrant County

CMS overall rating Info The Overall CMS Rating combines results from health inspections, staffing levels and quality measures. Health inspections carry the most weight. Staffing and quality scores can increase or decrease the final rating based on performance compared to state and national standards.

Cityview Nursing and Rehabilitation Center

Overview of Cityview Nursing and Rehabilitation Center

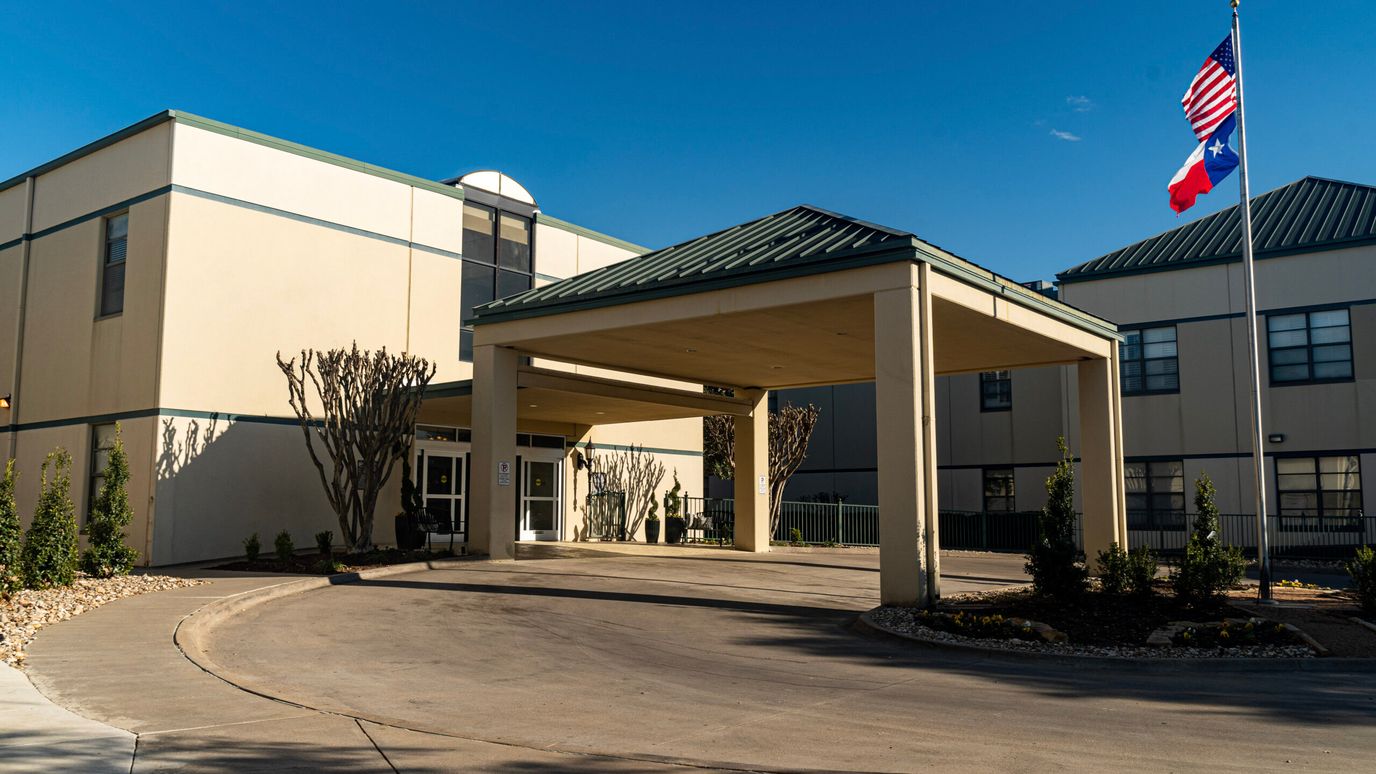
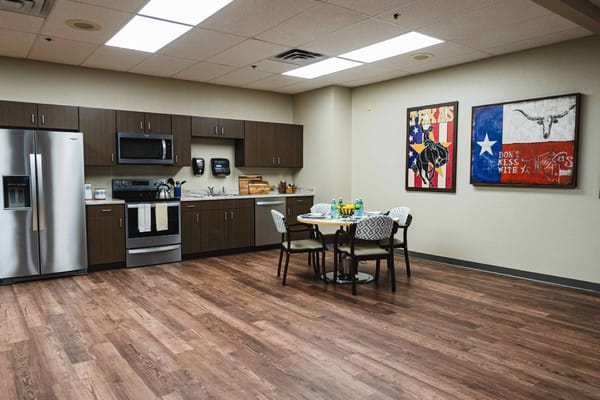
Conveniently located near Kindred Hospital Tarrant County- Forth Worth in Bryant Irvin Road, Fort Worth, TX, Cityview Nursing and Rehabilitation Center is an outstanding community that focuses on skilled care. The community offers different levels of care for those who need pulmonary care, stroke care, wound care, respiratory therapy, cardiac care, and respite care. With its cozy and specially designed accommodations in variations of private and semi-private room, residents have the freedom to choose the best accommodation according to their preferences.

Here, Medicaid, Medicare, Managed Care, and Private Pay are accepted to maximize residents’ resources for the highest quality of life in their later years. Therapy services including physical, speech, occupational, and outpatient are offered to enhance residents’ wellbeing. The community is a good choice for those who need supplementary care in their later years with its extensive care and purposely built amenities.

(817) 346-3030

Quality ratings

Measured by Centers for Medicare & Medicaid Services (CMS)

Overall rating Info The Overall CMS Rating combines results from health inspections, staffing levels and quality measures. Health inspections carry the most weight. Staffing and quality scores can increase or decrease the final rating based on performance compared to state and national standards.
2/5
Texas average: 3.0/5
Health Inspection Info Based on the results of the facility's three most recent standard inspections and any complaint investigations. CMS reviews the number, scope, and severity of deficiencies, with more recent findings weighted more heavily.
1/5
Texas average: 2.9/5
Staffing Info Measures average nursing staff hours per resident per day, including Registered Nurses (RNs) and total nursing staff. Ratings are adjusted based on the level of care residents require and are compared to state and national benchmarks.
2/5
Texas average: 2.4/5
Quality Measures Info Based on clinical and physical health indicators reported to CMS, such as hospital readmissions, falls, pressure ulcers, and improvements in mobility. These measures reflect how well residents' health needs are being managed.
5/5
Texas average: 4.0/5

Nursing care per resident

Info This shows how many total hours of nursing staff time are available per resident each day. Higher numbers usually mean more staff support.
3h 44m per day

This home provides 1% less nursing time per resident than the Texas average.

Texas average: 3h 47m per day

Staffing hours breakdown

Info Hours of care per resident per day, broken down by staff type. Data from CMS Medicare.
Staff type Facility State avg National avg
Registered Nurse (RN) Info Registered nurse hours per resident per day. 26m per day 26m per day 41m per day
Nurse Aide Info Nurse aide hours per resident per day. 1h 55m per day 2h 1m per day 2h 21m per day
Total Nursing (Weekend) Info Total number of nurse staff hours per resident per day on weekends. 3h 10m per day 2h 59m per day 3h 26m per day
RN (Weekend) Info Registered nurse hours per resident per day on weekends. 19m per day 21m per day 29m per day

Capacity and availability

High-capacity home

May provide extensive amenities, services and programs.

Total beds 210

This home usually has availability

Lower occupancy suggests more openings may be available.

Lower demand than the Texas average
Occupancy rate 70.7%
Residents per day (avg) 174
Occupancy rate
70.7%
Residents per day (avg)
174

Who this home usually serves

TYPE OF STAY

Primarily short stays

Residents typically stay for brief periods, with frequent admissions and discharges throughout the year.

Might be optimal for
Post-acute recovery Temporary care Transitional stays

Breakdown by payment type

Medicare

16% of new residents, usually for short-term rehab.

Typical stay 28 days

Private pay

78% of new residents, often for short stays.

Typical stay 30 days

Medicaid

6% of new residents, often for long-term daily care.

Typical stay 4 years

Finances and operations

Governmental community
Operated by city and county authorities.
Home revenue
$14.9M
Surplus of revenue
$1.6M
Governmental community Operated by city and county authorities.
Home revenue
$14.9M
Surplus of revenue
$1.6M
Payroll costs Info The portion of the home's budget spent on staff, including nurses, caregivers, and other employees who support care and operations.
$7.2M
48.4% of revenue
Other operating costs Info All remaining costs needed to run the home, such as food, utilities, building maintenance, supplies and administrative expenses.
$6.1M
Total costs $13.3M
Bed community size
210-bed community
A large-scale community that may provide a wide range of amenities, services, and structured programs.
Years in operation
23 years in operation
A longer operating history, which may indicate experience navigating regulations and delivering ongoing care.
Walk Score
Walk Score: 56 / 100
Moderately walkable. Some errands can be accomplished on foot, with a mix of nearby amenities.

Services

Medicare/medicaid

About this community

License Details

Facility TypeNursing
StatusActive
IssuanceAugust 31, 2024
ExpirationAugust 31, 2027
CountyTARRANT

Additional Licensing Details

License Number143861
Year Opened7/2/2002

Ownership & Operating Entity

Cityview Nursing and Rehabilitation Center is administrated by John Norris.

Management CompanyREGENCY IHS OF CITYVIEW FORT WORTH, LLC
OwnerDECATUR HOSPITAL AUTHORITY
Ownership TypeHOSPITAL DISTRICT/AUTHORITY

Type Of Units

Medicare
67 units
Medicaid and Medicare
143 units
Total beds
210 units

Staffing

Key information about the people who lead and staff this community.

Leadership

Administrator Email [email protected]

What does this home offer?

Housing options icon

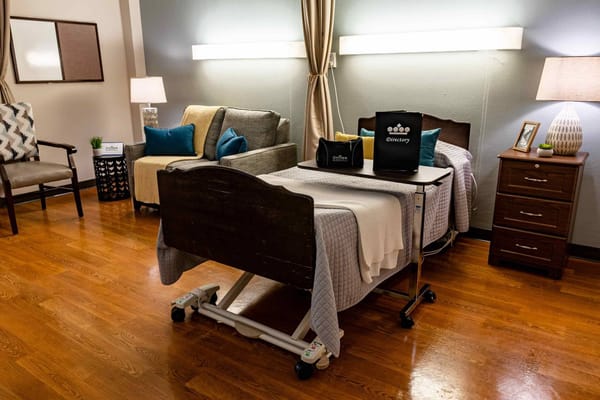
Housing Options: Private / Semi-Private Rooms

Building type icon
Building type icon

Building Type: 2-story

Transportation services icon

Transportation Services

Beauty services icon

Beauty Services

Recreational activities icon

Recreational Activities
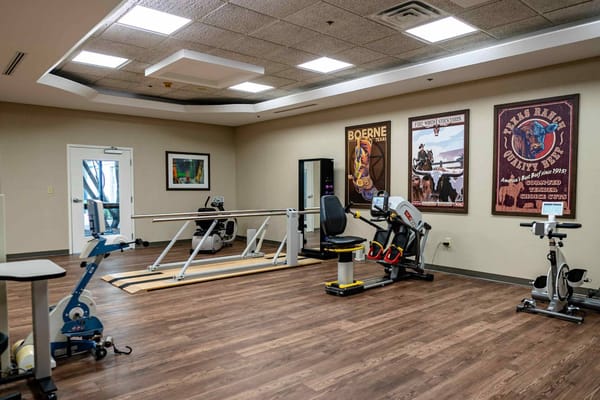
Exercise program icon

Exercise Programs

Types of Care at Cityview Nursing and Rehabilitation Center

Nursing Home Hospice Care Home Care

Contact Cityview Nursing and Rehabilitation Center

Inspection History

In Texas, the Health and Human Services Commission (HHSC) is the primary regulatory body that conducts unannounced inspections and publishes quality reports for all long-term care homes.

13 visits/inspections

7 visits/inspections triggered by complaints

5 routine inspections

Results

11 with issues

2 without issues

Latest inspection

Date August 21, 2025
Routine

54 deficiencies

Deficiencies indicate regulatory issues. A higher number implies the facility had several areas requiring improvement.

Texas average: 32 deficiencies

Health Inspection History

Inspections
Total health inspections 11

Texas average 7.4


Last Health inspection on Aug 2025

Total health citations 40

Texas average 25.9

Citations per inspection
3.64

Texas average 3.67


Health citations are formal notices following inspections when they fail to comply with safety and care standards.

14 of 40 citations resulted from standard inspections; 12 of 40 resulted from complaint investigations; and 14 of 40 came from combined inspections (standard and complaint).

Breakdown of citation severity (last 3 years)
Critical Health citations More info 4
100% worse than Texas average

Texas average: 2


Serious Health citations More info 0
100% better than Texas average

Texas average: 0.4

4 critical citations More info Texas average: 2

0 serious citations More info Texas average: 0.4

36 moderate citations More info Texas average: 23

0 minor citations More info Texas average: 0.4
Citations history (last 3 years)
Pharmacy moderate citation Info Issues related to medication management, including how drugs are stored, administered, and monitored. Aug 21, 2025
Corrected

Quality of Care moderate citation Info Issues related to how well residents receive appropriate treatment and support for their medical and daily care needs. Aug 21, 2025
Corrected

Quality of Care moderate citation Info Issues related to how well residents receive appropriate treatment and support for their medical and daily care needs. Aug 21, 2025
Corrected

Care Planning moderate citation Info Issues related to creating and updating personalized care plans for residents based on their needs and conditions. Aug 21, 2025
Corrected

Compare Nursing Homes around Tarrant County The information below is reported by the Texas Health and Human Services Commission.

5 facilities compared · CMS & TX Dept. of Health data · Updated Apr 2026

Filter by care type
Village Creek Wellness and Rehabilitation
NH

Nursing Home Licensed facility providing 24/7 skilled nursing care for residents with complex, ongoing medical needs. Staffed by RNs, LPNs, and CNAs. Inspected and star-rated annually by CMS. Accepts Medicare (short-term rehab) and Medicaid (long-term care).

Fort Worth
100
80.7%
+27%
2.80
-41%
-23%
2
19
3.8
2
84
-
26
Village Creek Nursing & Rehabilitation Llc
$2.4M
$1.2M
49%
675977
Semi-Private Rooms
Arbor Lake Nursing and Rehabilitation
NH

Nursing Home Licensed facility providing 24/7 skilled nursing care for residents with complex, ongoing medical needs. Staffed by RNs, LPNs, and CNAs. Inspected and star-rated annually by CMS. Accepts Medicare (short-term rehab) and Medicaid (long-term care).

Fort Worth (Bricktown)
123
67.9%
+7%
3.43
-5%
-6%
3
34
2.8
3
88
-
69
Arbor Lake Nursing & Rehabilitation Llc
$6.8M
$3.5M
51.8%
675034
Private Rooms
Fort Worth Transitional Care Center
HC

Home Care Professional care delivered in the person's own home — from companionship and errands to skilled nursing and therapy. Allows seniors to age in place. Medicare covers skilled home health when medically necessary.

HC

Home Care Professional care delivered in the person's own home — from companionship and errands to skilled nursing and therapy. Allows seniors to age in place. Medicare covers skilled home health when medically necessary.

NH

Nursing Home Licensed facility providing 24/7 skilled nursing care for residents with complex, ongoing medical needs. Staffed by RNs, LPNs, and CNAs. Inspected and star-rated annually by CMS. Accepts Medicare (short-term rehab) and Medicaid (long-term care).

Fort Worth
136
54.4%
-14%
3.15
+151%
-13%
3
51
3.2
3
84
-
56
Regency Ihs Of Fort Worth Llc
$7.6M
$4.9M
64.5%
676255
Private / Semi-Private Rooms
Cityview Nursing and Rehabilitation Center
HC

Home Care Professional care delivered in the person's own home — from companionship and errands to skilled nursing and therapy. Allows seniors to age in place. Medicare covers skilled home health when medically necessary.

HC

Home Care Professional care delivered in the person's own home — from companionship and errands to skilled nursing and therapy. Allows seniors to age in place. Medicare covers skilled home health when medically necessary.

NH

Nursing Home Licensed facility providing 24/7 skilled nursing care for residents with complex, ongoing medical needs. Staffed by RNs, LPNs, and CNAs. Inspected and star-rated annually by CMS. Accepts Medicare (short-term rehab) and Medicaid (long-term care).

Fort Worth
210
70.7%
+11%
3.73
+20%
+3%
3
40
3.6
4
174
-
56
Regency Ihs Of Cityview Fort Worth Llc
$13.4M
$7.2M
53.6%
675622
Private / Semi-Private Rooms
Estates Healthcare & Rehab Center
HC

Home Care Professional care delivered in the person's own home — from companionship and errands to skilled nursing and therapy. Allows seniors to age in place. Medicare covers skilled home health when medically necessary.

NH

Nursing Home Licensed facility providing 24/7 skilled nursing care for residents with complex, ongoing medical needs. Staffed by RNs, LPNs, and CNAs. Inspected and star-rated annually by CMS. Accepts Medicare (short-term rehab) and Medicaid (long-term care).

RC

Respite Care Short-term temporary care — days to weeks — to give family caregivers a break. Full care provided during the stay. Often used after hospitalization or to trial a facility before a permanent placement decision.

Fort Worth (Hallmark-Camelot Highland Terrace)
143
47.2%
-26%
3.53
-8%
-3%
6
41
2.7
10
82
A+
51
Fort Worth V Enterprises Llc
$5.7M
$3.8M
67.2%
675028
Semi-Private Rooms

Places of interest near Cityview Nursing and Rehabilitation Center

Address 9.6 miles from city center

Calculate Travel Distance to Cityview Nursing and Rehabilitation Center

Add your location

Address

Staffing Data (Q2 2025)

This data corresponds to Q2 2025 and is based on CMS Payroll-Based Journal.

Total staff 188
Employees 182
Contractors 6
Staff to resident ratio 1.10:1
27% worse than Texas average

Texas average ratio: 1.51:1

Avg staff/day 78
Average shift 8.3 hours
0% compared with Texas average

Texas average: 8.1 hours

Total staff hours (quarter) 59,139
Nursing staff breakdown
Registered Nurse

Manages medical care and health needs.

Total count 17
Average shift length Info Average shift length. Calculated as total hours divided by days worked and average staff per day. 8.4 hours

No contractors work on this role.

Licensed Practical Nurse

Assists with medical care and medications.

Total count 43
Average shift length Info Average shift length. Calculated as total hours divided by days worked and average staff per day. 8.9 hours

No contractors work on this role.

Certified Nursing Assistant

Helps with daily care and mobility.

Total count 95
Average shift length Info Average shift length. Calculated as total hours divided by days worked and average staff per day. 8.1 hours

No contractors work on this role.

Contractor staffing

Total hours from contractors

1.3%

767 contractor hours this quarter

Occupational Therapy Aide: 3 Qualified Social Worker: 1 Medical Director: 1 Occupational Therapy Assistant: 1
Staff by category
Certified Nursing Assistant9509528,49191100%8.1
Licensed Practical Nurse4304313,94691100%8.9
Registered Nurse170175,78491100%8.4
RN Director of Nursing9094,04491100%8.9
Medication Aide/Technician6061,7528695%7.7
Other Dietary Services Staff4041,46191100%7.6
Mental Health Service Worker3031,0076673%7.9
Nurse Practitioner1015766571%8.9
Administrator1015536571%8.5
Dietitian1014686167%7.7
Qualified Social Worker0114355864%7.5
Clinical Nurse Specialist2022934752%6
Occupational Therapy Aide0332122527%7.8
Occupational Therapy Assistant01163910%7
Medical Director011571314%4.4
95 Certified Nursing Assistant
% of Days 100%
43 Licensed Practical Nurse
% of Days 100%
17 Registered Nurse
% of Days 100%
9 RN Director of Nursing
% of Days 100%
6 Medication Aide/Technician
% of Days 95%
4 Other Dietary Services Staff
% of Days 100%
3 Mental Health Service Worker
% of Days 73%
1 Nurse Practitioner
% of Days 71%
1 Administrator
% of Days 71%
1 Dietitian
% of Days 67%
1 Qualified Social Worker
% of Days 64%
2 Clinical Nurse Specialist
% of Days 52%
3 Occupational Therapy Aide
% of Days 27%
1 Occupational Therapy Assistant
% of Days 10%
1 Medical Director
% of Days 14%

Facility Characteristics

Source: CMS Long-Term Care Facility Characteristics (Data as of Jan 2026)

Total census
171 residents
Residents by payment source
Medicare
10 residents (5.8%)
Medicaid
152 residents (88.9%)
Private pay or other
9 residents (5.3%)
Programs & Services
Residents' Group

Residents meet regularly to discuss policies, care quality, and activities

Active Resident Council

Organized group of residents that meets regularly to discuss facility policies, quality of life, and activities.

Quality of care over time

These measures show how residents usually do over time at this home, based on health outcomes and preventive care.

High-risk clinical events score Info A composite score based on pressure ulcers, falls with injury, weight loss, walking ability decline, and activities of daily living decline. 5.9
31% better than Texas average

Texas average: 8.6

Functional decline score Info A composite score based on activities of daily living decline, walking ability decline, and incontinence. 12.6
22% better than Texas average

Texas average: 16.0

Long-stay resident measures
Significantly above average Texas avg: 4.2 Info CMS star rating based on long-stay quality measure performance. 5 stars = significantly above average, 1 star = significantly below average.
Need for Help with Daily Activities Increased Info Percent of long-stay residents whose need for help with daily activities has increased 9.4%
42% better than Texas average

Texas average: 16.2%

Walking Ability Worsened Info Percent of long-stay residents whose ability to move independently worsened 9.2%
43% better than Texas average

Texas average: 16.2%

Low Risk Residents with Bowel/Bladder Incontinence Info Percent of low risk long-stay residents who lose control of their bowels or bladder 19.1%
22% worse than Texas average

Texas average: 15.7%

Falls with Major Injury Info Percent of long-stay residents experiencing one or more falls with major injury 4.4%
37% worse than Texas average

Texas average: 3.2%

High Risk Residents with Pressure Ulcers Info Percent of long-stay high risk residents with pressure ulcers 1.5%
66% better than Texas average

Texas average: 4.4%

Urinary Tract Infection Info Percent of long-stay residents with a urinary tract infection 0.9%
16% worse than Texas average

Texas average: 0.8%

Lost Too Much Weight Info Percent of long-stay residents who lose too much weight 5.1%
48% worse than Texas average

Texas average: 3.5%

Depressive Symptoms Info Percent of long-stay residents who have depressive symptoms 3.1%
6% worse than Texas average

Texas average: 2.9%

Antipsychotic Use Info Percent of long-stay residents who received an antipsychotic medication 6.5%
18% better than Texas average

Texas average: 7.9%

Pneumococcal Vaccine Info Percent of long-stay residents assessed and appropriately given the pneumococcal vaccine 97.1%
In line with Texas average

Texas average: 97.3%

Influenza Vaccine Info Percent of long-stay residents assessed and appropriately given the seasonal influenza vaccine 91.5%
7% worse than Texas average

Texas average: 97.9%

Hospitalizations per 1,000 days Info Number of hospitalizations per 1,000 long-stay resident days. 1.02
52% better than Texas average

Texas average: 2.13

ED visits per 1,000 days Info Number of outpatient emergency department visits per 1,000 long-stay resident days. 0.68
67% better than Texas average

Texas average: 2.07

Short-stay resident measures
Above average Texas avg: 2.9 Info CMS star rating based on short-stay quality measure performance. 5 stars = much above average, 1 star = much below average.
Pneumococcal Vaccine Info Percent of short-stay residents assessed and appropriately given the pneumococcal vaccine 97.8%
8% better than Texas average

Texas average: 90.4%

Antipsychotic medication increase Info Percent of short-stay residents who newly received an antipsychotic medication 0.2%
86% better than Texas average

Texas average: 1.4%

Influenza Vaccine Info Percent of short-stay residents assessed and appropriately given the seasonal influenza vaccine 94.4%
7% better than Texas average

Texas average: 88.0%

Re-hospitalized after SNF stay Info Percentage of short-stay residents who were re-hospitalized after their nursing home admission. 17.7%
32% better than Texas average

Texas average: 25.9%

Emergency department visits Info Percentage of short-stay residents who had an outpatient emergency department visit. 11.2%
7% better than Texas average

Texas average: 12.0%

Falls with major injury Info Percentage of SNF residents who experience falls with major injury during their stay. 0.0%
100% better than Texas average

Texas average: 0.8%

Ability to care for self at discharge Info Percentage of residents at or above expected ability to care for themselves at discharge. 50.9%
5% worse than Texas average

Texas average: 53.7%

Successful return to home or community Info Rate of successful return to home or community from a skilled nursing facility. 55.6%
10% better than Texas average

Texas average: 50.6%

Penalties and fines

Federal penalties imposed by CMS for regulatory violations, including civil money penalties (fines) and denials of payment for new Medicare/Medicaid admissions.

Source: CMS Penalties Database (Data as of Jan 2026)

Total fines amount $328K
307% higher than Texas average

Texas average: $80K

Number of fines 3
21% more fines than Texas average

Texas average: 2.5

Payment Denials Info Serious action where Medicare and/or Medicaid temporarily stops payments for new residents until issues are fixed. 0
100% fewer payment denials than Texas average

Texas average: 0.2

Fines amount comparison
This facility $328K
Texas average $80K
Penalty History

Penalties are imposed by CMS for violations of federal nursing home regulations.

Civil Money Penalty Info Fines imposed for noncompliance, which can be assessed per day or per instance of violation. Jul 10, 2025
$267K
Civil Money Penalty Info Fines imposed for noncompliance, which can be assessed per day or per instance of violation. Jan 31, 2025
$12K
Civil Money Penalty Info Fines imposed for noncompliance, which can be assessed per day or per instance of violation. Sep 17, 2024
$48K

Last updated: Jan 2026

Guides for Better Senior Living

Care Cost Calculator: See Prices in Your Area

Nursing Home Data Explorer

Don’t Wait Too Long: 7 Red Flag Signs Your Parent Needs Assisted Living Now

The True Cost of Assisted Living in 2025 – And How Families Are Paying For It

Understanding Senior Living Costs: Pricing Models, Discounts & Financial Assistance

Financial Aid for Texas Seniors

Get financial aid guidance

Community Care for the Aged and Disabled (CCAD)

TX Medicaid CCAD

Age 65+ or disabled, Texas resident, Medicaid-eligible, care need (not always nursing home level).

~$2,829/month (300% FBR, individual).

$2,000 (individual), $3,000 (couple).

Large state; rural access challenges.

Texas Community Care Services

TX CCS

Age 60+, Texas resident, at risk of decline.

~$2,000/month (individual, varies).

$5,000 (individual).

Limited funding; high demand in urban areas.

Area Agency on Aging (AAA) Services

Texas AAA Services

Age 60+, TX resident; no income/asset limits.

None; donations encouraged.

Not assessed.

28 AAAs; includes Meals on Wheels in some areas.

Medicare Savings Program (MSP)

Texas Medicare Savings Program

Age 65+ or disabled, TX resident, Medicare Part A/B.

~$2,510/month (QMB), ~$3,380/month (SLMB), ~$3,598/month (QI)—individual.

$9,430 (individual), $14,130 (couple).

Includes Extra Help for Part D; no waitlist.

Low-Income Home Energy Assistance Program (LIHEAP)

Texas Comprehensive Energy Assistance Program (CEAP)

Age 60+ prioritized, TX resident, low-income.

~$3,970/month (185% FPL).

Not assessed.

Priority for elderly/disabled; covers gas, electric, propane.

Family Caregiver Support Program (FCSP)

Texas Family Caregiver Support Program

Caregivers of 60+ needing care or 55+ caregivers of others; TX resident; 2+ ADLs.

No strict cap; prioritizes low-income (~$24,980/year).

Not assessed.

High rural demand; includes grandparent caregivers.

Senior Community Service Employment Program (SCSEP)

Texas SCSEP

Age 55+, unemployed, low-income, TX resident.

~$1,983/month (125% FPL).

Not specified.

Priority for veterans, rural residents; AARP partnership.

VA Aid and Attendance (A&A) and Housebound Benefits

Texas VA Aid and Attendance/Housebound

Age 65+ or disabled veteran/spouse, TX resident, wartime service, ADL help (A&A) or homebound.

Net income < ~$1,984/month (veteran with dependent, A&A); pension offsets income.

~$155,356 (net worth).

High veteran population; supports rural/urban needs.

Property Tax Exemption for Seniors

Texas Senior Property Tax Exemption

Age 65+, TX resident, homeowner (homestead).

None; tax-based eligibility.

Not assessed.

$25,000+ exemption; optional freeze in some counties; saves ~$500-$1,000/year.

Senior Farmers’ Market Nutrition Program (SFMNP)

Texas SFMNP

Age 60+, TX resident, low-income.

~$2,322/month (185% FPL).

Not assessed.

Vouchers (~$50/season); serves ~20,000 via 28 AAAs.