


Total health inspections
7
Colorado average 4.8
Last Health inspection on Sep 2025
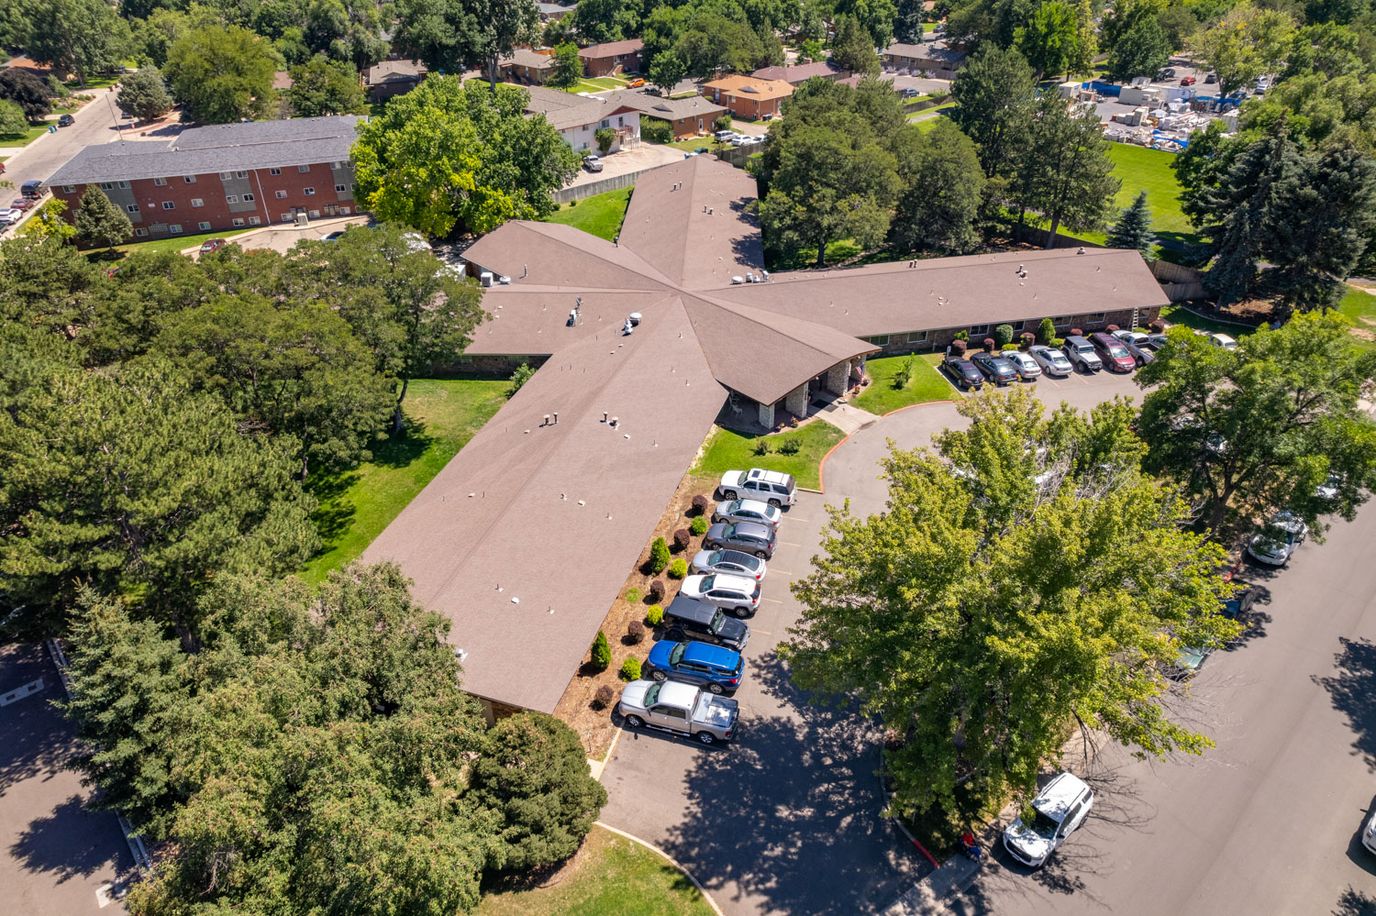
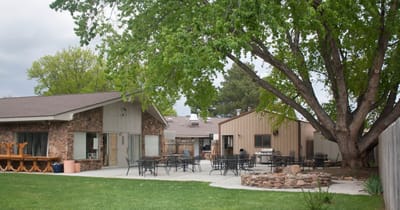
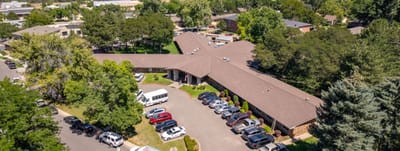
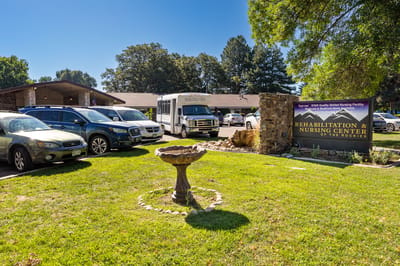
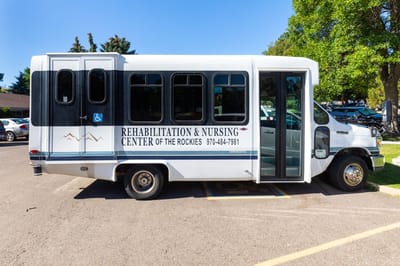
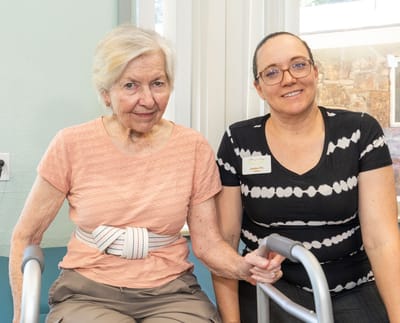
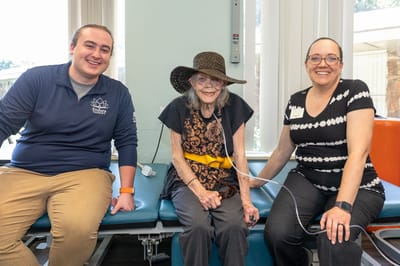
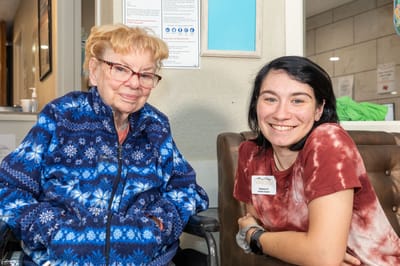
Rehabilitation and Nursing Center of the Rockies has been one of the trusted nursing homes in Fort Collins. Focusing on short-term rehabilitation and long-term care, residents and families can expect only the upscale professional and compassionate service they seek. The nursing home provides motivation and cultivation for a fulfilling life.
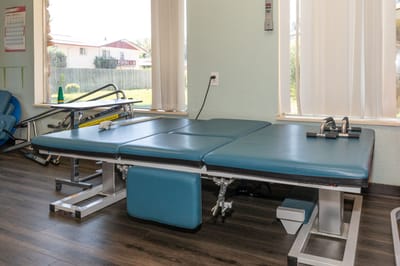
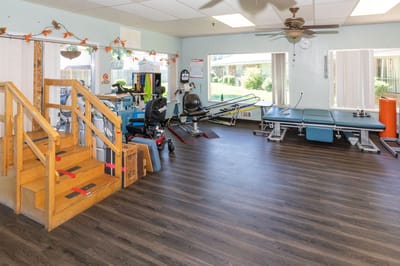
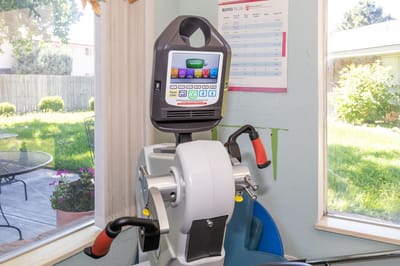
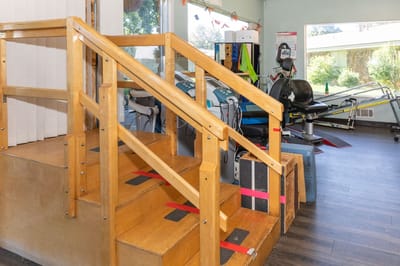
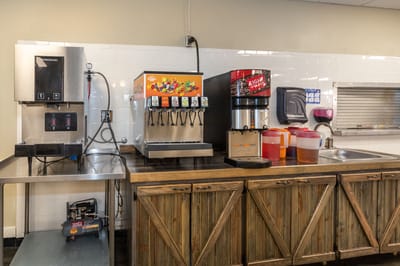
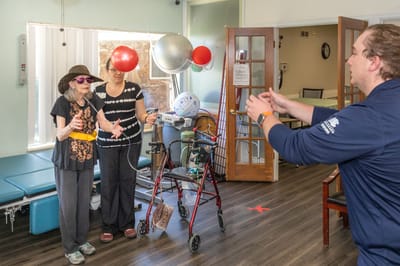
The beautiful community has amenities residents can take advantage of common areas, lounges, a library, restaurant-style dining, and a fitness center. Personalized care for specialty services is provided, such as housekeeping, 24/7 care staff, stimulating programs, and scheduled activities offered.
| Staff type | Hours / Day / Resident | vs state avg |
|---|---|---|
|
Registered Nurse (RN)
| 30m per day | ▼ 41% State avg: 50m per day · National avg: 41m per day |
|
LPN / LVN
| 35m per day | ▼ 14% State avg: 41m per day · National avg: 52m per day |
|
Nurse Aide
| 2h 15m per day | ■ Avg State avg: 2h 13m per day · National avg: 2h 21m per day |
|
Weekend Total Nursing
| 2h 45m per day | ▼ 16% State avg: 3h 17m per day · National avg: 3h 26m per day |
|
Physical Therapist
| 11m per day | ▲ 116% State avg: 5m per day · National avg: 4m per day |
|
Weekend RN
| 17m per day | ▼ 53% State avg: 36m per day · National avg: 29m per day |
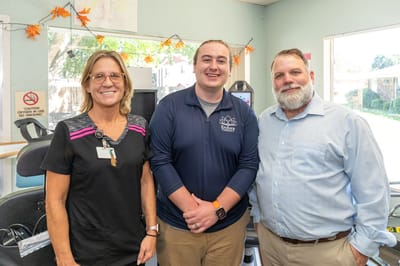
Rehabilitation and Nursing Center of the Rockies is administered by Todd Truax.
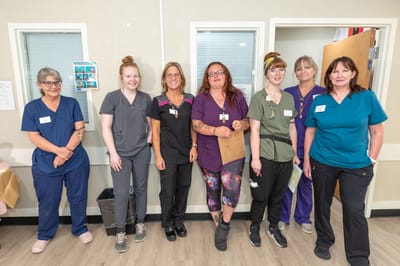
Key information about the people who lead and staff this community.
In Colorado, the Department of Public Health and Environment, Health Facilities Division is the regulatory body that performs unannounced surveys and publishes facility inspection findings.
Deficiencies
| This Facility | CO Average | vs. CO Avg |
|---|---|---|---|
|
Total deficiencies
| 45 | 38 | This facility has 18% more total deficiencies than a typical Colorado nursing home (45 vs. CO avg 38).↑ 18% worse |
|
Deficiencies per year
| 6.4 | 5.4 | This facility has 19% more deficiencies per year than a typical Colorado nursing home (6.4 vs. CO avg 5.4).↑ 19% worse |
Colorado average 4.8
Last Health inspection on Sep 2025
Colorado average 24.8
Colorado average 5.2
Health citations are formal notices following inspections when they fail to comply with safety and care standards.
15 of 22 citations resulted from standard inspections; and 7 of 22 resulted from complaint investigations.
Colorado average: 0.4
Colorado average: 2.1
Reporting period: October 1 – December 31, 2025 (Q4 2025). Source: CMS Payroll-Based Journal report.
Manages medical care and health needs.
Assists with medical care and medications.
Helps with daily care and mobility.
Total hours from contractors
155 contractor hours this quarter
| Certified Nursing Assistant | 45 | 16 | 61 | 15,884 | 92 | 100% | 8.5 |
| Licensed Practical Nurse | 10 | 1 | 11 | 3,865 | 92 | 100% | 8.9 |
| Registered Nurse | 6 | 0 | 6 | 2,659 | 92 | 100% | 10.8 |
| Dental Services Staff | 5 | 0 | 5 | 1,946 | 67 | 73% | 7.6 |
| Respiratory Therapy Technician | 4 | 0 | 4 | 1,424 | 77 | 84% | 7.6 |
| Other Dietary Services Staff | 6 | 0 | 6 | 1,346 | 85 | 92% | 7.2 |
| Physical Therapy Assistant | 6 | 0 | 6 | 1,312 | 80 | 87% | 7.6 |
| Nurse Aide in Training | 6 | 0 | 6 | 1,155 | 77 | 84% | 8.2 |
| Medication Aide/Technician | 3 | 0 | 3 | 822 | 68 | 74% | 8.1 |
| RN Director of Nursing | 1 | 0 | 1 | 786 | 73 | 79% | 10.8 |
| Clinical Nurse Specialist | 4 | 0 | 4 | 664 | 66 | 72% | 8.7 |
| Qualified Social Worker | 4 | 0 | 4 | 598 | 58 | 63% | 7.6 |
| Nurse Practitioner | 1 | 0 | 1 | 594 | 66 | 72% | 9 |
| Administrator | 1 | 0 | 1 | 528 | 66 | 72% | 8 |
| Dietitian | 1 | 0 | 1 | 504 | 63 | 68% | 8 |
| Occupational Therapy Assistant | 1 | 0 | 1 | 498 | 66 | 72% | 7.5 |
| Speech Language Pathologist | 2 | 0 | 2 | 473 | 52 | 57% | 8.8 |
| Physical Therapy Aide | 1 | 0 | 1 | 374 | 48 | 52% | 7.8 |
| Occupational Therapy Aide | 2 | 0 | 2 | 297 | 59 | 64% | 5 |
Includes penalties issued in 2025
Federal penalties imposed by CMS for regulatory violations, including civil money penalties (fines) and denials of payment for new Medicare/Medicaid admissions.
Source: CMS Penalties Database (Data as of Jan 2026)
Colorado average: $40K
Colorado average: 2.2
Colorado average: 0.3
Penalties are imposed by CMS for violations of federal nursing home regulations.
1 penalty in the past 3 years
Jun 26, 2025 · $33K
Last updated: Jan 2026
These measures show how residents usually do over time at this home, based on health outcomes and preventive care.
Colorado average: 9.0
Colorado average: 18.8
Colorado average: 16.0%
Colorado average: 17.0%
Colorado average: 23.2%
Colorado average: 3.3%
Colorado average: 3.9%
Colorado average: 1.4%
Colorado average: 5.2%
Colorado average: 7.2%
Colorado average: 18.8%
Colorado average: 93.3%
Colorado average: 94.7%
Colorado average: 1.30
Colorado average: 1.67
Colorado average: 76.6%
Colorado average: 1.4%
Colorado average: 75.6%
Colorado average: 20.3%
Colorado average: 12.8%
Colorado average: 0.8%
Colorado average: 53.7%
Colorado average: 50.6%
Quality measures are calculated from Minimum Data Set (MDS) assessments. For most measures, lower percentages indicate better care quality.
40% of new residents, usually for short-term rehab.
47% of new residents, often for short stays.
13% of new residents, often for long-term daily care.
Source: CMS Long-Term Care Facility Characteristics (Data as of Jan 2026)
Residents meet regularly to discuss policies, care quality, and activities
Family members meet regularly to discuss policies, care quality, and activities
State-approved Nurse Aide Training and Competency Evaluation Program on-site
Organized group of family members that meets regularly to discuss facility policies, resident care, and activities.
Organized group of residents that meets regularly to discuss facility policies, quality of life, and activities.
Data sourced from CMS Long-Term Care Facility Characteristics quarterly report. Payer mix reflects the current resident census by primary payment source.
Historical financial and operational data for Rehabilitation and Nursing Center of the Rockies from 2011–2022, based on CMS SNF Cost Reports.
Key figures below are for fiscal year ending in 07/2022 — the home's most recent complete cost report, an older period than most facilities report.
Based on the home's most recent complete CMS SNF Cost Report — fiscal year ending in 07/2022. This is an older period than most facilities report, so compare with that in mind.
This home supports both short-term rehab and long-term care, with residents staying for a wide range of durations.
New residents most often arrive under private pay (47% of admissions), and a typical private pay stay runs around 2 - 3 months.
Coverage residents most often arrive under.
Coverage residents most often leave under.
![]() 1.8 miles from city center
1.8 miles from city center
![]() Estimated distance in miles from Fort Collins's city center to Rehabilitation and Nursing Center of the Rockies's address, calculated via Google Maps.
— 0.18 miles to nearest hospital (UCHealth Poudre Valley Hospital)
Estimated distance in miles from Fort Collins's city center to Rehabilitation and Nursing Center of the Rockies's address, calculated via Google Maps.
— 0.18 miles to nearest hospital (UCHealth Poudre Valley Hospital)
Add your location
The information below is reported by the Colorado Department of Public Health and Environment, Health Facilities Division.
| Lemy Avenue Health and Rehab Facility | NH | Fort Collins (South Lemay Avenue) | 130
Facility
130
CO AVG
76
Rank
#64 / 527 |
94.5%
Facility
94.5%
CO AVG
70.7
Rank
#14 / 149 | +34% | 4.72
Facility
4.72
CO AVG
3.86
Rank
#27 / 211 | -3% | +22% | $7.4k
Facility
$7.4k
CO AVG
$39.2k
Rank
#91 / 217 | 7
Facility
7
CO AVG
24.8
Rank
#12 / 212 | 1.4
Facility
1.4
CO AVG
5.2
Rank
#1 / 212 | 1 | 123 | A+ |
48
Facility
48
CO AVG
51
Rank
#506 / 869 | - | $18.4MFiscal year ending 12/2023
Facility
$18.4MFiscal year ending 12/2023
CO AVG
$11.2M
Rank
#28 / 217 | $9.8MFiscal year ending 12/2023
Facility
$9.8MFiscal year ending 12/2023
CO AVG
$4.9M
Rank
#9 / 217 | 53.1%Fiscal year ending 12/2023
Facility
53.1%Fiscal year ending 12/2023
CO AVG
46.6%
Rank
#77 / 217 | 65142 | ||||
| Centre Avenue Health and Rehab Facility | NH | Fort Collins (Centre Avenue) | 90
Facility
90
CO AVG
76
Rank
#195 / 527 |
35.6%
Facility
35.6%
CO AVG
70.7
Rank
#133 / 149 | -50% | 4.33
Facility
4.33
CO AVG
3.86
Rank
#44 / 211 | +16% | +12% | $0
Facility
$0
CO AVG
$39.2k
Rank
#1 / 217 | 5
Facility
5
CO AVG
24.8
Rank
#4 / 212 | 2.5
Facility
2.5
CO AVG
5.2
Rank
#20 / 212 | 2 | 32 | A+ |
73
Facility
73
CO AVG
51
Rank
#180 / 869 | - | $13.6MFiscal year ending 12/2023
Facility
$13.6MFiscal year ending 12/2023
CO AVG
$11.2M
Rank
#45 / 217 | $7.7MFiscal year ending 12/2023
Facility
$7.7MFiscal year ending 12/2023
CO AVG
$4.9M
Rank
#25 / 217 | 56.6%Fiscal year ending 12/2023
Facility
56.6%Fiscal year ending 12/2023
CO AVG
46.6%
Rank
#63 / 217 | 65377 | ||||
| Columbine West Health and Rehab Facility | NH | Fort Collins (Prospect/Shields) | 100
Facility
100
CO AVG
76
Rank
#158 / 527 | - | - | 5.25
Facility
5.25
CO AVG
3.86
Rank
#17 / 211 | -13% | +36% | $26.9k
Facility
$26.9k
CO AVG
$39.2k
Rank
#149 / 217 | 17
Facility
17
CO AVG
24.8
Rank
#63 / 212 | 3.4
Facility
3.4
CO AVG
5.2
Rank
#49 / 212 | 2 | 14 | A+ |
72
Facility
72
CO AVG
51
Rank
#192 / 869 | - | $11.6MFiscal year ending 12/2023
Facility
$11.6MFiscal year ending 12/2023
CO AVG
$11.2M
Rank
#89 / 217 | $7.6MFiscal year ending 12/2023
Facility
$7.6MFiscal year ending 12/2023
CO AVG
$4.9M
Rank
#54 / 217 | 65.3%Fiscal year ending 12/2023
Facility
65.3%Fiscal year ending 12/2023
CO AVG
46.6%
Rank
#22 / 217 | 65245 | ||||
| Rehabilitation and Nursing Center of the Rockies | NH MC SNF | Fort Collins | 106
Facility
106
CO AVG
76
Rank
#131 / 527 | - | - | 3.00
Facility
3.00
CO AVG
3.86
Rank
#175 / 211 | -66% | -22% | $21.3k
Facility
$21.3k
CO AVG
$39.2k
Rank
#136 / 217 | 22
Facility
22
CO AVG
24.8
Rank
#95 / 212 | 3.1
Facility
3.1
CO AVG
5.2
Rank
#40 / 212 | 2 | 13 | A+ |
53
Facility
53
CO AVG
51
Rank
#444 / 869 | Todd Truax | $7.8M*Fiscal year ending 07/2022These figures are from this home's most recent complete cost report — an older period than most facilities report. Compare with that in mind.
Facility
$7.8M*Fiscal year ending 07/2022These figures are from this home's most recent complete cost report — an older period than most facilities report. Compare with that in mind.
CO AVG
$11.2M
Rank
#30 / 217 | $3.9M*Fiscal year ending 07/2022These figures are from this home's most recent complete cost report — an older period than most facilities report. Compare with that in mind.
Facility
$3.9M*Fiscal year ending 07/2022These figures are from this home's most recent complete cost report — an older period than most facilities report. Compare with that in mind.
CO AVG
$4.9M
Rank
#127 / 217 | 50.6%*Fiscal year ending 07/2022These figures are from this home's most recent complete cost report — an older period than most facilities report. Compare with that in mind.
Facility
50.6%*Fiscal year ending 07/2022These figures are from this home's most recent complete cost report — an older period than most facilities report. Compare with that in mind.
CO AVG
46.6%
Rank
#208 / 217 | 65192 | ||||
| Creekside Village Health and Rehabilitation Center | NH AL | Fort Collins (Prospect At Spring Meadows) | 120
Facility
120
CO AVG
76
Rank
#77 / 527 |
63.3%
Facility
63.3%
CO AVG
70.7
Rank
#104 / 149 | -10% | 2.63
Facility
2.63
CO AVG
3.86
Rank
#201 / 211 | +10% | -32% | $48.9k
Facility
$48.9k
CO AVG
$39.2k
Rank
#184 / 217 | 40
Facility
40
CO AVG
24.8
Rank
#181 / 212 | 3.3
Facility
3.3
CO AVG
5.2
Rank
#44 / 212 | 6 | 76 | - |
73
Facility
73
CO AVG
51
Rank
#180 / 869 | - | $8.9MFiscal year ending 12/2023
Facility
$8.9MFiscal year ending 12/2023
CO AVG
$11.2M
Rank
#123 / 217 | $2.5MFiscal year ending 12/2023
Facility
$2.5MFiscal year ending 12/2023
CO AVG
$4.9M
Rank
#65 / 217 | 28.4%Fiscal year ending 12/2023
Facility
28.4%Fiscal year ending 12/2023
CO AVG
46.6%
Rank
#16 / 217 | 65221 |
Rehabilitation and Nursing Center of the Rockies is located in Fort Collins, Colorado.
Here are the financial assistance programs available to residents in Colorado.
Rehabilitation and Nursing Center of the Rockies is legally operated by Castle Pines Healthcare LLC, and administered by Todd Truax.
Rehabilitation and Nursing Center of the Rockies has a walk score of 53. Moderately walkable. Some errands can be accomplished on foot, with a mix of nearby amenities.
Rehabilitation and Nursing Center of the Rockies's occupancy is 67.3%.
No, Rehabilitation and Nursing Center of the Rockies has a no-pet policy.
Rehabilitation and Nursing Center of the Rockies is registered as a for-profit in CO.
Todd Truax is the administrator of Rehabilitation and Nursing Center of the Rockies.
Rehabilitation and Nursing Center of the Rockies has 106 beds.
Care Cost Calculator: See Prices in Your Area
Nursing Home Data Explorer
Don’t Wait Too Long: 7 Red Flag Signs Your Parent Needs Assisted Living Now
The True Cost of Assisted Living in 2025 – And How Families Are Paying For It
Understanding Senior Living Costs: Pricing Models, Discounts & Financial Assistance


