


Total staff
123
Employees
117
Contractors
6
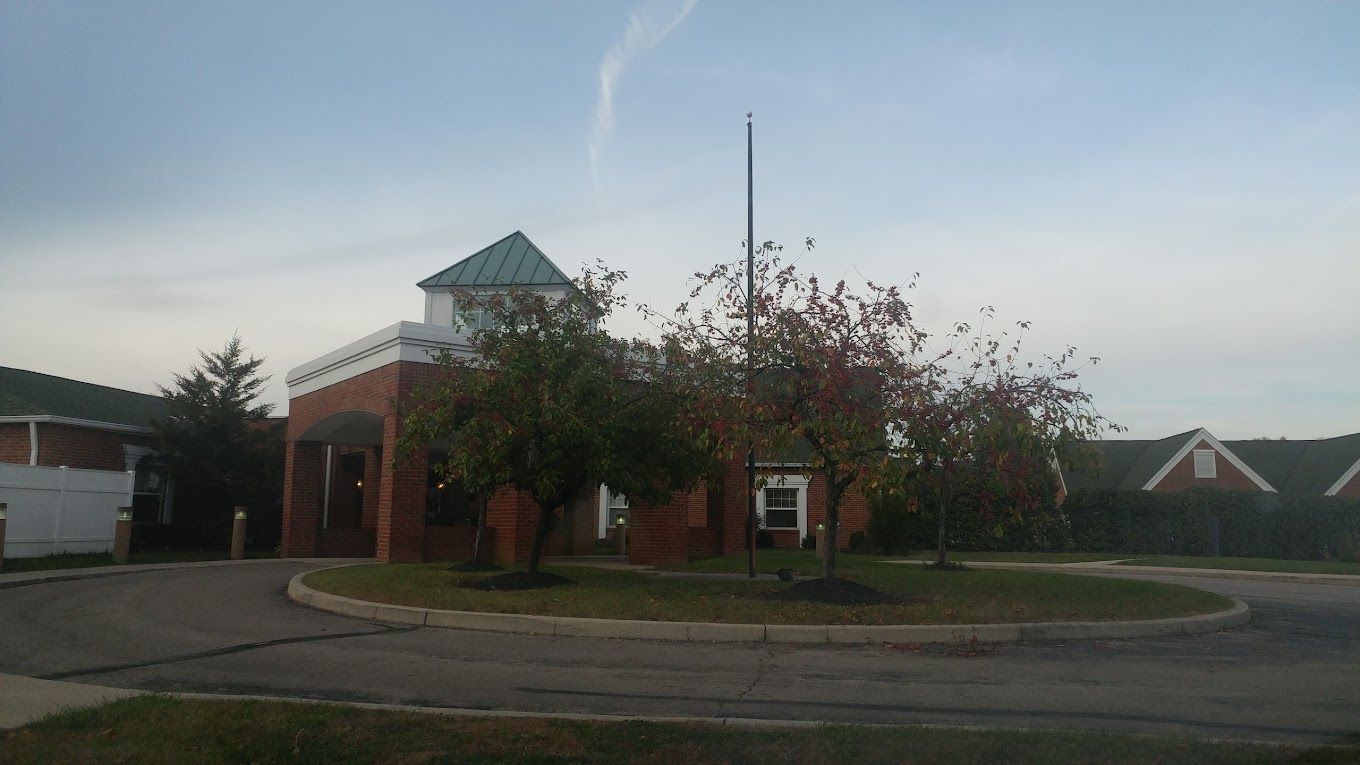
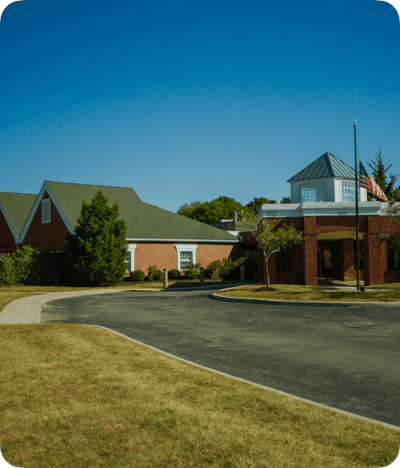
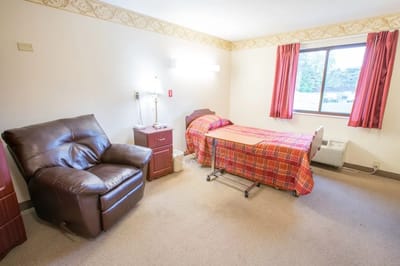
Columbus Alzheimer Care Center in the Olentangy Commons neighborhood is a 99-bed, one-story building at 700 Jasonway Ave that’s really dialed in on memory care, along with hospice, palliative, and respite care. They’re open 24/7, and they’re only about two miles from OhioHealth Riverside Methodist Hospital. Just a heads up if you visit: the neighborhood has a Walk Score of 45, so while you can walk to grab a few things, you’ll mostly want a car.
The stats here tell a pretty clear story: with 98.6% occupancy and an average stay of 132 days, this isn’t the kind of place you go for a quick rehab stint. This is designed to be a long-term home for people dealing with Alzheimer’s or other forms of dementia. Everything from the secure outdoor courtyards to the activities they plan is built around that specific lifestyle.
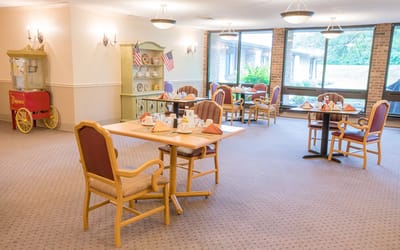
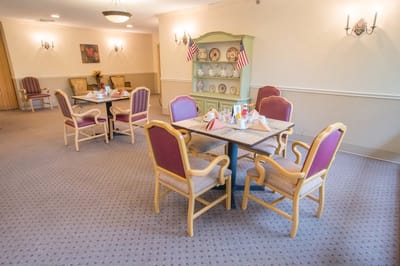
Day-to-day care is a big focus. Residents get about 3 hours and 3 minutes of nursing attention daily, which is split up between nurse aides, RNs, and LPN/LVNs. They do offer short-term rehab services too, and there’s always someone on staff. You can choose between private or semi-private rooms, and they have perks like a hair salon and those secure courtyards I mentioned. They also make sure meals are chef-prepared with a focus on balanced nutrition.
They take Medicare, Medicaid, and private pay. If you’re a family trying to figure out the right long-term move for a loved one with Alzheimer’s or dementia in the Columbus area, this place is worth a look because they’ve really centered everything they do around the people living there.
Staffing hours
![]() Daily nursing hours per resident by staff type, reported to CMS. Higher is generally better — compare this facility to state and national averages to see where staffing stands.
Daily nursing hours per resident by staff type, reported to CMS. Higher is generally better — compare this facility to state and national averages to see where staffing stands.
Hours per resident per day vs Ohio averages
Total nursing care
![]() This home is ranked 138th out of 177 homes in Ohio for nurse hours. Total adjusted nursing hours per resident per day, combining RN, LPN, and aide time. CMS adjusts this for case-mix so facilities can be fairly compared.
This home is ranked 138th out of 177 homes in Ohio for nurse hours. Total adjusted nursing hours per resident per day, combining RN, LPN, and aide time. CMS adjusts this for case-mix so facilities can be fairly compared.
3h 3m
14% below state avg3 of 6 metrics below state avg
Reporting period: October 1 – December 31, 2025 (Q4 2025). Source: CMS Payroll-Based Journal report.
Manages medical care and health needs.
Assists with medical care and medications.
Helps with daily care and mobility.
Total hours from contractors
143 contractor hours this quarter
| Certified Nursing Assistant | 46 | 0 | 46 | 17,050 | 92 | 100% | 8.7 |
| Licensed Practical Nurse | 13 | 0 | 13 | 4,478 | 92 | 100% | 8.8 |
| Registered Nurse | 14 | 0 | 14 | 3,791 | 92 | 100% | 9.1 |
| Medication Aide/Technician | 6 | 0 | 6 | 2,334 | 92 | 100% | 8.9 |
| Other Dietary Services Staff | 10 | 0 | 10 | 2,007 | 92 | 100% | 6.5 |
| Physical Therapy Aide | 3 | 0 | 3 | 1,169 | 67 | 73% | 7 |
| Clinical Nurse Specialist | 4 | 0 | 4 | 961 | 64 | 70% | 8 |
| Respiratory Therapy Technician | 3 | 0 | 3 | 743 | 67 | 73% | 5.9 |
| Speech Language Pathologist | 4 | 0 | 4 | 591 | 62 | 67% | 6 |
| Nurse Practitioner | 1 | 0 | 1 | 512 | 64 | 70% | 8 |
| Administrator | 1 | 0 | 1 | 488 | 61 | 66% | 8 |
| RN Director of Nursing | 2 | 0 | 2 | 359 | 44 | 48% | 8.2 |
| Qualified Social Worker | 3 | 0 | 3 | 346 | 64 | 70% | 5.4 |
| Dental Services Staff | 1 | 0 | 1 | 320 | 40 | 43% | 8 |
| Physical Therapy Assistant | 4 | 0 | 4 | 186 | 52 | 57% | 3.4 |
| Occupational Therapy Aide | 0 | 4 | 4 | 94 | 26 | 28% | 3.6 |
| Dietitian | 1 | 0 | 1 | 32 | 4 | 4% | 8 |
| Occupational Therapy Assistant | 0 | 1 | 1 | 26 | 3 | 3% | 8.7 |
| Medical Director | 0 | 1 | 1 | 24 | 12 | 13% | 2 |
| Nurse Aide in Training | 1 | 0 | 1 | 8 | 1 | 1% | 7.8 |
Includes penalties issued in 2025
Federal penalties imposed by CMS for regulatory violations, including civil money penalties (fines) and denials of payment for new Medicare/Medicaid admissions.
Source: CMS Penalties Database (Data as of Jan 2026)
Ohio average: $69K
Ohio average: 1.9
Ohio average: 0.5
Penalties are imposed by CMS for violations of federal nursing home regulations.
2 penalties in the past 3 years
Multiple penalties were reported in the last 3 years.
Last updated: Jan 2026
These measures show how residents usually do over time at this home, based on health outcomes and preventive care.
Ohio average: 5.8
Ohio average: 12.7
Ohio average: 6.8%
Ohio average: 8.9%
Ohio average: 22.0%
Ohio average: 3.4%
Ohio average: 3.9%
Ohio average: 0.5%
Ohio average: 6.2%
Ohio average: 24.0%
Ohio average: 8.4%
Ohio average: 92.4%
Ohio average: 94.5%
Ohio average: 1.77
Ohio average: 1.83
Ohio average: 78.0%
Ohio average: 75.6%
Quality measures are calculated from Minimum Data Set (MDS) assessments. For most measures, lower percentages indicate better care quality.
2% of new residents, usually for short-term rehab.
87% of new residents, often for short stays.
10% of new residents, often for long-term daily care.
Source: CMS Long-Term Care Facility Characteristics (Data as of Jan 2026)
Residents meet regularly to discuss policies, care quality, and activities
Organized group of residents that meets regularly to discuss facility policies, quality of life, and activities.
Data sourced from CMS Long-Term Care Facility Characteristics quarterly report. Payer mix reflects the current resident census by primary payment source.
Historical financial and operational data for Columbus Alzheimer Care Center from 2011–2023, based on CMS SNF Cost Reports.
Key figures below are for fiscal year ending in 12/2023.
Based on CMS SNF Cost Report for fiscal year ending in 12/2023.
No pets allowed
Building Type: Single-story
Most residents stay long-term, while a smaller portion are admitted for short-term rehab.
Most new residents arrive under private pay (87% of admissions), and a typical private pay stay runs around 4 months.
Coverage residents most often arrive under.
Coverage residents most often leave under.
![]() 6.8 miles from city center
6.8 miles from city center
![]() Estimated distance in miles from Columbus's city center to Columbus Alzheimer Care Center's address, calculated via Google Maps.
— 1.81 miles to nearest hospital (OhioHealth Riverside Methodist Hospital and Emergency Department)
Estimated distance in miles from Columbus's city center to Columbus Alzheimer Care Center's address, calculated via Google Maps.
— 1.81 miles to nearest hospital (OhioHealth Riverside Methodist Hospital and Emergency Department)
Add your location
Info below is compiled from CMS reports & the OH Dept. of Health, senior community websites & trusted data sources such as Walk Score & BBB.
Communities are listed from highest to lowest based on our ranking methodology.
| Westerwood | NH AL IL MC RC SNF | Columbus (Northland) | 75
Facility
75
OH AVG
75
Rank
#149 / 306 |
83.1%
Facility
83.1%
OH AVG
81.7
Rank
#82 / 135 | +2% | 4.39
Facility
4.39
OH AVG
3.54
Rank
#21 / 177 | +26% | +24% | $0
Facility
$0
OH AVG
$74.0k
Rank
#1 / 178 | 16
Facility
16
OH AVG
30.9
Rank
#40 / 178 | 2.3
Facility
2.3
OH AVG
4.6
Rank
#15 / 178 | - | 62 | - |
26
Facility
26
OH AVG
42
Rank
#489 / 673 | United Church Homes Management, Inc | $8.5MFiscal year ending 06/2024
Facility
$8.5MFiscal year ending 06/2024
OH AVG
$9.6M
Rank
#95 / 172 | $5.7MFiscal year ending 06/2024
Facility
$5.7MFiscal year ending 06/2024
OH AVG
$5.2M
Rank
#55 / 172 | 66.8%Fiscal year ending 06/2024
Facility
66.8%Fiscal year ending 06/2024
OH AVG
55.7%
Rank
#24 / 172 | 365399 | ||||
| Worthington Christian Village | NH AL IL SNF | Columbus (Olentangy High Bluffs) | 40
Facility
40
OH AVG
75
Rank
#247 / 306 |
80.0%
Facility
80.0%
OH AVG
81.7
Rank
#92 / 135 | -2% | 5.68
Facility
5.68
OH AVG
3.54
Rank
#5 / 177 | +29% | +60% | $0
Facility
$0
OH AVG
$74.0k
Rank
#1 / 178 | 11
Facility
11
OH AVG
30.9
Rank
#24 / 178 | 5.5
Facility
5.5
OH AVG
4.6
Rank
#138 / 178 | - | 32 | A+ |
30
Facility
30
OH AVG
42
Rank
#446 / 673 | Lynn Borton | $3.8MFiscal year ending 12/2023
Facility
$3.8MFiscal year ending 12/2023
OH AVG
$9.6M
Rank
#162 / 172 | $2.7MFiscal year ending 12/2023
Facility
$2.7MFiscal year ending 12/2023
OH AVG
$5.2M
Rank
#150 / 172 | 70.5%Fiscal year ending 12/2023
Facility
70.5%Fiscal year ending 12/2023
OH AVG
55.7%
Rank
#11 / 172 | 365671 | ||||
| Ohio Living Westminster – Thurber | NH AL IL MC SNF | Columbus (Harrison West) | 73
Facility
73
OH AVG
75
Rank
#153 / 306 |
39.7%
Facility
39.7%
OH AVG
81.7
Rank
#131 / 135 | -51% | 5.17
Facility
5.17
OH AVG
3.54
Rank
#9 / 177 | +14% | +46% | $14.7k
Facility
$14.7k
OH AVG
$74.0k
Rank
#137 / 178 | 22
Facility
22
OH AVG
30.9
Rank
#64 / 178 | 3.7
Facility
3.7
OH AVG
4.6
Rank
#69 / 178 | 2 | 29 | A+ |
71
Facility
71
OH AVG
42
Rank
#62 / 673 | Sydney Mcbride | $4.5MFiscal year ending 06/2024
Facility
$4.5MFiscal year ending 06/2024
OH AVG
$9.6M
Rank
#153 / 172 | $2.9MFiscal year ending 06/2024
Facility
$2.9MFiscal year ending 06/2024
OH AVG
$5.2M
Rank
#147 / 172 | 65.1%Fiscal year ending 06/2024
Facility
65.1%Fiscal year ending 06/2024
OH AVG
55.7%
Rank
#31 / 172 | 365416 | ||||
| Wesley Glen Retirement Community | NH AL HOS IL MC SNF | Columbus (Sharon Heights) | 29
Facility
29
OH AVG
75
Rank
#277 / 306 | - | - | 5.54
Facility
5.54
OH AVG
3.54
Rank
#6 / 177 | -26% | +57% | $0
Facility
$0
OH AVG
$74.0k
Rank
#1 / 178 | 30
Facility
30
OH AVG
30.9
Rank
#93 / 178 | 6.0
Facility
6.0
OH AVG
4.6
Rank
#151 / 178 | 1 | 51 | - |
81
Facility
81
OH AVG
42
Rank
#22 / 673 | Celia Conlon | $6.5MFiscal year ending 12/2023
Facility
$6.5MFiscal year ending 12/2023
OH AVG
$9.6M
Rank
#132 / 172 | $5.1MFiscal year ending 12/2023
Facility
$5.1MFiscal year ending 12/2023
OH AVG
$5.2M
Rank
#76 / 172 | 78.2%Fiscal year ending 12/2023
Facility
78.2%Fiscal year ending 12/2023
OH AVG
55.7%
Rank
#5 / 172 | 365504 | ||||
| Columbus Alzheimer Care Center | NH HOS MC PC RC SNF | Columbus (Olentangy Commons) | 99
Facility
99
OH AVG
75
Rank
#69 / 306 |
98.7%
Facility
98.7%
OH AVG
81.7
Rank
#2 / 135 | +21% | 3.05
Facility
3.05
OH AVG
3.54
Rank
#138 / 177 | +24% | -14% | $26.7k
Facility
$26.7k
OH AVG
$74.0k
Rank
#146 / 178 | 35
Facility
35
OH AVG
30.9
Rank
#111 / 178 | 5.8
Facility
5.8
OH AVG
4.6
Rank
#147 / 178 | 2 | 98 | - |
45
Facility
45
OH AVG
42
Rank
#310 / 673 | - | $9.4MFiscal year ending 12/2023
Facility
$9.4MFiscal year ending 12/2023
OH AVG
$9.6M
Rank
#79 / 172 | $4.8MFiscal year ending 12/2023
Facility
$4.8MFiscal year ending 12/2023
OH AVG
$5.2M
Rank
#94 / 172 | 50.5%Fiscal year ending 12/2023
Facility
50.5%Fiscal year ending 12/2023
OH AVG
55.7%
Rank
#110 / 172 | 365839 |
Columbus Alzheimer Care Center is located in Columbus, Ohio.
Here are the financial assistance programs available to residents in Ohio.
Columbus Alzheimer Care Center is in the Olentangy Commons neighborhood.
Columbus Alzheimer Care Center has a walk score of 45. Somewhat walkable. A few nearby services may be reachable on foot, but most trips require transportation.
Columbus Alzheimer Care Center's occupancy is 98.6%.
No, Columbus Alzheimer Care Center has a no-pet policy.
Columbus Alzheimer Care Center is registered as a for-profit.
Yes — there are 5 photos of Columbus Alzheimer Care Center in the photo gallery on this page.
Columbus Alzheimer Care Center is located at 700 Jasonway Ave, Columbus, OH 43214.
Care Cost Calculator: See Prices in Your Area
Nursing Home Data Explorer
Don’t Wait Too Long: 7 Red Flag Signs Your Parent Needs Assisted Living Now
The True Cost of Assisted Living in 2025 – And How Families Are Paying For It
Understanding Senior Living Costs: Pricing Models, Discounts & Financial Assistance


