Total health inspections
5
Virginia average 4.2
Last Health inspection on Jul 2024

We arrange tours, appointments, and even moving support so you don’t have to
Thank you for your interest!
Our team will be in touch shortly to help with next steps.

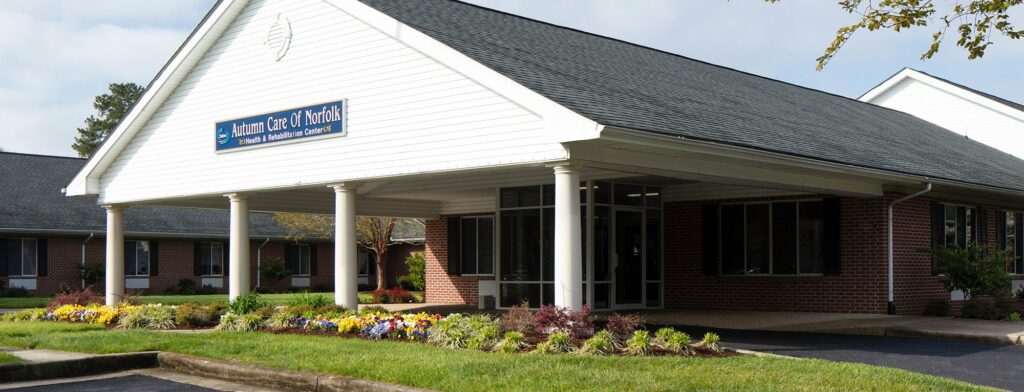
Consulate Health Care of Norfolk is a distinguished facility, boasting a substantial capacity of 222 beds for skilled nursing that aligns perfectly with nursing home requirements. Within this establishment, a strong sense of community is evident, fostering a supportive and caring environment. Their expertise extends to a wide spectrum of services, including short-term rehabilitation and long-term care. These services encompass physical, occupational, and speech therapies, ensuring a holistic approach to care.
Furthermore, Consulate Health Care of Norfolk excels as a memory care center. Their specialization also extends to the care of medically complex patients, supported by a comprehensive discharge planning program and post-acute care services. The patient care experience at this facility is exceptional, marked by a profound commitment to compassion and an unwavering dedication to exceeding expectations.
May provide extensive amenities, services and programs.
Occupancy is moderate, suggesting balanced demand.
Most residents stay for extended periods and receive ongoing daily care.
3% of new residents, usually for short-term rehab.
29% of new residents, often for short stays.
68% of new residents, often for long-term daily care.
In Virginia, the Department of Social Services (for assisted living facilities) and the Department of Health (for nursing homes) perform the inspections required to maintain state and federal licensing.
Deficiencies indicate regulatory issues. A higher number implies the facility had several areas requiring improvement.
Virginia average 4.2
Last Health inspection on Jul 2024
Virginia average 38.4
Virginia average 8.93
Health citations are formal notices following inspections when they fail to comply with safety and care standards.
45 of 54 citations resulted from standard inspections; and 9 of 54 resulted from complaint investigations.
Virginia average: 0.4
Virginia average: 1
Data sourced from CMS Health Deficiencies reports. Citation severity codes range from A (least serious) to L (most serious). Immediate Jeopardy (J-L) citations indicate situations where the facility's noncompliance has placed residents at risk of death or serious harm.
Nursing Home Licensed facility providing 24/7 skilled nursing care for residents with complex, ongoing medical needs. Staffed by RNs, LPNs, and CNAs. Inspected and star-rated annually by CMS. Accepts Medicare (short-term rehab) and Medicaid (long-term care).
Assisted Living A licensed, long-term care setting for seniors or individuals with disabilities who need help with daily activities — like bathing, dressing, and medication management — but not 24-hour skilled nursing. Offers housing, meals, and around-the-clock support while aiming to maximize resident independence.
![]() 2.6 miles from city center — 1.72 miles to nearest hospital (Sentara Norfolk General Hospital -Advanced Heart Failure)
2.6 miles from city center — 1.72 miles to nearest hospital (Sentara Norfolk General Hospital -Advanced Heart Failure)
![]() 3900 Llewellyn Ave, Norfolk, VA 23504
3900 Llewellyn Ave, Norfolk, VA 23504
Add your location
This data corresponds to Q2 2025 and is based on CMS Payroll-Based Journal.
Virginia average ratio: 1.67:1
Virginia average: 8 hours
Manages medical care and health needs.
No contractors work on this role.
Assists with medical care and medications.
No contractors work on this role.
Helps with daily care and mobility.
No contractors work on this role.
Total hours from contractors
1,737 contractor hours this quarter
| Certified Nursing Assistant | 142 | 0 | 142 | 28,432 | 91 | 100% | 8.5 |
| Licensed Practical Nurse | 50 | 0 | 50 | 10,735 | 91 | 100% | 8.8 |
| Registered Nurse | 11 | 0 | 11 | 2,758 | 91 | 100% | 9.6 |
| Clinical Nurse Specialist | 7 | 0 | 7 | 1,525 | 80 | 88% | 7.8 |
| Other Dietary Services Staff | 6 | 0 | 6 | 1,294 | 91 | 100% | 6.8 |
| Dental Services Staff | 4 | 0 | 4 | 1,238 | 71 | 78% | 9.4 |
| RN Director of Nursing | 4 | 0 | 4 | 898 | 83 | 91% | 7.8 |
| Mental Health Service Worker | 3 | 0 | 3 | 568 | 59 | 65% | 8 |
| Respiratory Therapy Technician | 0 | 3 | 3 | 522 | 46 | 51% | 7 |
| Nurse Practitioner | 3 | 0 | 3 | 512 | 63 | 69% | 8.1 |
| Dietitian | 2 | 0 | 2 | 500 | 63 | 69% | 7.9 |
| Administrator | 2 | 0 | 2 | 456 | 57 | 63% | 8 |
| Speech Language Pathologist | 0 | 2 | 2 | 338 | 44 | 48% | 7.5 |
| Physical Therapy Assistant | 0 | 2 | 2 | 335 | 44 | 48% | 6.9 |
| Qualified Social Worker | 0 | 3 | 3 | 329 | 47 | 52% | 6.9 |
| Occupational Therapy Aide | 0 | 3 | 3 | 81 | 14 | 15% | 4.5 |
| Physical Therapy Aide | 0 | 2 | 2 | 76 | 16 | 18% | 4.7 |
| Medical Director | 0 | 2 | 2 | 37 | 65 | 71% | 0.6 |
| Occupational Therapy Assistant | 0 | 1 | 1 | 19 | 13 | 14% | 1.4 |
Source: CMS Long-Term Care Facility Characteristics (Data as of Jan 2026)
Residents meet regularly to discuss policies, care quality, and activities
Organized group of residents that meets regularly to discuss facility policies, quality of life, and activities.
Data sourced from CMS Long-Term Care Facility Characteristics quarterly report. Payer mix reflects the current resident census by primary payment source.
These measures show how residents usually do over time at this home, based on health outcomes and preventive care.
Virginia average: 10.1
Virginia average: 19.7
Virginia average: 16.8%
Virginia average: 19.7%
Virginia average: 22.6%
Virginia average: 3.6%
Virginia average: 5.4%
Virginia average: 1.5%
Virginia average: 5.9%
Virginia average: 14.9%
Virginia average: 91.3%
Virginia average: 94.0%
Virginia average: 74.9%
Virginia average: 1.2%
Virginia average: 73.6%
Quality measures are calculated from Minimum Data Set (MDS) assessments. For most measures, lower percentages indicate better care quality.
Federal penalties imposed by CMS for regulatory violations, including civil money penalties (fines) and denials of payment for new Medicare/Medicaid admissions.
Source: CMS Penalties Database (Data as of Jan 2026)
Virginia average: $52K
Virginia average: 1.8
Virginia average: 0.1
Penalties are imposed by CMS for violations of federal nursing home regulations.
Last updated: Jan 2026
Historical financial and operational data for Consulate Health Care of Norfolk based on CMS SNF Cost Reports.
Loading trend charts...
Care Cost Calculator: See Prices in Your Area
Nursing Home Data Explorer
Don’t Wait Too Long: 7 Red Flag Signs Your Parent Needs Assisted Living Now
The True Cost of Assisted Living in 2025 – And How Families Are Paying For It
Understanding Senior Living Costs: Pricing Models, Discounts & Financial Assistance

Touring a community? Use this expert-backed checklist to stay organized, ask the right questions, and find the perfect fit.
We'll send you a PDF version of the touring checklist.