Country Oaks Care Center

Nursing Home
Overview of Country Oaks Care Center

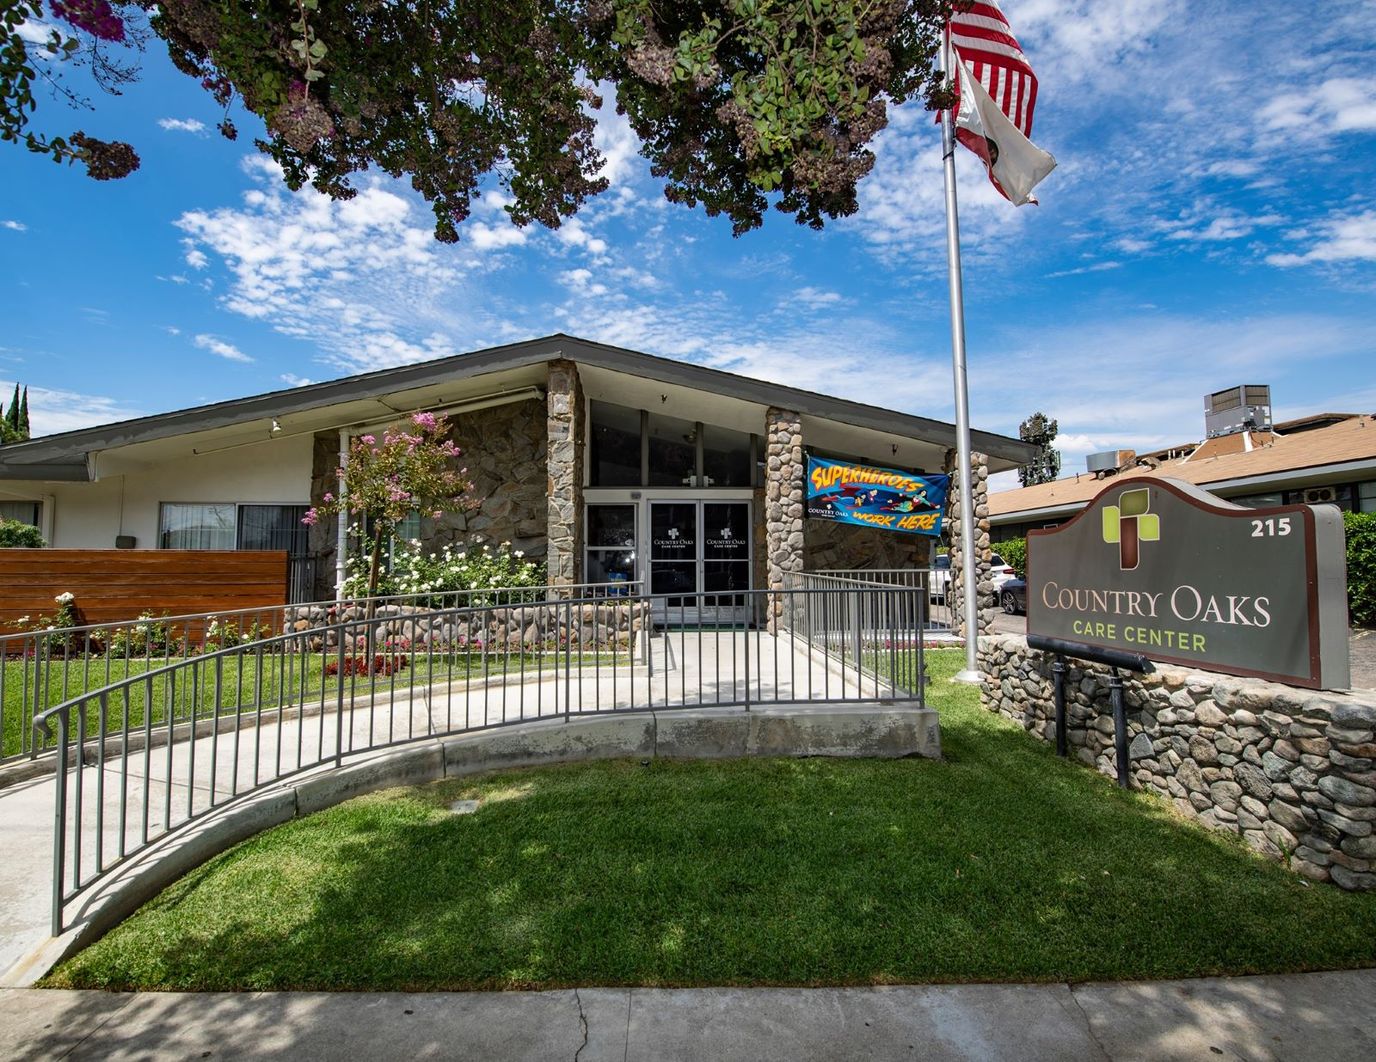
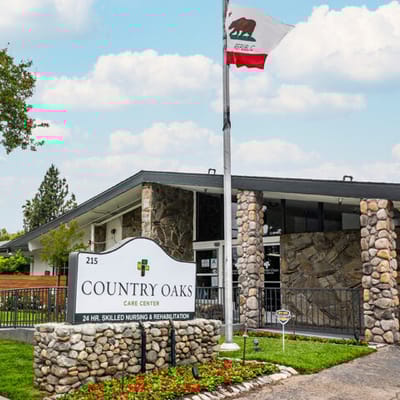
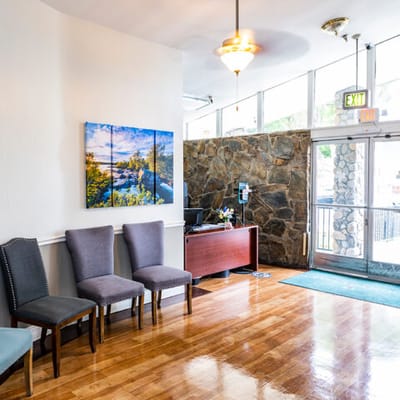
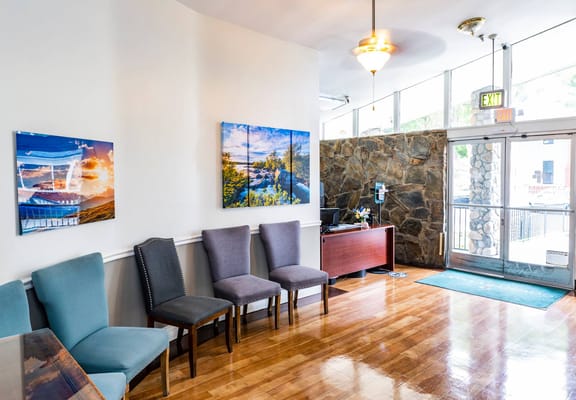
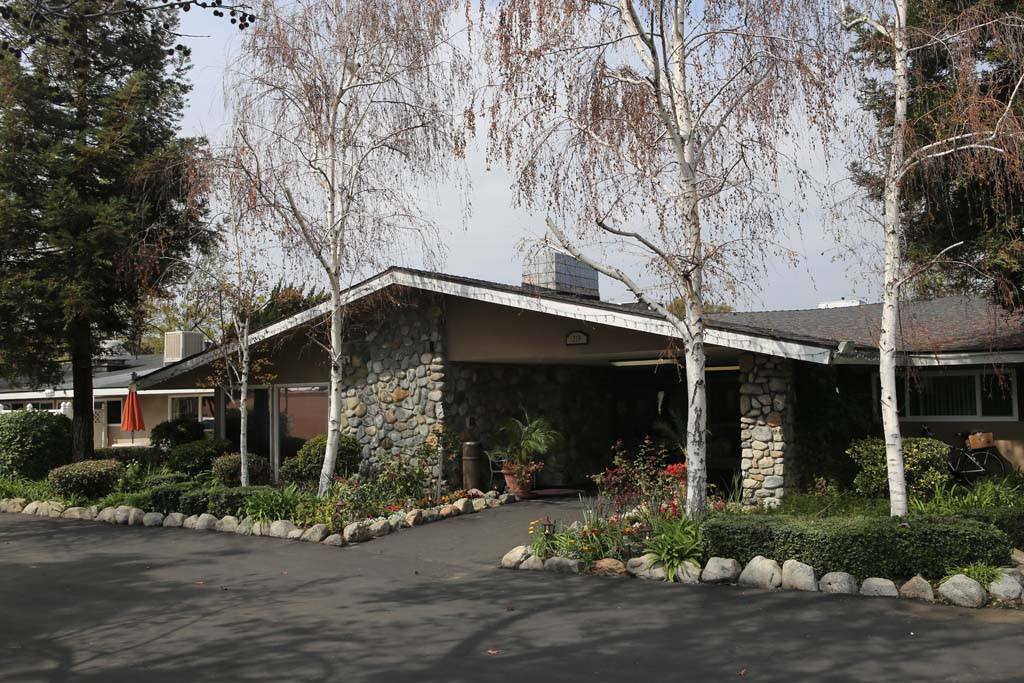
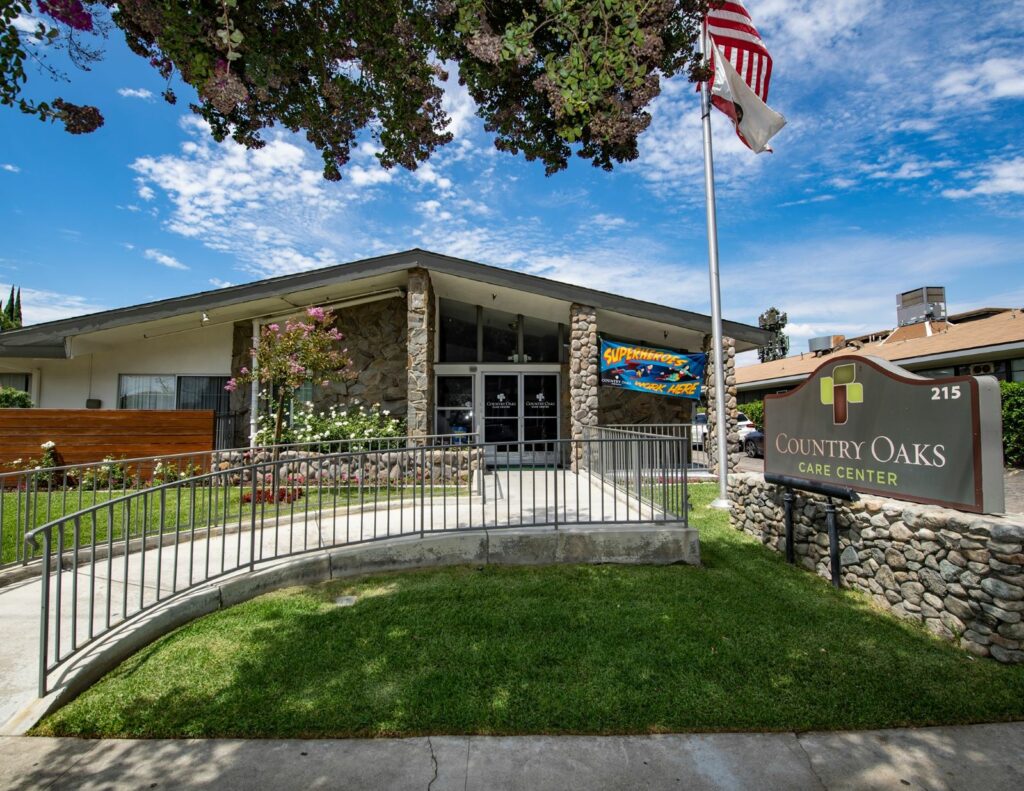
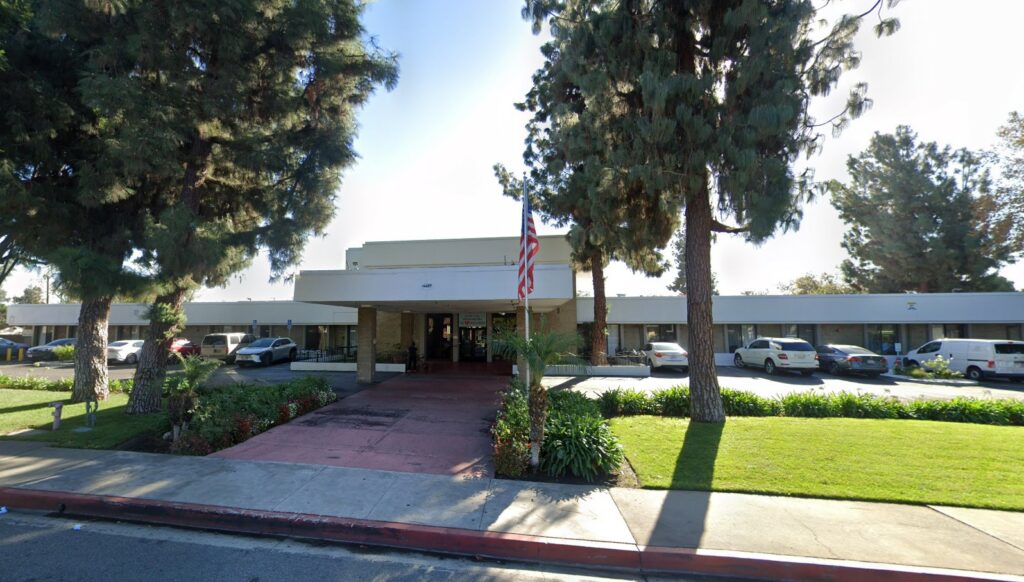
Country Oaks Care Center is a facility located in the heart of Pomona, CA, that provides compassionate, skilled nursing, and sub-acute care. As part of their services they provide their residents with 24/7 skilled nursing services, and an array of rehabilitation services to help residents stay healthy, as well as regain their mobility and independence if possible. These services include wound care and pain management, restorative nursing, as well as diabetic management.

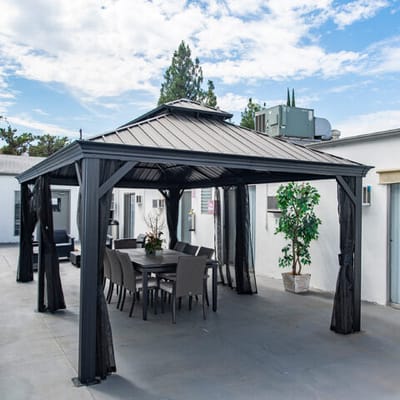
Country Oaks also ensure that residents not only get the healthcare their body needs, but also their psychosocial needs. Fitness activities, stretching exercises help enhance physical wellness, while outings, musical performances and outside entertainment enhance mental wellbeing and promote socialization.

(909) 622-1067

Quality ratings

Measured by Centers for Medicare & Medicaid Services (CMS)

Overall rating Info Official CMS rating based on health inspections, staffing and quality measures.
1/5
California average: 3.1/5
Health Inspection Info Official CMS rating based on deficiencies found during state health inspections.
1/5
California average: 2.8/5
Staffing Info Official CMS rating based on nurse staffing hours per resident per day.
4/5
California average: 3.1/5
Quality Measures Info Official CMS rating based on clinical outcomes for residents.
4/5
California average: 4.1/5

Nursing care per resident

Info Average daily nursing hours per resident (adjusted for acuity). Higher values indicate more nursing time per resident.
4h 10m per day

This home provides 1% less nursing time per resident than the state average.

California average: 4h 13m per day

Staffing hours breakdown

Info Hours of care per resident per day, broken down by staff type. Data from CMS Medicare.
Staff type Facility State avg National avg
Registered Nurse (RN) Info Registered nurse hours per resident per day. 27m per day 39m per day 41m per day
LPN / LVN Info Licensed Practical Nurse / Licensed Vocational Nurse hours per resident per day. 1h 32m per day 1h 13m per day 52m per day
Nurse Aide Info Nurse aide hours per resident per day. 2h 26m per day 2h 39m per day 2h 21m per day
Total Nursing (Weekend) Info Total number of nurse staff hours per resident per day on weekends. 3h 52m per day 4h 5m per day 3h 26m per day
Physical Therapist Info Physical therapist staff hours per resident per day. 3m per day 5m per day 4m per day
RN (Weekend) Info Registered nurse hours per resident per day on weekends. 23m per day 30m per day 29m per day

Capacity and availability

Smaller home

May offer a more intimate, personalized care environment.

Total beds 81

This home usually has limited availability

Occupancy is moderate, suggesting balanced demand.

Similar demand to the California average
Occupancy rate 87.8%
Residents per day (avg) 50
Occupancy rate
87.8%
Residents per day (avg)
50

Who this home usually serves

TYPE OF STAY

Mix of rehab and long-term care

This home supports both short-term rehab and long-term care, with residents staying for a wide range of durations.

Breakdown by payment type

Medicare

24% of new residents, usually for short-term rehab.

Typical stay 13 days

Private pay

50% of new residents, often for short stays.

Typical stay 4 days

Medicaid

26% of new residents, often for long-term daily care.

Typical stay 2 - 3 months

Finances and operations

Proprietary home
Other
Home revenue
$20.2M
Profit
$1.0M
Proprietary home Other
Home revenue
$20,245,323.00
Profit
$1,037,594.00
Payroll costs Info The portion of the home's budget spent on staff, including nurses, caregivers, and other employees who support care and operations.
$7.9M
38.8% of revenue
Other operating costs Info All remaining costs needed to run the home, such as food, utilities, building maintenance, supplies and administrative expenses.
$11.3M
Total costs $19.2M
Walk Score
Walk Score: 87 / 100
Very walkable. Most errands can be accomplished on foot, and many essentials are within a short walk.
BBB Rating
BBB Rating: A+ (Not Accredited)
An independent rating from the Better Business Bureau based on factors such as complaint history, transparency, and business practices.
How BBB ratings work

About this community

Additional licensing details

CMS Certification Number: 55247

Care Services

Accepts Medicare
Nursing Services
Rehabilitation Services
Skilled Nursing
Licensed Nurses/CNAs
24-Hour Staffing

Programs & Activities

Specific Programs
Rehabilitation, Skilled Nursing, Sub-Acute Unit, Social Services, Activities
Operating Hours
24 hours a day, 7 days a week

Types of Care at Country Oaks Care Center

Skilled Nursing
Contact Country Oaks Care Center

Access & Eligibility

Ways to qualify for care at this community, including accepted programs and payment options.

Medicare Accepted

This facility is certified for eligible Medicare services.

Payment & Funding Options

Medicare

Compare Nursing Homes around Pomona

The information below is reported by the California Department of Social Services and Department of Public Health.
Claremont Care Center
SNF

Nursing Homes 24/7 care needed

Pomona
99
No
-
72
ARELLANO, CARLA
85.9%
$15,917,041.00
$7,148,619.00
44.9%
84.10
3/5
3.9250
3/5
4/5
4/5
-
50
-
-38%
-7%
+1%
Chino Valley Healthcare Center
SNF

Nursing Homes 24/7 care needed

Pomona
102
No
A+
45
FRIEDMAN FAMILY TRUST
95.1%
$16,458,709.00
$5,062,368.00
30.8%
96.50
3/5
4.9904
2/5
4/5
5/5
1
42
1
-23%
+18%
+12%
Pomona Vista Care Center
SNF

Nursing Homes 24/7 care needed

Pomona
59
No
A+
91
MJB PARTNERS LLC
91.0%
$16,520,341.00
$4,768,143.00
28.9%
53.40
2/5
3.8367
2/5
4/5
4/5
2
74
2
-24%
-9%
+7%
Country Oaks Care Center
SNF

Nursing Homes 24/7 care needed

Pomona
81
No
A+
87
COUNTRY OAKS PARTNERS LLC
87.8%
$18,482,937.00
$7,858,604.00
42.5%
50.10
1/5
4.1680
1/5
4/5
4/5
2
94
1
-24%
-1%
+4%
Park Avenue Healthcare & Wellness Centre
SNF

Nursing Homes 24/7 care needed

Pomona
231
No
A+
73
POMONA NURSING & HEALTHCARE CENTRE, LLC
93.9%
$42,197,937.00
$14,983,651.00
35.5%
215.10
1/5
3.6139
1/5
3/5
-
6
154
4
-5%
-14%
+11%

Places of interest near Country Oaks Care Center

Address 0.8 miles from city center — 0.88 miles to nearest hospital (Pomona Valley Hospital Medical Center)

Address 215 W Pearl St, Pomona, CA 91768

Calculate Travel Distance to Country Oaks Care Center

Add your location

Address

Staffing Data

Source: CMS Payroll-Based Journal (Q2 2025)

155
Total Staff
153
Employees
2
Contractors
31,701
Total Hours (Quarter)
46
Avg Staff/Day
7.6
Avg Shift (hrs)
Nursing Staff Breakdown
Role Count Avg Shift (hrs) Uses Contractors?
Registered Nurse109.5 No
Licensed Practical Nurse399.8 No
Certified Nursing Assistant437.1 No
Staff by Category
Administration
3 staff
4.5hs shift avg
Nursing Staff
97 staff
8.1hs shift avg
Physicians & Practitioners
8 staff
8.6hs shift avg
Therapy Services
22 staff
4.4hs shift avg
Activities & Recreation
13 staff
8.3hs shift avg
Social Services
4 staff
3.9hs shift avg
Dietary Services
7 staff
7.6hs shift avg
Other Services
1 staff
8hs shift avg
Contractor Analysis
0.2%
of total hours from contractors
60 contractor hours this quarter
Medical Director: 2
Role Employees Contractors Total Staff Total Hours Days Worked % of Days Avg Shift (hrs)
Certified Nursing Assistant4304311,95591100%7.1
Licensed Practical Nurse390399,17091100%9.8
Other Dietary Services Staff7072,06391100%7.6
Qualified Activities Professional120121,7287077%8.3
Registered Nurse100101,6628593%9.5
RN Director of Nursing5051,4206976%7.7
Physical Therapy Aide7076657582%5.4
Clinical Nurse Specialist7075925965%9.1
Dental Services Staff1014966268%8
Nurse Practitioner1014165257%8
Speech Language Pathologist8083506673%3
Physical Therapy Assistant4043296571%4.9
Respiratory Therapy Technician3032875560%4.5
Qualified Social Worker4042616571%3.9
Administrator1012466268%4
Medical Director0226033%10
Therapeutic Recreation Specialist101211%2

Health Inspection History

Inspections
Total health inspections 26

California average 12.5


Last Health inspection on Jul 2025

Total health citations 94
Citations per inspection
3.62

Health citations are formal notices following inspections when they fail to comply with safety and care standards.

49 of 94 citations resulted from standard inspections; and 45 of 94 resulted from complaint investigations.

Breakdown of citation severity (last 3 years)
Critical Health citations More info 1
150% worse than California average

California average: 0.4


Serious Health citations More info 0
100% better than California average

California average: 1

1 critical citation More info California average: 0.4

0 serious citations More info California average: 1

90 moderate citations More info California average: 47.2

3 minor citations More info California average: 1.5
Citations history (last 3 years)
Nursing Services moderate citation Jul 17, 2025
Corrected

Quality of Care moderate citation Jul 17, 2025
Corrected

Care Planning moderate citation Jul 17, 2025
Corrected

Infection Control moderate citation Apr 16, 2025
Corrected

Facility Characteristics

Source: CMS Long-Term Care Facility Characteristics (Data as of Jan 2026)

Ownership: For-Profit LLC
Resident Census by Payment Source
66 Total Residents
Medicare 12 (18.2%)
Medicaid 38 (57.6%)
Private Pay/Other 16 (24.2%)
Specialized Care Beds
40 Total Specialty Beds
49.4% of Bed Capacity
40
Ventilator Beds
49.4%
Programs & Services
Residents' Group
Nurse Aide Training
Family Engagement

Active councils help families stay involved in care decisions and facility operations.

Quality of care over time

These measures show how residents usually do over time at this home, based on health outcomes and preventive care.

High-risk clinical events score Info A composite score based on pressure ulcers, falls with injury, weight loss, walking ability decline, and activities of daily living decline. 3.2
53% better than California average

California average: 6.6

Functional decline score Info A composite score based on activities of daily living decline, walking ability decline, and incontinence. 0.9
92% better than California average

California average: 11.3

Long-stay resident measures
Need for Help with Daily Activities Increased Info Percent of long-stay residents whose need for help with daily activities has increased 2.8%
75% better than California average

California average: 11.1%

Walking Ability Worsened Info Percent of long-stay residents whose ability to move independently worsened 0.0%
100% better than California average

California average: 12.0%

Low Risk Residents with Bowel/Bladder Incontinence Info Percent of low risk long-stay residents who lose control of their bowels or bladder 0.0%
100% better than California average

California average: 11.3%

Falls with Major Injury Info Percent of long-stay residents experiencing one or more falls with major injury 0.0%
100% better than California average

California average: 1.7%

High Risk Residents with Pressure Ulcers Info Percent of long-stay high risk residents with pressure ulcers 12.5%
153% worse than California average

California average: 5.0%

Urinary Tract Infection Info Percent of long-stay residents with a urinary tract infection 0.0%
100% better than California average

California average: 1.2%

Lost Too Much Weight Info Percent of long-stay residents who lose too much weight 0.5%
89% better than California average

California average: 4.2%

Depressive Symptoms Info Percent of long-stay residents who have depressive symptoms 2.5%
63% better than California average

California average: 6.7%

Antipsychotic Use Info Percent of long-stay residents who received an antipsychotic medication 3.2%
68% better than California average

California average: 10.1%

Pneumococcal Vaccine Info Percent of long-stay residents assessed and appropriately given the pneumococcal vaccine 100.0%
In line with California average

California average: 98.5%

Influenza Vaccine Info Percent of long-stay residents assessed and appropriately given the seasonal influenza vaccine 100.0%
In line with California average

California average: 98.2%

Hospitalizations per 1,000 days Info Number of hospitalizations per 1,000 long-stay resident days. 2.58
15% worse than California average

California average: 2.25

ED visits per 1,000 days Info Number of outpatient emergency department visits per 1,000 long-stay resident days. 1.98
25% worse than California average

California average: 1.59

Short-stay resident measures
Pneumococcal Vaccine Info Percent of short-stay residents assessed and appropriately given the pneumococcal vaccine 100.0%
6% better than California average

California average: 94.0%

Antipsychotic medication increase Info Percent of short-stay residents who newly received an antipsychotic medication 0.9%
41% better than California average

California average: 1.5%

Influenza Vaccine Info Percent of short-stay residents assessed and appropriately given the seasonal influenza vaccine 100.0%
7% better than California average

California average: 93.2%

Re-hospitalized after SNF stay Info Percentage of short-stay residents who were re-hospitalized after their nursing home admission. 29.3%
26% worse than California average

California average: 23.2%

Emergency department visits Info Percentage of short-stay residents who had an outpatient emergency department visit. 7.8%
30% better than California average

California average: 11.2%

Falls with major injury Info Percentage of SNF residents who experience falls with major injury during their stay. 0.0%
100% better than California average

California average: 0.8%

Ability to care for self at discharge Info Percentage of residents at or above expected ability to care for themselves at discharge. 54.9%
In line with California average

California average: 53.7%

Successful return to home or community Info Rate of successful return to home or community from a skilled nursing facility. 45.0%
11% worse than California average

California average: 50.6%

Penalties and fines

Federal penalties imposed by CMS for regulatory violations, including civil money penalties (fines) and denials of payment for new Medicare/Medicaid admissions.

Source: CMS Penalties Database (Data as of Jan 2026)

Total fines amount $24K
56% lower than California average

California average: $55K

Number of fines 2
15% fewer fines than California average

California average: 2.4

Payment Denials Info Serious action where Medicare and/or Medicaid temporarily stops payments for new residents until issues are fixed. 0
100% fewer payment denials than California average

California average: 0.5

Fines amount comparison
This facility $24K
California average $55K
Penalty History

Penalties are imposed by CMS for violations of federal nursing home regulations.

Civil Money Penalty Info Fines imposed for noncompliance, which can be assessed per day or per instance of violation. Apr 27, 2023
$14K
Civil Money Penalty Info Fines imposed for noncompliance, which can be assessed per day or per instance of violation. Jan 11, 2023
$10K

Last updated: Jan 2026

Guides for Better Senior Living

Care Cost Calculator: See Prices in Your Area

Nursing Home Data Explorer

Don’t Wait Too Long: 7 Red Flag Signs Your Parent Needs Assisted Living Now

The True Cost of Assisted Living in 2025 – And How Families Are Paying For It

Understanding Senior Living Costs: Pricing Models, Discounts & Financial Assistance

Financial Aid for California Seniors

Get financial aid guidance

Multipurpose Senior Services Program

MSSP (Medi-Cal Waiver)

Age 65+, California resident, Medi-Cal eligible, nursing home risk.

~$2,829/month (300% FBR, individual).

$2,000 (individual), $3,000 (couple).

County-managed; waitlists possible.

In-Home Supportive Services (IHSS)

California IHSS

Age 65+, California resident, Medicaid-eligible or low-income.

~$1,732/month (individual, Medi-Cal threshold).

$2,000 (individual).

Can hire family as caregivers.

Multipurpose Senior Services Program (MSSP)

CA MSSP

Age 65+, California resident, Medi-Cal-eligible, nursing home-eligible but community-capable.

~$2,829/month (300% FBR, individual).

$2,000 (individual).

Available in 38 counties; waitlists common.

Property Tax Postponement Program (PTP)

CA PTP

Age 62+, California resident, own and live in home, 40% equity.

~$51,500/year (household, adjusted annually).

Equity-based; no strict asset cap.

Deferred taxes accrue interest (5% as of 2024); repaid upon sale/death.

Assisted Living Waiver (ALW)

CA ALW

Age 65+ or disabled, California resident, Medi-Cal-eligible, nursing home-eligible.

~$2,829/month (300% FBR, individual).

$2,000 (individual).

Available in 15 counties (e.g., LA, Sacramento); waitlists common.

California CARES Program

CA CARES

Caregivers of California residents 60+ needing help with 3+ daily activities; no caregiver age limit.

No strict limit; cost-sharing above ~$2,500/month threshold.

Not applicable; need-based.

High demand in urban areas; complements IHSS respite.

Low-Income Home Energy Assistance Program (LIHEAP)

CA LIHEAP

Age 60+ priority, California resident, low-income, utility/heating need.

~$2,510/month (200% of poverty level, individual).

Not applicable; income-focused.

High demand in inland/coastal extremes; weatherization capped at $5,000/home.

Who we are

Your Senior Care Partner, Every Step of the Way

We help families find affordable senior communities and unlock same day discounts, Medicaid, and Medicare options tailored to your needs.

Contact us Today
Tour Icon
Planning a tour? Check our touring checklist.
Chat Icon
Thinking of living here? We can help you speak to a current resident