Covered Bridge Manor
Independent Living · Dover, NH
CMS overall rating Info The Overall CMS Rating is scored from 1 to 5 stars and combines results from health inspections, staffing levels, and quality measures. Health inspections carry the most weight. Staffing and quality scores can increase or decrease the final rating based on performance compared to state and national standards.

Covered Bridge Manor

Independent Living · Dover, NH
CMS overall rating Info The Overall CMS Rating is scored from 1 to 5 stars and combines results from health inspections, staffing levels, and quality measures. Health inspections carry the most weight. Staffing and quality scores can increase or decrease the final rating based on performance compared to state and national standards.

Overview of Covered Bridge Manor

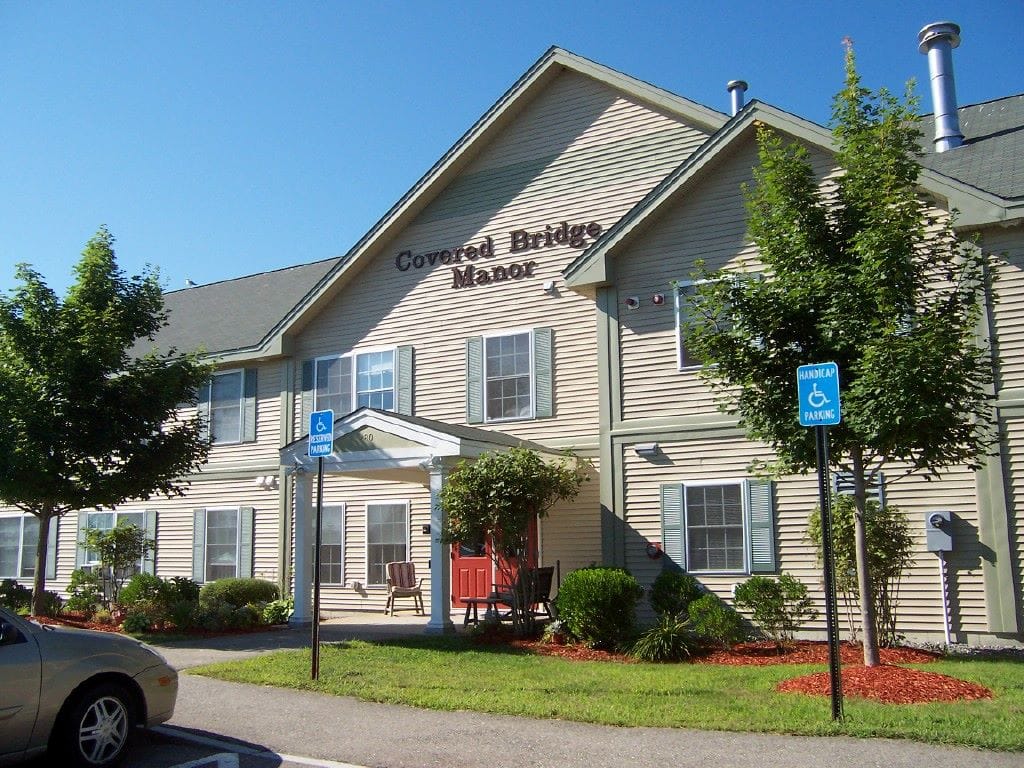
Completed in 2004, Covered Bridge Manor is a welcoming community comprising 26 comfortable apartments designed with elderly residents in mind. The facility offers a range of amenities to enhance the quality of life for its residents, including a common room, a convenient laundry room, and a delightful three-season patio area.

The Dover Housing Authority (DHA) is vital in managing this complex. They diligently screen applicants to ensure a suitable and harmonious living environment for all residents. Additionally, the DHA oversees the maintenance of the facility, ensuring that it remains in excellent condition. Furthermore, the construction of Covered Bridge Manor underscores a commitment to meeting the housing needs of the elderly in Strafford County. In collaboration with Strafford County Community Action and other agencies, the Dover Housing Authority actively brought this valuable addition to the community, providing much-needed elderly housing in the region.

Quality ratings

Measured by Centers for Medicare & Medicaid Services (CMS)

Overall rating Info The Overall CMS Rating combines results from health inspections, staffing levels and quality measures. Health inspections carry the most weight. Staffing and quality scores can increase or decrease the final rating based on performance compared to state and national standards.
▲ 32.7% Above NH avg. ▲ 32.7% Above NH avg.Click the badge to see the full State ranking.Click here to see the full State ranking.
Health Inspection Info Based on the results of the facility's three most recent standard inspections and any complaint investigations. CMS reviews the number, scope, and severity of deficiencies, with more recent findings weighted more heavily.
▲ 39.7% Above NH avg. ▲ 39.7% Above NH avg.Click the badge to see the full State ranking.Click here to see the full State ranking.
Staffing Info Measures average nursing staff hours per resident per day, including Registered Nurses (RNs) and total nursing staff. Ratings are adjusted based on the level of care residents require and are compared to state and national benchmarks.
▲ 24.8% Above NH avg. ▲ 24.8% Above NH avg.Click the badge to see the full State ranking.Click here to see the full State ranking.
Quality Measures Info Based on clinical and physical health indicators reported to CMS, such as hospital readmissions, falls, pressure ulcers, and improvements in mobility. These measures reflect how well residents' health needs are being managed.
▲ 26.4% Above NH avg. ▲ 26.4% Above NH avg.Click the badge to see the full State ranking.Click here to see the full State ranking.

Staffing hours breakdown

Info Daily nursing hours per resident by staff type, reported to CMS. Higher is generally better — compare this facility to state and national averages to see where staffing stands.

Hours per resident per day — compared to New Hampshire state averages

Total nursing care / resident Info This home is ranked 6th out of 58 homes in New Hampshire. Total adjusted nursing hours per resident per day, combining RN, LPN, and aide time. CMS adjusts this for case-mix so facilities can be fairly compared.
5h 34m per day
Rank #6 / 58Nurse hours — State benchmarkedThis home is ranked 6th out of 58 homes in New Hampshire. Shows adjusted nurse hours per resident per day benchmarked to the New Hampshire average, with a ranking across 58 New Hampshire SNFs. More hours mean more direct care. The national average is about 3.5 hrs; below 3.0 is a red flag.Click the rank badge to see the full State ranking.Click here to see the full State ranking.
This facility New Hampshire avg (4h 17m per day)
vs New Hampshire avg
+30%
Staff typeHours / Day / Residentvs state avg
Total Nursing (Weekend) Info Combined nursing hours (RN + LPN + Nurse Aide) per resident per day on weekends. Staffing often drops on weekends — this figure reveals whether the facility maintains adequate coverage outside of weekday hours. 4h 1m per day

Types of Care at Covered Bridge Manor

Independent Living

Capacity and availability

This home usually has availability

Occupancy lower than 85% suggests more openings may be available.

Lower occupancy than the New Hampshire average: 81.1%
Occupancy rate 71.6% Rank #46 / 58Occupancy rate — State benchmarkedThis home is ranked 46th out of 58 homes in New Hampshire. Shows this facility's occupancy rate versus the New Hampshire average, with its Statewide rank out of 58. Higher occupancy signals strong local demand and financial stability.Click the rank badge to see the full State ranking.Click here to see the full State ranking.
Occupancy rate
71.6% Rank #46 / 58Occupancy rate — State benchmarkedThis home is ranked 46th out of 58 homes in New Hampshire. Shows this facility's occupancy rate versus the New Hampshire average, with its Statewide rank out of 58. Higher occupancy signals strong local demand and financial stability.Click the rank badge to see the full State ranking.Click here to see the full State ranking.
Walk Score
Walk Score: 8 / 100 Rank #38 / 59Walk Score — State benchmarkedThis home is ranked 38th out of 59 homes in New Hampshire. Shows how walkable this facility's neighborhood is compared to the average Walk Score across New Hampshire SNFs. Higher scores benefit residents, families, and staff.Click the rank badge to see the full State ranking.Click here to see the full State ranking.
Car-dependent. Most errands require a car, with limited nearby walkable options.

Contact Covered Bridge Manor

Staffing Data

Reporting period: October 1 – December 31, 2025 (Q4 2025). Source: CMS Payroll-Based Journal report.

Total staff 213
Employees 213
Contractors 0
Staff to resident ratio 1.39:1
25% worse than New Hampshire average
New Hampshire average ratio: 1.87:1 New Hampshire average ratio: 1.87:1See full New Hampshire ranking
Avg staff/day 112
Average shift 7.6 hours
0% compared with New Hampshire average
New Hampshire average: 7.8 hours New Hampshire average shift: 7.8 hoursSee full New Hampshire ranking
Total staff hours (quarter) 77,882

Nursing staff breakdown

Q4 2025 · Oct 1 – Dec 31 More info This data comes from the CMS Payroll-Based Journal report covering October 1 – December 31, 2025.
Registered Nurse

Manages medical care and health needs.

Total count 46
Average shift length Info Average shift length. Calculated as total hours divided by days worked and average staff per day. 7.9 hours

No contractors work on this role.

Licensed Practical Nurse

Assists with medical care and medications.

Total count 26
Average shift length Info Average shift length. Calculated as total hours divided by days worked and average staff per day. 7.9 hours

No contractors work on this role.

Certified Nursing Assistant

Helps with daily care and mobility.

Total count 100
Average shift length Info Average shift length. Calculated as total hours divided by days worked and average staff per day. 7.5 hours

No contractors work on this role.

Contractor staffing

Q4 2025 · Oct 1 – Dec 31 More info This data comes from the CMS Payroll-Based Journal report covering October 1 – December 31, 2025.

Total hours from contractors

0%

0 contractor hours this quarter

No contractor roles were reported this quarter.

Staff by category

Q4 2025 · Oct 1 – Dec 31 More info This data comes from the CMS Payroll-Based Journal report covering October 1 – December 31, 2025.
Certified Nursing Assistant100010036,45292100%7.5
Registered Nurse4604617,08692100%7.9
Licensed Practical Nurse260269,41292100%7.9
Other Dietary Services Staff140145,22692100%7.5
Medication Aide/Technician6062,60892100%7.9
Therapeutic Recreation Specialist4041,7807480%8
Mental Health Service Worker4041,3956368%6.8
Speech Language Pathologist2027936267%7.4
Nurse Practitioner1015026470%7.8
Administrator1014976470%7.8
Physical Therapy Assistant1014536065%7.5
Dietitian1014055964%6.9
Occupational Therapy Aide1013715358%7
Other Physician3033496672%3.7
Respiratory Therapy Technician1012543437%7.5
Medical Director1011504043%3.8
Clinical Nurse Specialist1011502123%7.1
100 Certified Nursing Assistant
% of Days 100%
46 Registered Nurse
% of Days 100%
26 Licensed Practical Nurse
% of Days 100%
14 Other Dietary Services Staff
% of Days 100%
6 Medication Aide/Technician
% of Days 100%
4 Therapeutic Recreation Specialist
% of Days 80%
4 Mental Health Service Worker
% of Days 68%
2 Speech Language Pathologist
% of Days 67%
1 Nurse Practitioner
% of Days 70%
1 Administrator
% of Days 70%
1 Physical Therapy Assistant
% of Days 65%
1 Dietitian
% of Days 64%
1 Occupational Therapy Aide
% of Days 58%
3 Other Physician
% of Days 72%
1 Respiratory Therapy Technician
% of Days 37%
1 Medical Director
% of Days 43%
1 Clinical Nurse Specialist
% of Days 23%

Penalties and fines

Federal penalties imposed by CMS for regulatory violations, including civil money penalties (fines) and denials of payment for new Medicare/Medicaid admissions.

Source: CMS Penalties Database

No penalties in the past 3 years

No civil money penalties or payment denials were reported in the last 3 years.

Quality of care over time

These measures show how residents usually do over time at this home, based on health outcomes and preventive care.

High-risk clinical events score Info A composite score based on pressure ulcers, falls with injury, weight loss, walking ability decline, and activities of daily living decline. 7.9
31% better than New Hampshire average

New Hampshire average: 11.4

Functional decline score Info A composite score based on activities of daily living decline, walking ability decline, and incontinence. 19.1
18% better than New Hampshire average

New Hampshire average: 23.2

Long-stay resident measures
Need for Help with Daily Activities Increased Info Percent of long-stay residents whose need for help with daily activities has increased 18.5%
16% better than New Hampshire average

New Hampshire average: 21.9%

Walking Ability Worsened Info Percent of long-stay residents whose ability to move independently worsened 12.2%
40% better than New Hampshire average

New Hampshire average: 20.3%

Low Risk Residents with Bowel/Bladder Incontinence Info Percent of low risk long-stay residents who lose control of their bowels or bladder 26.5%
In line with New Hampshire average

New Hampshire average: 27.1%

Falls with Major Injury Info Percent of long-stay residents experiencing one or more falls with major injury 3.3%
27% better than New Hampshire average

New Hampshire average: 4.6%

High Risk Residents with Pressure Ulcers Info Percent of long-stay high risk residents with pressure ulcers 3.1%
31% better than New Hampshire average

New Hampshire average: 4.5%

Urinary Tract Infection Info Percent of long-stay residents with a urinary tract infection 1.5%
40% better than New Hampshire average

New Hampshire average: 2.5%

Lost Too Much Weight Info Percent of long-stay residents who lose too much weight 2.2%
61% better than New Hampshire average

New Hampshire average: 5.6%

Depressive Symptoms Info Percent of long-stay residents who have depressive symptoms 1.9%
78% better than New Hampshire average

New Hampshire average: 8.3%

Antipsychotic Use Info Percent of long-stay residents who received an antipsychotic medication 34.4%
98% worse than New Hampshire average

New Hampshire average: 17.4%

Pneumococcal Vaccine Info Percent of long-stay residents assessed and appropriately given the pneumococcal vaccine 99.2%
In line with New Hampshire average

New Hampshire average: 96.0%

Influenza Vaccine Info Percent of long-stay residents assessed and appropriately given the seasonal influenza vaccine 99.4%
In line with New Hampshire average

New Hampshire average: 98.0%

Short-stay resident measures
Pneumococcal Vaccine Info Percent of short-stay residents assessed and appropriately given the pneumococcal vaccine 30.0%
64% worse than New Hampshire average

New Hampshire average: 83.8%

Antipsychotic medication increase Info Percent of short-stay residents who newly received an antipsychotic medication 4.6%
188% worse than New Hampshire average

New Hampshire average: 1.6%

Influenza Vaccine Info Percent of short-stay residents assessed and appropriately given the seasonal influenza vaccine 26.8%
68% worse than New Hampshire average

New Hampshire average: 83.0%

Facility Characteristics

Source: CMS Long-Term Care Facility Characteristics (Data as of Jan 2026)

Total residents 153
Medicare
1
0.7% of residents
Medicaid
125
81.7% of residents
Private pay or other
27
17.6% of residents
Programs & Services
Residents Group

Residents meet regularly to discuss policies, care quality, and activities

Nurse Aide Training

State-approved Nurse Aide Training and Competency Evaluation Program on-site

Active Resident Council

Organized group of residents that meets regularly to discuss facility policies, quality of life, and activities.

Finances and operations

Governmental community
Operated by county authorities.
Home revenue
$15.6M
Governmental community Operated by county authorities.
Home revenue
$15.6M Rank #24 / 58Revenue — State benchmarkedThis home is ranked 24th out of 58 homes in New Hampshire. Shows this facility's annual revenue compared to the New Hampshire SNF average. Higher revenue generally means more resources for staffing and capital — read alongside Payroll %.Click the rank badge to see the full State ranking.Click here to see the full State ranking.
Payroll costs Info The portion of the home's budget spent on staff, including nurses, caregivers, and other employees who support care and operations. Rank #6 / 58Payroll — State benchmarkedThis home is ranked 6th out of 58 homes in New Hampshire. Shows total annual staff payroll benchmarked to the New Hampshire average. Higher payroll investment relative to peers often signals better staffing and less reliance on cheaper contract labor.Click the rank badge to see the full State ranking.Click here to see the full State ranking.
$16.5M
105.9% of revenue Rank #1 / 58Payroll % — State benchmarkedThis home is ranked 1st out of 58 homes in New Hampshire. Shows payroll as a percentage of revenue versus the New Hampshire average. Well-run New Hampshire SNFs typically land around 59–80% — the top third Statewide. Below 25% may signal understaffing or heavy agency use — read with Staffing ratings.Click the rank badge to see the full State ranking.Click here to see the full State ranking.

What does this home offer?

Building type icon
Building type icon

Building Type: 2-story

Fitness and recreation icon

Fitness and Recreation

Places of interest near Covered Bridge Manor

Address 7.7 miles from city center Info Estimated distance in miles from Dover's city center to Covered Bridge Manor's address, calculated via Google Maps. — 3.45 miles to nearest hospital (Wentworth-Douglass Hospital)

Calculate Travel Distance to Covered Bridge Manor

Add your location

Address

Financial Assistance for
Independent Living in New Hampshire

Covered Bridge Manor is located in Dover, New Hampshire.
Here are the financial assistance programs available to residents in New Hampshire.

Get Financial aid guidance

Choices for Independence

NH Medicaid CFI Waiver

Age 65+ or disabled
General New Hampshire resident, Medicaid-eligible, nursing home-level care need.
Income Limits (2025) ~$2,829/month 300% FBR, individual
Asset Limits $2,000 (individual), $3,000 (couple).
NH

Small state; rural access emphasis.

Benefits
Personal care (5-7 hours/day) Respite (240 hours/year) Adult day care (~$65/day) Home aides

NH ServiceLink Aging and Disability Resource Center

NH ServiceLink

Age 60+
General New Hampshire resident, or caregiver.
Income Limits No strict limit; prioritizes low-income.
Asset Limits Not applicable.
NH

Primarily referral-based; limited direct funding.

Benefits
Care coordination Respite (up to 5 days/year) Transportation (~5 trips/month)

Old Age Assistance (OAA)

New Hampshire Old Age Assistance

Age 65+
General NH resident, US citizen/eligible alien, not in public institution.
Income Limits (2025) ~$1,063/month (individual, net after deductions); varies by living arrangement.
Asset Limits $1,500 (individual), $2,000 (couple).
NH

Automatic Medicaid eligibility; estate recovery applies.

Benefits
Cash (~$50-$200/month) for living costs (e.g., rent, utilities, care support)

New Hampshire Family Caregiver Program (via NFCSP)

New Hampshire Family Caregiver Program

Age
General Caregivers of 60+ needing care or 55+ caregivers of others; NH resident; functional needs (2+ ADLs).
Income Limits (2025) Prioritizes ~$24,980/year (individual); no strict cap.
Asset Limits Not assessed; need-based.
NH

13 ServiceLink locations; rural/low-income priority.

Benefits
Respite (4-6 hours/week or 5 days/year) Adult day care ($60/day) Training Supplies (~$500/year)

Medicare Savings Program (MSP)

New Hampshire Medicare Savings Program

Age 65+ or disabled
General NH resident, Medicare Part A/B.
Income Limits (2025) ~$2,510/month (QMB), ~$3,380/month (SLMB), ~$3,598/month (QI)—individual.
Asset Limits $9,430 (individual), $14,130 (couple).
NH

Three tiers; no waitlist; includes Extra Help for Part D.

Benefits
Covers Part B premiums ($174.70/month) Deductibles ($240/year) Copays (~20%)

New Hampshire Fuel Assistance Program (FAP)

New Hampshire Fuel Assistance Program

Age 60+ prioritized
General NH resident, low-income household.
Income Limits (2025) ~$33,614/year (1-person), ~$43,958/year (2-person) (150% FPL).
Asset Limits Not assessed; income-focused.
NH

Administered by 5 CAP agencies; covers oil, gas, electric, wood.

Benefits
Heating aid ($300-$1,200/season) Weatherization Emergency fuel ($450 max)

VA Aid and Attendance (A&A) and Housebound Benefits

New Hampshire VA Aid and Attendance/Housebound

Age 65+ or disabled veteran/spouse
General NH resident, wartime service, need for ADL help (A&A) or homebound.
Income Limits (2025) Net income < ~$1,984/month (veteran with dependent, A&A); pension offsets income.
Asset Limits ~$155,356 net worth limit
NH

High veteran demand in rural/urban areas.

Benefits
Cash (~$1,433-$2,642/month veteran, ~$951-$1,318 spouse) for care costs (e.g., in-home, assisted living)

NH Low and Moderate Income Homeowners Property Tax Relief

New Hampshire Property Tax Relief

Age 65+ prioritized
General NH resident, homeowner, paid property taxes.
Income Limits (2025) ~$47,000/year (individual), ~$60,000/year (couple).
Asset Limits Not assessed; home value cap at $750,000.
NH

Refundable relief (~$100-$500/year); annual application.

Benefits
Tax relief (~$100-$500/year) to offset housing costs Indirectly aiding care funding

Frequently Asked Questions about Covered Bridge Manor

Is Covered Bridge Manor in a walkable area?

Covered Bridge Manor has a walk score of 8. Car-dependent. Most errands require a car, with limited nearby walkable options.

Is Covered Bridge Manor Medicare or Medicaid certified?

Yes — Covered Bridge Manor is a CMS-certified provider of Medicare and Medicaid.

Guides for Better Senior Living

Care Cost Calculator: See Prices in Your Area

Nursing Home Data Explorer

Don’t Wait Too Long: 7 Red Flag Signs Your Parent Needs Assisted Living Now

The True Cost of Assisted Living in 2025 – And How Families Are Paying For It

Understanding Senior Living Costs: Pricing Models, Discounts & Financial Assistance

Explore Open Rooms
1 Contact details
2 What type of senior care service are you looking for?
3 What budget do you have in mind for senior care?
4 How soon do you need to find care?
5 Additional details

Thank you for your interest!

Our team will be in touch shortly to help with next steps.