


Total staff
171
Employees
85
Contractors
86
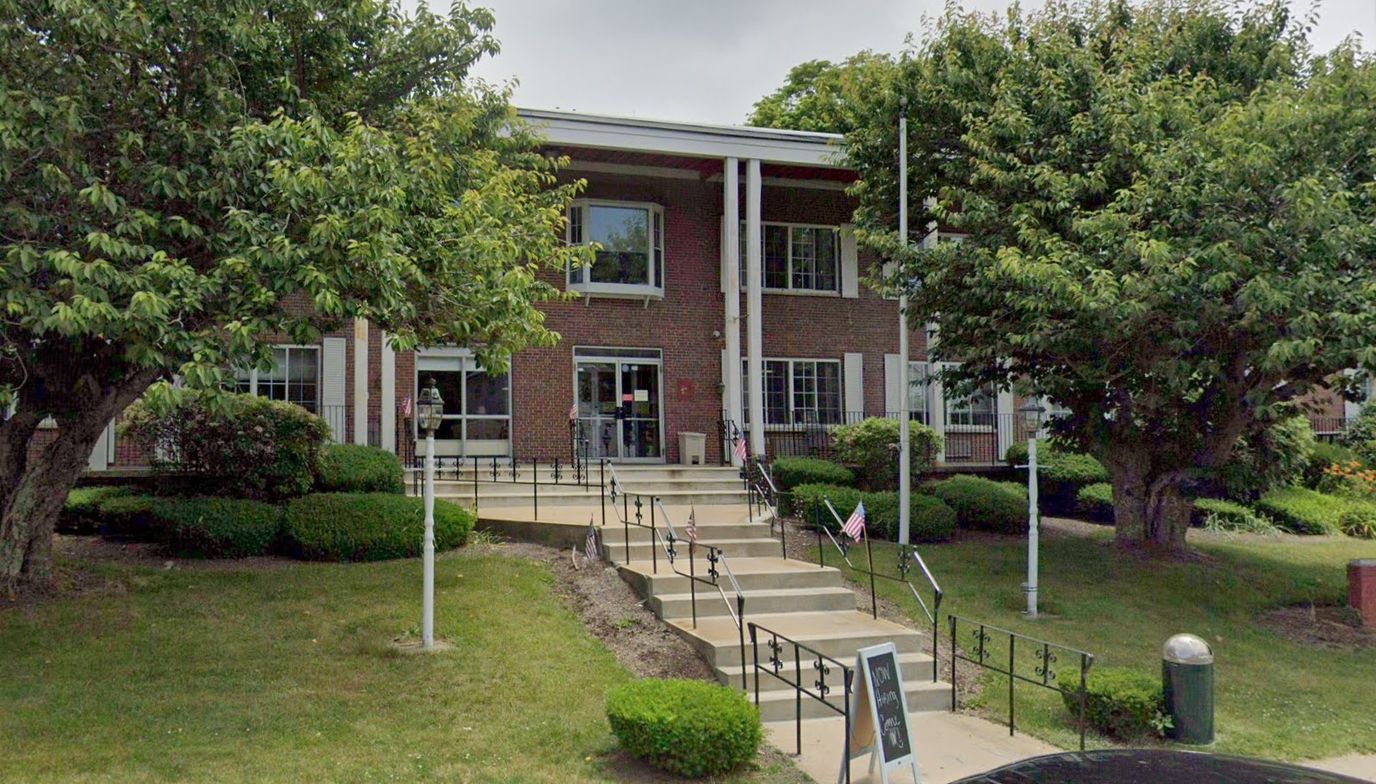

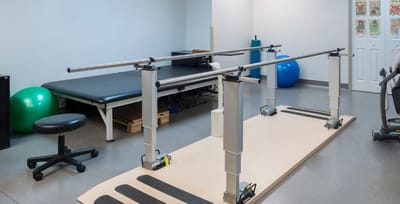
Located in Fall River, Massachusetts, Crawford Health and Rehabilitation Center is truly an exceptional assisted living service. What sets them apart is not only their unmatched offerings but also the dedicated team of friendly staff and professional caregivers who form the backbone of their high-quality services. With a focus on fast-track rehabilitation services and long-term care, Crawford Health and Rehabilitation Center senior living has become a favorite in the community, ensuring round-the-clock care and support for its residents.
At Crawford Health and Rehabilitation Center, residents experience a secure and comfortable environment, where their well-being is the top priority. The facility’s commitment to providing 24-hour care creates a sense of safety and peace of mind, making it a trusted choice for individuals seeking top-notch assisted living services in Fall River.
| Staff type | Hours / Day / Resident | vs state avg |
|---|---|---|
|
Registered Nurse (RN)
| 23m per day | ▼ 41% State avg: 39m per day · National avg: 41m per day |
|
LPN / LVN
| 53m per day | ▼ 7% State avg: 57m per day · National avg: 52m per day |
|
Nurse Aide
| 2h 6m per day | ▼ 7% State avg: 2h 16m per day · National avg: 2h 20m per day |
|
Weekend Total Nursing
| 3h 9m per day | ▼ 10% State avg: 3h 29m per day · National avg: 3h 27m per day |
|
Physical Therapist
| 1m per day | ▼ 68% State avg: 5m per day · National avg: 4m per day |
|
Weekend RN
| 16m per day | ▼ 43% State avg: 27m per day · National avg: 29m per day |
Reporting period: October 1 – December 31, 2025 (Q4 2025). Source: CMS Payroll-Based Journal report.
Manages medical care and health needs.
Assists with medical care and medications.
Helps with daily care and mobility.
Total hours from contractors
4,513 contractor hours this quarter
| Certified Nursing Assistant | 45 | 28 | 73 | 15,139 | 92 | 100% | 7.4 |
| Licensed Practical Nurse | 17 | 21 | 38 | 5,999 | 92 | 100% | 7.7 |
| Registered Nurse | 9 | 11 | 20 | 1,812 | 92 | 100% | 6.6 |
| Other Dietary Services Staff | 4 | 0 | 4 | 1,075 | 92 | 100% | 6.3 |
| Speech Language Pathologist | 0 | 4 | 4 | 518 | 81 | 88% | 4.8 |
| Clinical Nurse Specialist | 1 | 0 | 1 | 496 | 62 | 67% | 8 |
| Nurse Practitioner | 2 | 0 | 2 | 451 | 57 | 62% | 7.9 |
| Dietitian | 1 | 0 | 1 | 430 | 60 | 65% | 7.2 |
| Mental Health Service Worker | 1 | 0 | 1 | 426 | 56 | 61% | 7.6 |
| Physical Therapy Aide | 0 | 9 | 9 | 424 | 71 | 77% | 4.8 |
| RN Director of Nursing | 2 | 0 | 2 | 420 | 49 | 53% | 7.8 |
| Physical Therapy Assistant | 0 | 4 | 4 | 416 | 66 | 72% | 5.8 |
| Administrator | 1 | 0 | 1 | 416 | 54 | 59% | 7.7 |
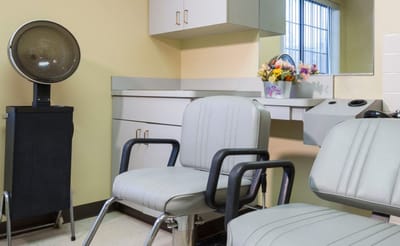
| Dental Services Staff | 1 | 0 | 1 | 340 | 61 | 66% | 5.6 |
| Feeding Assistant | 0 | 3 | 3 | 307 | 38 | 41% | 7.7 |
| Occupational Therapy Aide | 1 | 0 | 1 | 232 | 29 | 32% | 8 |
| Respiratory Therapy Technician | 0 | 2 | 2 | 174 | 38 | 41% | 4.6 |
| Medical Director | 0 | 1 | 1 | 110 | 22 | 24% | 5 |
| Diagnostic X-ray Services Staff | 0 | 1 | 1 | 84 | 14 | 15% | 6 |
| Other Physician | 0 | 1 | 1 | 48 | 12 | 13% | 4 |
| Occupational Therapy Assistant | 0 | 1 | 1 | 37 | 8 | 9% | 4.6 |
Includes penalties issued in 2023-2024
Federal penalties imposed by CMS for regulatory violations, including civil money penalties (fines) and denials of payment for new Medicare/Medicaid admissions.
Source: CMS Penalties Database (Data as of Jan 2026)
Massachusetts average: $72K
Massachusetts average: 1.7
Massachusetts average: 0.1
Penalties are imposed by CMS for violations of federal nursing home regulations.
5 penalties in the past 3 years
Multiple penalties were reported in the last 3 years.
Last updated: Jan 2026
These measures show how residents usually do over time at this home, based on health outcomes and preventive care.
Massachusetts average: 10.2
Massachusetts average: 20.0
Massachusetts average: 18.7%
Massachusetts average: 19.3%
Massachusetts average: 22.1%
Massachusetts average: 3.6%
Massachusetts average: 4.7%
Massachusetts average: 2.1%
Massachusetts average: 5.2%
Massachusetts average: 10.7%
Massachusetts average: 20.3%
Massachusetts average: 91.9%
Massachusetts average: 94.8%
Massachusetts average: 76.7%
Massachusetts average: 1.3%
Massachusetts average: 77.7%
Quality measures are calculated from Minimum Data Set (MDS) assessments. For most measures, lower percentages indicate better care quality.
77% of new residents, usually for short-term rehab.
16% of new residents, often for short stays.
7% of new residents, often for long-term daily care.
Source: CMS Long-Term Care Facility Characteristics (Data as of Jan 2026)
Residents meet regularly to discuss policies, care quality, and activities
Organized group of residents that meets regularly to discuss facility policies, quality of life, and activities.
Data sourced from CMS Long-Term Care Facility Characteristics quarterly report. Payer mix reflects the current resident census by primary payment source.
Historical financial and operational data for Crawford Health and Rehabilitation Center from 2012–2022, based on CMS SNF Cost Reports.
Key figures below are for fiscal year ending in 10/2022 — the home's most recent complete cost report, an older period than most facilities report.
Based on the home's most recent complete CMS SNF Cost Report — fiscal year ending in 10/2022. This is an older period than most facilities report, so compare with that in mind.
Pets Allowed
Building Type: Two-storey
Transportation Services
Fitness and Recreation
Most residents typically stay for a few weeks or months before returning home or moving on.
Most new residents arrive under Medicare (77% of admissions), and a typical Medicare stay runs around 22 days.
Coverage residents most often arrive under.
Coverage residents most often leave under.
![]() 1.6 miles from city center
1.6 miles from city center
![]() Estimated distance in miles from Fall River's city center to Crawford Health and Rehabilitation Center's address, calculated via Google Maps.
Estimated distance in miles from Fall River's city center to Crawford Health and Rehabilitation Center's address, calculated via Google Maps.
Add your location
Info below is compiled from CMS reports & the MA Executive Office of Elder Affairs, senior community websites & trusted data sources such as Walk Score & BBB.
Communities are listed from highest to lowest based on our ranking methodology.
| The Leonard Florence Center | NH ADC HOS MC PC RC SNF | Chelsea (Admirals Hill) | 100
Facility
100
MA AVG
94
Rank
#94 / 276 |
97.5%
Facility
97.5%
MA AVG
78.3
Rank
#2 / 81 | +25% | 4.76
Facility
4.76
MA AVG
3.93
Rank
#10 / 86 | 0% | +21% | $0
Facility
$0
MA AVG
$76.6k
Rank
#1 / 87 | 13
Facility
13
MA AVG
32.7
Rank
#16 / 86 | 4.3
Facility
4.3
MA AVG
7.2
Rank
#20 / 86 | - | 98 | - |
88
Facility
88
MA AVG
53
Rank
#63 / 498 | Adam Ernst | $20.6MFiscal year ending 12/2023
Facility
$20.6MFiscal year ending 12/2023
MA AVG
$17.4M
Rank
#26 / 89 | $14.3MFiscal year ending 12/2023
Facility
$14.3MFiscal year ending 12/2023
MA AVG
$6.5M
Rank
#16 / 89 | 69.6%Fiscal year ending 12/2023
Facility
69.6%Fiscal year ending 12/2023
MA AVG
43.6%
Rank
#27 / 89 | 225775 | ||||
| The Commons in Lincoln | NH AL IL MC SNF | Lincoln | 32
Facility
32
MA AVG
94
Rank
#268 / 276 |
89.7%
Facility
89.7%
MA AVG
78.3
Rank
#29 / 81 | +15% | 6.52
Facility
6.52
MA AVG
3.93
Rank
#3 / 86 | +11% | +66% | $0
Facility
$0
MA AVG
$76.6k
Rank
#1 / 87 | 7
Facility
7
MA AVG
32.7
Rank
#5 / 86 | 3.5
Facility
3.5
MA AVG
7.2
Rank
#11 / 86 | - | 29 | C- |
5
Facility
5
MA AVG
53
Rank
#485 / 498 | New England Life Plan Communities Corp | $4.7M*Fiscal year ending 12/2022These figures are from this home's most recent complete cost report — an older period than most facilities report. Compare with that in mind.
Facility
$4.7M*Fiscal year ending 12/2022These figures are from this home's most recent complete cost report — an older period than most facilities report. Compare with that in mind.
MA AVG
$17.4M
Rank
#87 / 89 | $12.2M*Fiscal year ending 12/2022These figures are from this home's most recent complete cost report — an older period than most facilities report. Compare with that in mind.
Facility
$12.2M*Fiscal year ending 12/2022These figures are from this home's most recent complete cost report — an older period than most facilities report. Compare with that in mind.
MA AVG
$6.5M
Rank
#26 / 89 | 258.6%*Fiscal year ending 12/2022These figures are from this home's most recent complete cost report — an older period than most facilities report. Compare with that in mind.
Facility
258.6%*Fiscal year ending 12/2022These figures are from this home's most recent complete cost report — an older period than most facilities report. Compare with that in mind.
MA AVG
43.6%
Rank
#1 / 89 | 225782 | ||||
| The Boston Home Inc | NH RC SNF | Dorchester Center (Dorchester) | 96
Facility
96
MA AVG
94
Rank
#108 / 276 |
97.0%
Facility
97.0%
MA AVG
78.3
Rank
#3 / 81 | +24% | 5.17
Facility
5.17
MA AVG
3.93
Rank
#7 / 86 | -18% | +32% | $0
Facility
$0
MA AVG
$76.6k
Rank
#1 / 87 | 8
Facility
8
MA AVG
32.7
Rank
#7 / 86 | 8.0
Facility
8.0
MA AVG
7.2
Rank
#57 / 86 | - | 93 | - |
76
Facility
76
MA AVG
53
Rank
#146 / 498 | Christine Reilly | $15.6MFiscal year ending 12/2023
Facility
$15.6MFiscal year ending 12/2023
MA AVG
$17.4M
Rank
#34 / 89 | $14.5MFiscal year ending 12/2023
Facility
$14.5MFiscal year ending 12/2023
MA AVG
$6.5M
Rank
#11 / 89 | 92.6%Fiscal year ending 12/2023
Facility
92.6%Fiscal year ending 12/2023
MA AVG
43.6%
Rank
#11 / 89 | 225434 | ||||
| South Cove Manor at Quincy Point Rehabilitation Center | NH PC RC SNF | Quincy (Quincy Point) | 141
Facility
141
MA AVG
94
Rank
#37 / 276 |
96.5%
Facility
96.5%
MA AVG
78.3
Rank
#4 / 81 | +23% | 3.77
Facility
3.77
MA AVG
3.93
Rank
#44 / 86 | +44% | -4% | $0
Facility
$0
MA AVG
$76.6k
Rank
#1 / 87 | 30
Facility
30
MA AVG
32.7
Rank
#47 / 86 | 10.0
Facility
10.0
MA AVG
7.2
Rank
#73 / 86 | - | 136 | - |
80
Facility
80
MA AVG
53
Rank
#119 / 498 | Marianne Bowler | $18.1MFiscal year ending 12/2023
Facility
$18.1MFiscal year ending 12/2023
MA AVG
$17.4M
Rank
#52 / 89 | $11.7MFiscal year ending 12/2023
Facility
$11.7MFiscal year ending 12/2023
MA AVG
$6.5M
Rank
#24 / 89 | 64.4%Fiscal year ending 12/2023
Facility
64.4%Fiscal year ending 12/2023
MA AVG
43.6%
Rank
#10 / 89 | 225514 | ||||
| Crawford Health and Rehabilitation Center | NH | Fall River (Oak Grove Village) | 112
Facility
112
MA AVG
94
Rank
#76 / 276 |
70.1%
Facility
70.1%
MA AVG
78.3
Rank
#62 / 81 | -10% | 3.96
Facility
3.96
MA AVG
3.93
Rank
#34 / 86 | -8% | +1% | $22.5k
Facility
$22.5k
MA AVG
$76.6k
Rank
#67 / 87 | 44
Facility
44
MA AVG
32.7
Rank
#70 / 86 | 11.0
Facility
11.0
MA AVG
7.2
Rank
#77 / 86 | - | 79 | - |
64
Facility
64
MA AVG
53
Rank
#198 / 498 | - | $8.8M*Fiscal year ending 10/2022These figures are from this home's most recent complete cost report — an older period than most facilities report. Compare with that in mind.
Facility
$8.8M*Fiscal year ending 10/2022These figures are from this home's most recent complete cost report — an older period than most facilities report. Compare with that in mind.
MA AVG
$17.4M
Rank
#61 / 89 | $6.1M*Fiscal year ending 10/2022These figures are from this home's most recent complete cost report — an older period than most facilities report. Compare with that in mind.
Facility
$6.1M*Fiscal year ending 10/2022These figures are from this home's most recent complete cost report — an older period than most facilities report. Compare with that in mind.
MA AVG
$6.5M
Rank
#75 / 89 | 68.5%*Fiscal year ending 10/2022These figures are from this home's most recent complete cost report — an older period than most facilities report. Compare with that in mind.
Facility
68.5%*Fiscal year ending 10/2022These figures are from this home's most recent complete cost report — an older period than most facilities report. Compare with that in mind.
MA AVG
43.6%
Rank
#74 / 89 | 225453 |
Crawford Health and Rehabilitation Center is in the Oak Grove Village neighborhood.
Crawford Health and Rehabilitation Center has a walk score of 64. Moderately walkable. Some errands can be accomplished on foot, with a mix of nearby amenities.
Crawford Health and Rehabilitation Center's occupancy is 77.6%.
Yes, Crawford Health and Rehabilitation Center allows residents to bring their pets.
Crawford Health and Rehabilitation Center is registered as a for-profit.
Yes — there are 4 photos of Crawford Health and Rehabilitation Center in the photo gallery on this page.
Crawford Health and Rehabilitation Center is located at 273 Oak Grove Ave, Fall River, MA 02723.
Care Cost Calculator: See Prices in Your Area
Nursing Home Data Explorer
Don’t Wait Too Long: 7 Red Flag Signs Your Parent Needs Assisted Living Now
The True Cost of Assisted Living in 2025 – And How Families Are Paying For It
Understanding Senior Living Costs: Pricing Models, Discounts & Financial Assistance


