Explore Open Rooms
1 Contact details
2 What type of senior care service are you looking for?
3 What budget do you have in mind for senior care?
4 How soon do you need to find care?
5 Additional details

Thank you for your interest!

Our team will be in touch shortly to help with next steps.

Nursing Home in Boston

CMS overall rating Info The Overall CMS Rating combines results from health inspections, staffing levels and quality measures. Health inspections carry the most weight. Staffing and quality scores can increase or decrease the final rating based on performance compared to state and national standards.

The Boston Home Inc

Overview of The Boston Home INC

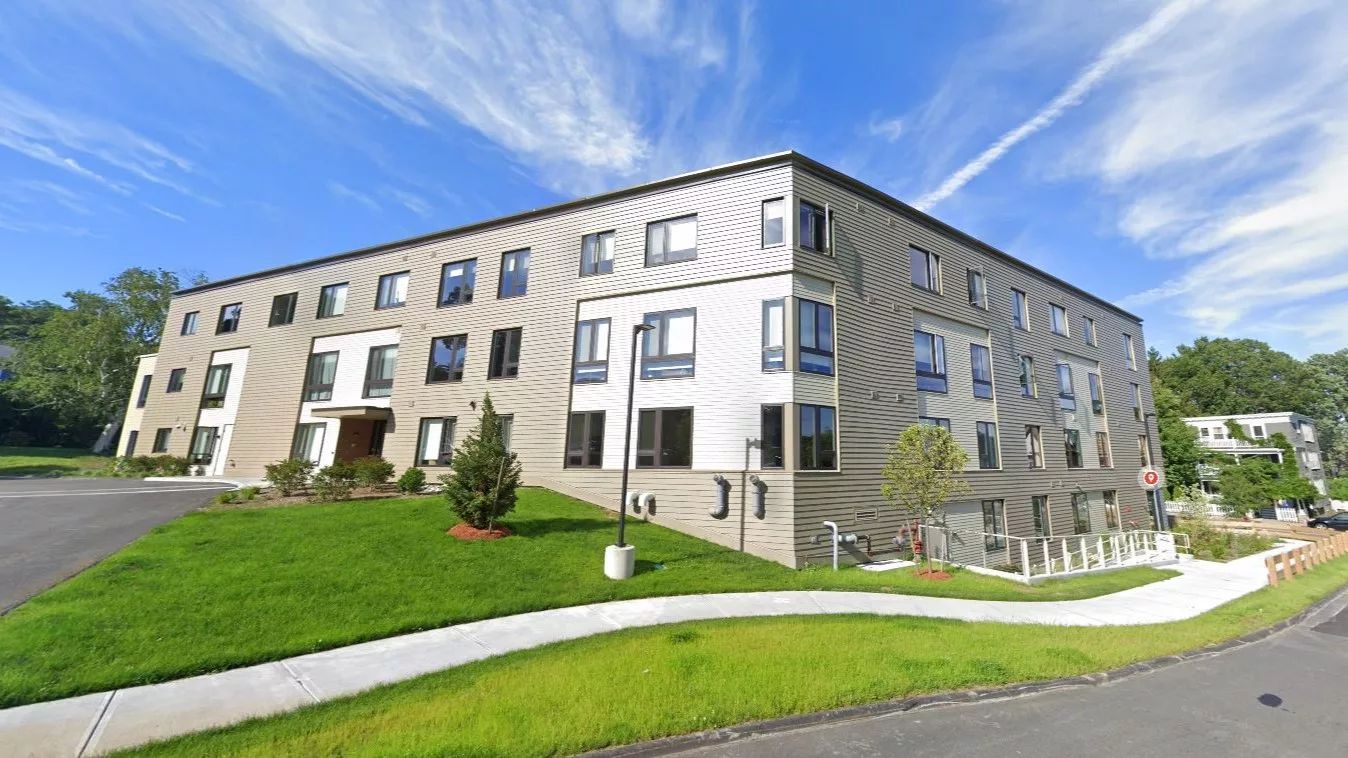
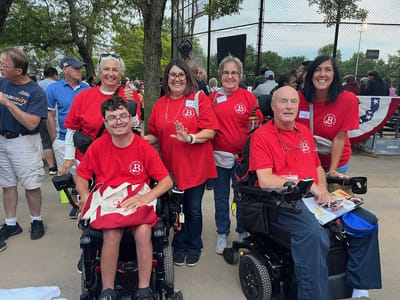
Considerably only one of its kind, The Boston home is the prime nursing home for seniors with progressive neurological disorders; they have been recognized as the ‘Center for Excellence in Long-Term Care’ by the National Multiple Sclerosis Society. The Boston Home prides itself in being one of the inspirations in the lives of its residents which have extended to the seniors’ families. 
The Boston Home has a list of exclusive programs and services that have make them special; naming a few of these include B.Fit! which is a health and wellness program to keep residents active; The Wheelchair Enhancement Program that focuses on the cost-effective solution to wheelchair users; their rehabilitation program that offers therapies, VitalStim neuromuscular electrical stimulation for swallowing, and an augmentative and alternative communication device assessments.

(617) 825-3905

Quality ratings

Measured by Centers for Medicare & Medicaid Services (CMS)

Overall rating Info The Overall CMS Rating combines results from health inspections, staffing levels and quality measures. Health inspections carry the most weight. Staffing and quality scores can increase or decrease the final rating based on performance compared to state and national standards.
5/5
Massachusetts average: 3.2/5
Health Inspection Info Based on the results of the facility's three most recent standard inspections and any complaint investigations. CMS reviews the number, scope, and severity of deficiencies, with more recent findings weighted more heavily.
5/5
Massachusetts average: 3.0/5
Staffing Info Measures average nursing staff hours per resident per day, including Registered Nurses (RNs) and total nursing staff. Ratings are adjusted based on the level of care residents require and are compared to state and national benchmarks.
5/5
Massachusetts average: 3.4/5
Quality Measures Info Based on clinical and physical health indicators reported to CMS, such as hospital readmissions, falls, pressure ulcers, and improvements in mobility. These measures reflect how well residents' health needs are being managed.
4/5
Massachusetts average: 3.3/5

Nursing care per resident

Info This shows how many total hours of nursing staff time are available per resident each day. Higher numbers usually mean more staff support.
5h 10m per day

This home provides 20% more nursing time per resident than the Massachusetts average.

Massachusetts average: 4h 18m per day

Staffing hours breakdown

Info Hours of care per resident per day, broken down by staff type. Data from CMS Medicare.
Staff type Facility State avg National avg
Registered Nurse (RN) Info Registered nurse hours per resident per day. 43m per day 39m per day 41m per day
Nurse Aide Info Nurse aide hours per resident per day. 4h 8m per day 2h 16m per day 2h 21m per day
Total Nursing (Weekend) Info Total number of nurse staff hours per resident per day on weekends. 5h 22m per day 3h 27m per day 3h 26m per day
Physical Therapist Info Physical therapist staff hours per resident per day. 2m per day 4m per day 4m per day
RN (Weekend) Info Registered nurse hours per resident per day on weekends. 37m per day 28m per day 29m per day

Capacity and availability

Smaller home

May offer a more intimate, personalized care environment.

Total beds 96

This home is often near full

That suggests steady demand, but availability may be limited.

Higher demand than most homes in Massachusetts
Occupancy rate 96.6%
Residents per day (avg) 94
Occupancy rate
96.6%
Residents per day (avg)
94

Who this home usually serves

TYPE OF STAY

Mostly long-term care residents

Most residents stay for extended periods and receive ongoing daily care.

Might be optimal for
Long-term daily care Ongoing support needs

Breakdown by payment type

Medicare

14% of new residents, usually for short-term rehab.

Typical stay 9 - 10 months

Private pay

14% of new residents, often for short stays.

Typical stay 2 - 3 years

Medicaid

71% of new residents, often for long-term daily care.

Typical stay 8 - 9 years

Finances and operations

Voluntary non-profit community
Home revenue
$23.1M
Surplus of revenue
$3.3M
Voluntary non-profit community
Home revenue
$23.1M
Surplus of revenue
$3.3M
Payroll costs Info The portion of the home's budget spent on staff, including nurses, caregivers, and other employees who support care and operations.
$12.3M
53.4% of revenue
Other operating costs Info All remaining costs needed to run the home, such as food, utilities, building maintenance, supplies and administrative expenses.
$7.5M
Total costs $19.9M
Walk Score
Walk Score: 76 / 100
Very walkable. Most errands can be accomplished on foot, and many essentials are within a short walk.

Additional Licensing Details

CMS Certification Number225434

Staffing

Key information about the people who lead and staff this community.

Leadership

ContactMs. Marva Serotkin, Manager

Contact The Boston Home Inc

Inspection History

In Massachusetts, the Executive Office of Elder Affairs (for assisted living facilities) and the Department of Public Health (for nursing homes) are the agencies authorized to inspect and report on facility safety.

4 visits/inspections

1 routine inspections

Results

1 with issues

3 without issues

Massachusetts average: 21 visits/inspections

Massachusetts average: 22 complaint visits

Massachusetts average: 4 inspections

Latest inspection

Date April 23, 2025
Plan Of Correction

8 deficiencies

Deficiencies indicate regulatory issues. A higher number implies the facility had several areas requiring improvement.

Massachusetts average: 28 deficiencies

Health Inspection History

Inspections
Total health inspections 1

Massachusetts average 4.5


Last Health inspection on Mar 2023

Total health citations 8

Massachusetts average 32.7

Citations per inspection
8

Massachusetts average 7.24


Health citations are formal notices following inspections when they fail to comply with safety and care standards.

All 8 citations resulted from standard inspections.

Breakdown of citation severity (last 3 years)
Critical Health citations More info 0
100% better than Massachusetts average

Massachusetts average: 0.3


Serious Health citations More info 0
100% better than Massachusetts average

Massachusetts average: 1.5

0 critical citations More info Massachusetts average: 0.3

0 serious citations More info Massachusetts average: 1.5

8 moderate citations More info Massachusetts average: 29.7

0 minor citations More info Massachusetts average: 1.3
Citations history (last 3 years)
Abuse/Neglect moderate citation Info Issues related to protecting resident's from harm, including abuse, neglect, or mistreatment. Mar 03, 2023
Corrected

Infection Control moderate citation Info Issues related to preventing and controlling infections, including hygiene practices and safety protocols. Mar 03, 2023
Corrected

Care Planning moderate citation Info Issues related to creating and updating personalized care plans for residents based on their needs and conditions. Mar 03, 2023
Corrected

Care Planning moderate citation Info Issues related to creating and updating personalized care plans for residents based on their needs and conditions. Mar 03, 2023
Corrected

Compare Nursing Homes around Boston The information below is reported by the Massachusetts Executive Office of Elder Affairs and Department of Public Health.

5 facilities compared · CMS & MA Dept. of Health data · Updated Apr 2026

Filter by care type
The Boston Home Inc
NH

Nursing Home Licensed facility providing 24/7 skilled nursing care for residents with complex, ongoing medical needs. Staffed by RNs, LPNs, and CNAs. Inspected and star-rated annually by CMS. Accepts Medicare (short-term rehab) and Medicaid (long-term care).

AL

Assisted Living A licensed, long-term care setting for seniors or individuals with disabilities who need help with daily activities — like bathing, dressing, and medication management — but not 24-hour skilled nursing. Offers housing, meals, and around-the-clock support while aiming to maximize resident independence.

Dorchester Center (Dorchester)
96
96.6%
+18%
5.17
-24%
+32%
0
8
8.0
0
94
-
76
Reilly, Christine
$15.8M
$12.3M
77.9%
225434
Edgar P. Benjamin Healthcare Center
NH

Nursing Home Licensed facility providing 24/7 skilled nursing care for residents with complex, ongoing medical needs. Staffed by RNs, LPNs, and CNAs. Inspected and star-rated annually by CMS. Accepts Medicare (short-term rehab) and Medicaid (long-term care).

AL

Assisted Living A licensed, long-term care setting for seniors or individuals with disabilities who need help with daily activities — like bathing, dressing, and medication management — but not 24-hour skilled nursing. Offers housing, meals, and around-the-clock support while aiming to maximize resident independence.

Boston (Mission Hill)
164
49.3%
-40%
3.45
+12%
-12%
1
32
5.3
2
82
-
82
Francis, Tony
$10.0M
$7.3M
73.3%
225654
Parkway Health & Rehabilitation Center
NH

Nursing Home Licensed facility providing 24/7 skilled nursing care for residents with complex, ongoing medical needs. Staffed by RNs, LPNs, and CNAs. Inspected and star-rated annually by CMS. Accepts Medicare (short-term rehab) and Medicaid (long-term care).

AL

Assisted Living A licensed, long-term care setting for seniors or individuals with disabilities who need help with daily activities — like bathing, dressing, and medication management — but not 24-hour skilled nursing. Offers housing, meals, and around-the-clock support while aiming to maximize resident independence.

West Roxbury (West Roxbury)
141
73.9%
-10%
3.20
+1%
-19%
4
94
8.6
5
129
-
54
Pourali, Saeed
$12.6M
$5.9M
46.6%
225497
Marian Manor Nursing Home
-
AL

Assisted Living A licensed, long-term care setting for seniors or individuals with disabilities who need help with daily activities — like bathing, dressing, and medication management — but not 24-hour skilled nursing. Offers housing, meals, and around-the-clock support while aiming to maximize resident independence.

IL

Independent Living Lifestyle-focused communities for older adults offering dining, activities, and transportation with minimal personal care. Best for active, independent seniors who want community without medical support.

MC

Memory Care Secured, specialized care for people living with Alzheimer's or dementia. Staff trained in cognitive impairment, with higher staff-to-resident ratios and an environment designed to reduce confusion and wandering risk.

NH

Nursing Home Licensed facility providing 24/7 skilled nursing care for residents with complex, ongoing medical needs. Staffed by RNs, LPNs, and CNAs. Inspected and star-rated annually by CMS. Accepts Medicare (short-term rehab) and Medicaid (long-term care).

Boston (South Boston)
248
60.7%
-26%
-
-
-
-
-
-
0
0
0.0
0
-
-
96
Anderson, Kahoney
$26.7M
$8.1M
30.2%
225415
North End Rehabilitation & Healthcare Center
-
NH

Nursing Home Licensed facility providing 24/7 skilled nursing care for residents with complex, ongoing medical needs. Staffed by RNs, LPNs, and CNAs. Inspected and star-rated annually by CMS. Accepts Medicare (short-term rehab) and Medicaid (long-term care).

AL

Assisted Living A licensed, long-term care setting for seniors or individuals with disabilities who need help with daily activities — like bathing, dressing, and medication management — but not 24-hour skilled nursing. Offers housing, meals, and around-the-clock support while aiming to maximize resident independence.

Boston
-
-
-
-
-
-
-
-
-
0
0
0.0
0
-
-
100
-
-
-
-
-

Places of interest near The Boston Home Inc

Address 0.8 miles from city center — 2.05 miles to nearest hospital (Beth Israel Deaconess Hospitalu2013Milton)

Calculate Travel Distance to The Boston Home Inc

Add your location

Address

Staffing Data (Q2 2025)

This data corresponds to Q2 2025 and is based on CMS Payroll-Based Journal.

Total staff 174
Employees 172
Contractors 2
Staff to resident ratio 1.81:1
7% better than Massachusetts average

Massachusetts average ratio: 1.70:1

Avg staff/day 81
Average shift 7.7 hours
0% compared with Massachusetts average

Massachusetts average: 7.9 hours

Total staff hours (quarter) 56,818
Nursing staff breakdown
Registered Nurse

Manages medical care and health needs.

Total count 17
Average shift length Info Average shift length. Calculated as total hours divided by days worked and average staff per day. 8.9 hours

No contractors work on this role.

Licensed Practical Nurse

Assists with medical care and medications.

Total count 19
Average shift length Info Average shift length. Calculated as total hours divided by days worked and average staff per day. 8.8 hours

No contractors work on this role.

Certified Nursing Assistant

Helps with daily care and mobility.

Total count 103
Average shift length Info Average shift length. Calculated as total hours divided by days worked and average staff per day. 7.4 hours

No contractors work on this role.

Contractor staffing

Total hours from contractors

0.4%

228 contractor hours this quarter

Occupational Therapy Aide: 1 Medical Director: 1
Staff by category
Certified Nursing Assistant103010336,25391100%7.4
Licensed Practical Nurse190196,89691100%8.8
Registered Nurse170174,29991100%8.9
RN Director of Nursing9092,06891100%7.6
Clinical Nurse Specialist4041,8566369%8
Other Dietary Services Staff7071,3938897%6.9
Physical Therapy Assistant3037106369%8.1
Administrator1014966268%8
Nurse Practitioner1014886167%8
Qualified Social Worker3034825965%7.8
Occupational Therapist1014405560%8
Dietitian1014245358%8
Therapeutic Recreation Specialist1014035459%7.5
Respiratory Therapy Technician1013043842%8
Occupational Therapy Aide0112242831%8
Speech Language Pathologist101772224%3.5
Medical Director011422%2
103 Certified Nursing Assistant
% of Days 100%
19 Licensed Practical Nurse
% of Days 100%
17 Registered Nurse
% of Days 100%
9 RN Director of Nursing
% of Days 100%
4 Clinical Nurse Specialist
% of Days 69%
7 Other Dietary Services Staff
% of Days 97%
3 Physical Therapy Assistant
% of Days 69%
1 Administrator
% of Days 68%
1 Nurse Practitioner
% of Days 67%
3 Qualified Social Worker
% of Days 65%
1 Occupational Therapist
% of Days 60%
1 Dietitian
% of Days 58%
1 Therapeutic Recreation Specialist
% of Days 59%
1 Respiratory Therapy Technician
% of Days 42%
1 Occupational Therapy Aide
% of Days 31%
1 Speech Language Pathologist
% of Days 24%
1 Medical Director
% of Days 2%

Facility Characteristics

Source: CMS Long-Term Care Facility Characteristics (Data as of Jan 2026)

Total census
96 residents
Residents by payment source
Medicare
1 resident (1%)
Medicaid
91 residents (94.8%)
Private pay or other
4 residents (4.2%)
Programs & Services
Residents' Group

Residents meet regularly to discuss policies, care quality, and activities

Active Resident Council

Organized group of residents that meets regularly to discuss facility policies, quality of life, and activities.

Quality of care over time

These measures show how residents usually do over time at this home, based on health outcomes and preventive care.

High-risk clinical events score Info A composite score based on pressure ulcers, falls with injury, weight loss, walking ability decline, and activities of daily living decline. 5.4
48% better than Massachusetts average

Massachusetts average: 10.2

Functional decline score Info A composite score based on activities of daily living decline, walking ability decline, and incontinence. 3.5
82% better than Massachusetts average

Massachusetts average: 20.0

Long-stay resident measures
Significantly above average Massachusetts avg: 3.5 Info CMS star rating based on long-stay quality measure performance. 5 stars = significantly above average, 1 star = significantly below average.
Need for Help with Daily Activities Increased Info Percent of long-stay residents whose need for help with daily activities has increased 6.1%
67% better than Massachusetts average

Massachusetts average: 18.7%

Low Risk Residents with Bowel/Bladder Incontinence Info Percent of low risk long-stay residents who lose control of their bowels or bladder 1.0%
96% better than Massachusetts average

Massachusetts average: 22.1%

Falls with Major Injury Info Percent of long-stay residents experiencing one or more falls with major injury 0.0%
100% better than Massachusetts average

Massachusetts average: 3.6%

High Risk Residents with Pressure Ulcers Info Percent of long-stay high risk residents with pressure ulcers 13.0%
180% worse than Massachusetts average

Massachusetts average: 4.7%

Urinary Tract Infection Info Percent of long-stay residents with a urinary tract infection 5.6%
171% worse than Massachusetts average

Massachusetts average: 2.1%

Lost Too Much Weight Info Percent of long-stay residents who lose too much weight 2.3%
56% better than Massachusetts average

Massachusetts average: 5.2%

Depressive Symptoms Info Percent of long-stay residents who have depressive symptoms 0.0%
100% better than Massachusetts average

Massachusetts average: 10.7%

Antipsychotic Use Info Percent of long-stay residents who received an antipsychotic medication 6.1%
70% better than Massachusetts average

Massachusetts average: 20.3%

Pneumococcal Vaccine Info Percent of long-stay residents assessed and appropriately given the pneumococcal vaccine 99.7%
8% better than Massachusetts average

Massachusetts average: 91.9%

Influenza Vaccine Info Percent of long-stay residents assessed and appropriately given the seasonal influenza vaccine 99.0%
In line with Massachusetts average

Massachusetts average: 94.8%

Hospitalizations per 1,000 days Info Number of hospitalizations per 1,000 long-stay resident days. 1.98
6% worse than Massachusetts average

Massachusetts average: 1.86

ED visits per 1,000 days Info Number of outpatient emergency department visits per 1,000 long-stay resident days. 0.64
58% better than Massachusetts average

Massachusetts average: 1.54

Short-stay resident measures
Average Massachusetts avg: 3.4 Info CMS star rating based on short-stay quality measure performance. 5 stars = much above average, 1 star = much below average.
Re-hospitalized after SNF stay Info Percentage of short-stay residents who were re-hospitalized after their nursing home admission. 26.6%
In line with Massachusetts average

Massachusetts average: 25.8%

Emergency department visits Info Percentage of short-stay residents who had an outpatient emergency department visit. 4.3%
64% better than Massachusetts average

Massachusetts average: 11.8%

Falls with major injury Info Percentage of SNF residents who experience falls with major injury during their stay. 0.0%
100% better than Massachusetts average

Massachusetts average: 0.8%

Ability to care for self at discharge Info Percentage of residents at or above expected ability to care for themselves at discharge. 35.0%
35% worse than Massachusetts average

Massachusetts average: 53.7%

Guides for Better Senior Living

Care Cost Calculator: See Prices in Your Area

Nursing Home Data Explorer

Don’t Wait Too Long: 7 Red Flag Signs Your Parent Needs Assisted Living Now

The True Cost of Assisted Living in 2025 – And How Families Are Paying For It

Understanding Senior Living Costs: Pricing Models, Discounts & Financial Assistance

Financial Aid for Massachusetts Seniors

Get financial aid guidance

Home Care Program

MassHealth Home Care

Age 60+, Massachusetts resident, at risk of nursing home placement.

~$1,500/month (individual, varies by region).

$2,000 (individual, excludes home, car).

Coordinated through Aging Services Access Points (ASAPs); high demand in urban areas.

Frail Elder Waiver

Massachusetts Medicaid FE Waiver

Age 65+, Massachusetts resident, Medicaid-eligible, nursing home-level care need.

~$2,829/month (300% FBR, individual).

$2,000 (individual), $3,000 (couple).

Requires clinical eligibility determination.

Senior Care Options (SCO)

Massachusetts Senior Care Options

Age 65+, Massachusetts resident, eligible for MassHealth (Medicare optional), nursing home-level care need.

~$2,829/month (300% FBR, individual); QIT allowed.

$2,000 (individual), $3,000 (couple) (excludes home up to $713,000, car).

Not available in Dukes/Nantucket Counties; multiple SCO providers (e.g., CCA, Tufts).

Medicare Savings Program (MSP)

Massachusetts Medicare Savings Program (MassHealth Buy-In)

Age 65+ or disabled, Massachusetts resident, Medicare Part A/B.

~$2,510/month (QMB), ~$3,380/month (SLMB), ~$3,598/month (QI)—individual.

$9,430 (individual), $14,130 (couple).

Three tiers; no waitlist; includes Extra Help for Part D.

National Family Caregiver Support Program (NFCSP) Respite

Massachusetts NFCSP Respite Care

Caregivers of 60+ needing care or 55+ caregivers of others; Massachusetts resident; functional needs (2+ ADLs).

Prioritizes ~$24,980/year (individual); no strict cap.

Not assessed; need-based.

27 ASAPs; prioritizes low-income, rural caregivers.

Prescription Advantage

Massachusetts Prescription Advantage

Age 65+ or disabled, Massachusetts resident, enrolled in Medicare Part D (or ineligible for Medicare).

No strict limit; copays vary by income (~$24,980-$75,000/year individual).

Not assessed.

Supplements Medicare Part D; no enrollment fee for low-income.

Senior Community Service Employment Program (SCSEP)

Massachusetts SCSEP

Age 55+, unemployed, low-income, Massachusetts resident.

~$1,983/month (125% FPL).

Not specified; income-focused.

Priority for veterans, rural residents; AARP partnership.

VA Aid and Attendance (A&A) and Housebound Benefits

Massachusetts VA Aid and Attendance/Housebound

Age 65+ or disabled veteran/spouse, Massachusetts resident, wartime service, need for ADL help (A&A) or homebound.

Net income < ~$1,984/month (veteran with dependent, A&A); pension offsets income.

~$155,356 (net worth limit).

High veteran demand statewide.

Tour Icon
Planning a tour? Check our touring checklist.
Chat Icon
Thinking of living here? We can help you speak to a current resident