Cypress Square
Nursing Home & Assisted Living · South Carolina, SC
CMS overall rating Info The Overall CMS Rating is scored from 1 to 5 stars and combines results from health inspections, staffing levels, and quality measures. Health inspections carry the most weight. Staffing and quality scores can increase or decrease the final rating based on performance compared to state and national standards.

Cypress Square

Nursing Home & Assisted Living · South Carolina, SC
CMS overall rating Info The Overall CMS Rating is scored from 1 to 5 stars and combines results from health inspections, staffing levels, and quality measures. Health inspections carry the most weight. Staffing and quality scores can increase or decrease the final rating based on performance compared to state and national standards.
Calculator: See prices in your area
Cypress Square accepts Medicare, Medicaid, and private pay.

Overview of Cypress Square

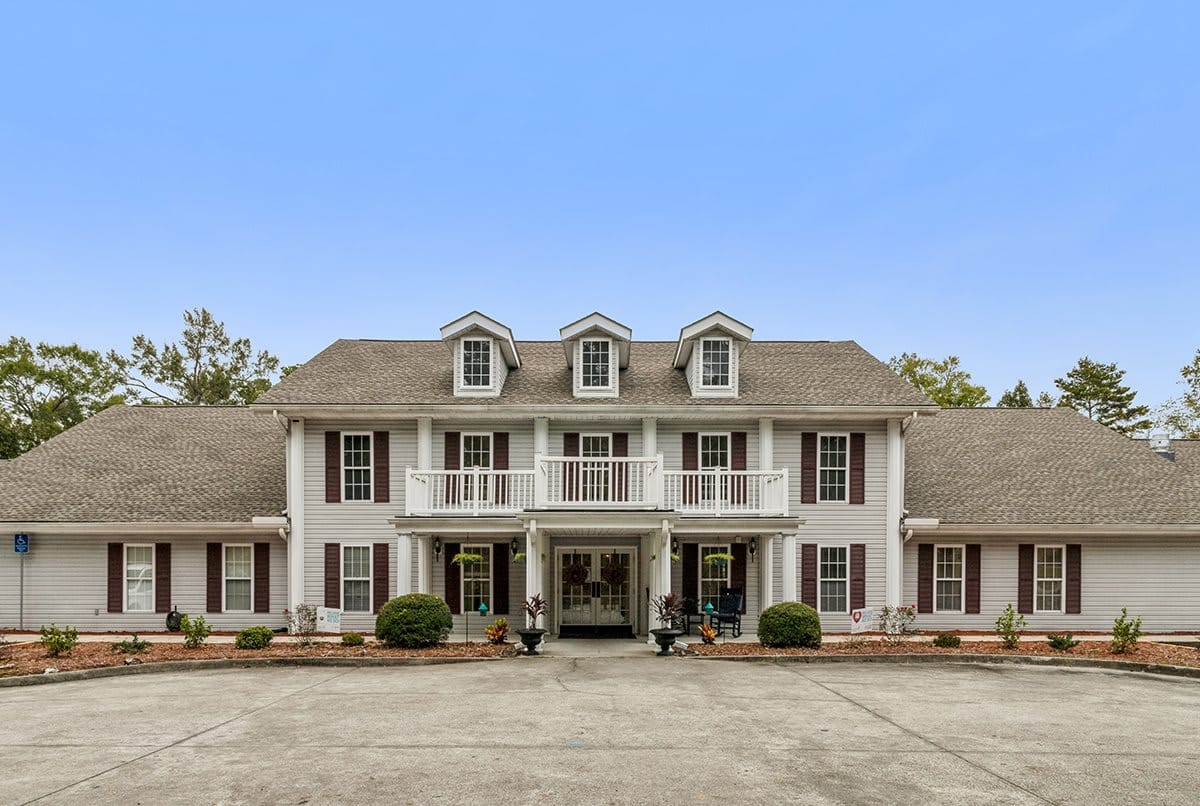
Nestled in the vibrant community of Summerville, SC, the Cypress Square is a stunning senior living community providing assisted living services. A wide range of well-appointed and spacious accommodations including one-bedroom and studio are available. Having a trained and dedicated team, this community offers an emergency response team and round-the-clock personalized care services.

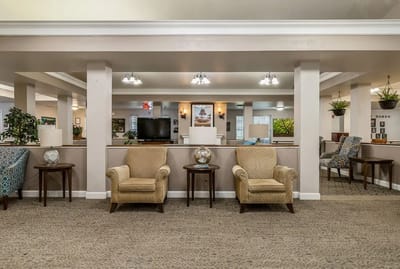
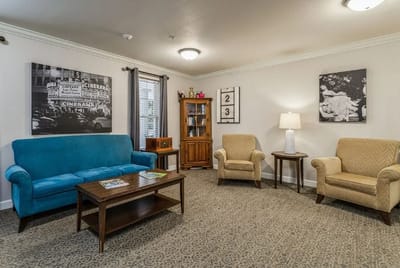
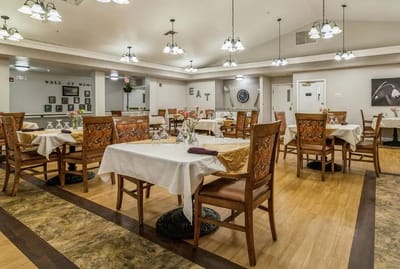
True to its goal of promoting a perfect balance between personal freedom and intentional care, residents can enjoy weekly housekeeping and laundry services, in-house maintenance services, and free transportation to all professional services. Experience delicious dining with delightful meals and snacks every day. Engage in diverse social activities and community events. Explore other beautiful spaces such as the illuminated entryways. Equipped with the right tools and people, seniors can never go wrong with Cypress Square.

(843) 875-7163

Quality ratings

Measured by Centers for Medicare & Medicaid Services (CMS)

Overall rating Info The Overall CMS Rating combines results from health inspections, staffing levels and quality measures. Health inspections carry the most weight. Staffing and quality scores can increase or decrease the final rating based on performance compared to state and national standards.
▼ 31.7% Below SC avg. ▼ 31.7% Below SC avg.Click the badge to see the full State ranking.Click here to see the full State ranking.
Health Inspection Info Based on the results of the facility's three most recent standard inspections and any complaint investigations. CMS reviews the number, scope, and severity of deficiencies, with more recent findings weighted more heavily.
▼ 27.3% Below SC avg. ▼ 27.3% Below SC avg.Click the badge to see the full State ranking.Click here to see the full State ranking.
Staffing Info Measures average nursing staff hours per resident per day, including Registered Nurses (RNs) and total nursing staff. Ratings are adjusted based on the level of care residents require and are compared to state and national benchmarks.
▼ 32.2% Below SC avg. ▼ 32.2% Below SC avg.Click the badge to see the full State ranking.Click here to see the full State ranking.
Quality Measures Info Based on clinical and physical health indicators reported to CMS, such as hospital readmissions, falls, pressure ulcers, and improvements in mobility. These measures reflect how well residents' health needs are being managed.
▼ 14.0% Below SC avg. ▼ 14.0% Below SC avg.Click the badge to see the full State ranking.Click here to see the full State ranking.

Staffing hours breakdown

Info Daily nursing hours per resident by staff type, reported to CMS. Higher is generally better — compare this facility to state and national averages to see where staffing stands.

Hours per resident per day — compared to South Carolina state averages

Total nursing care / resident Info This home is ranked 105th out of 112 homes in South Carolina. Total adjusted nursing hours per resident per day, combining RN, LPN, and aide time. CMS adjusts this for case-mix so facilities can be fairly compared.
2h 58m per day
Rank #105 / 112Nurse hours — State benchmarkedThis home is ranked 105th out of 112 homes in South Carolina. Shows adjusted nurse hours per resident per day benchmarked to the South Carolina average, with a ranking across 112 South Carolina SNFs. More hours mean more direct care. The national average is about 3.5 hrs; below 3.0 is a red flag.Click the rank badge to see the full State ranking.Click here to see the full State ranking.
This facility South Carolina avg (4h 5m per day)
vs South Carolina avg
-27%
Staff typeHours / Day / Residentvs state avg
Weekend Total Nursing Info Combined nursing hours (RN + LPN + Nurse Aide) per resident per day on weekends. Staffing often drops on weekends — this figure reveals whether the facility maintains adequate coverage outside of weekday hours. 2h 38m per day

Types of Care at Cypress Square

Assisted Living

Capacity and availability

This home usually has limited availability

Occupancy between 85% and 95% suggests balanced demand.

Higher occupancy than the South Carolina average: 82.1%
Occupancy rate 89.2% Rank #38 / 121Occupancy rate — State benchmarkedThis home is ranked 38th out of 121 homes in South Carolina. Shows this facility's occupancy rate versus the South Carolina average, with its Statewide rank out of 121. Higher occupancy signals strong local demand and financial stability.Click the rank badge to see the full State ranking.Click here to see the full State ranking.
Avg. Length of Stay 191 days
Occupancy rate
89.2% Rank #38 / 121Occupancy rate — State benchmarkedThis home is ranked 38th out of 121 homes in South Carolina. Shows this facility's occupancy rate versus the South Carolina average, with its Statewide rank out of 121. Higher occupancy signals strong local demand and financial stability.Click the rank badge to see the full State ranking.Click here to see the full State ranking.
Avg. Length of Stay
191 days
Bed community size
44-bed community Rank #274 / 312Bed count — State benchmarkedThis home is ranked 274th out of 312 homes in South Carolina. Shows this facility's certified or reported bed count compared to other South Carolina SNFs. Larger communities may offer more amenities, programs, and on-site services for residents and families.Click the rank badge to see the full State ranking.Click here to see the full State ranking.
A moderately sized community that may balance personal attention with shared amenities and social activities.
Walk Score
Walk Score: 52 / 100 Rank #40 / 232Walk Score — State benchmarkedThis home is ranked 40th out of 232 homes in South Carolina. Shows how walkable this facility's neighborhood is compared to the average Walk Score across South Carolina SNFs. Higher scores benefit residents, families, and staff.Click the rank badge to see the full State ranking.Click here to see the full State ranking.
Moderately walkable. Some errands can be accomplished on foot, with a mix of nearby amenities.

About this community

License Details

Facility TypeCommunity Residential Care Facilities
StatusActive
ExpirationJune 30, 2026
CountyDorchester
License NumberCRC-2311

Ownership & Operating Entity

Cypress Square is legally operated by Summerville Al Llc, and administrated by Johanna Hooley.

Ownership TypeLimited Liability

Memory & Specialized Care

2 services
Does not offer Alzheimer's Care
No dedicated Alzheimer's unit

Contact Information

Contact Cypress Square

Health Inspection History

Inspections since 2023
Total health inspections 3

South Carolina average 3.9


Last Health inspection on Mar 2025

Total health citations
16 Rank #79 / 113Health citations — State benchmarkedThis home is ranked 79th out of 113 homes in South Carolina. Shows this facility's total health deficiency citations benchmarked to the South Carolina State average, with a ranking across all 113 SC SNFs. Lower citation counts earn a better rank.Click the rank badge to see the full State ranking.Click here to see the full State ranking.

South Carolina average 13.7

Citations per inspection
5.33 Rank #102 / 113Citations per inspection — State benchmarkedThis home is ranked 102nd out of 113 homes in South Carolina. Shows average deficiency citations per CMS inspection for this facility versus the South Carolina mean across 113 SNFs with citation data. Lower is better.Click the rank badge to see the full State ranking.Click here to see the full State ranking.

South Carolina average 3.44


Health citations are formal notices following inspections when they fail to comply with safety and care standards.

15 of 16 citations resulted from standard inspections; and 1 of 16 resulted from complaint investigations.

Breakdown of citation severity (last 3 years)
Critical health citations
0
100% better than South Carolina average

South Carolina average: 1


Serious health citations
0
100% better than South Carolina average

South Carolina average: 0.3

0 critical citations South Carolina average: 1

0 serious citations South Carolina average: 0.3

16 moderate citations South Carolina average: 12.3

0 minor citations South Carolina average: 0.1
Citations history (last 3 years)
Environmental moderate citation Mar 25, 2025
Corrected

Infection Control moderate citation Mar 25, 2025
Corrected

Pharmacy moderate citation Mar 25, 2025
Corrected

Pharmacy moderate citation Mar 25, 2025
Corrected

Staffing Data

Reporting period: October 1 – December 31, 2025 (Q4 2025). Source: CMS Payroll-Based Journal report.

Total staff 193
Employees 90
Contractors 103
Staff to resident ratio 2.24:1
22% better than South Carolina average
South Carolina average ratio: 1.84:1 South Carolina average ratio: 1.84:1See full South Carolina ranking
Avg staff/day 42
Average shift 7.4 hours
6% worse than South Carolina average
South Carolina average: 7.9 hours South Carolina average shift: 7.9 hoursSee full South Carolina ranking
Total staff hours (quarter) 28,763

Nursing staff breakdown

Q4 2025 · Oct 1 – Dec 31 More info This data comes from the CMS Payroll-Based Journal report covering October 1 – December 31, 2025.
Registered Nurse

Manages medical care and health needs.

RN Staff 11
Average shift length Info Average shift length. Calculated as total hours divided by days worked and average staff per day. 8 hours

This role is partially covered by contractors.

Licensed Practical Nurse

Assists with medical care and medications.

LPN Staff 46
Average shift length Info Average shift length. Calculated as total hours divided by days worked and average staff per day. 8.2 hours

This role is partially covered by contractors.

Certified Nursing Assistant

Helps with daily care and mobility.

CNA Staff 95
Average shift length Info Average shift length. Calculated as total hours divided by days worked and average staff per day. 7.2 hours

This role is partially covered by contractors.

Contractor staffing

Q4 2025 · Oct 1 – Dec 31 More info This data comes from the CMS Payroll-Based Journal report covering October 1 – December 31, 2025.

Total hours from contractors

17.9%

5,142 contractor hours this quarter

Certified Nursing Assistant: 62 Licensed Practical Nurse: 17 Speech Language Pathologist: 6 Qualified Social Worker: 6 Respiratory Therapy Technician: 5 Physical Therapy Aide: 4 Physical Therapy Assistant: 2 Registered Nurse: 1

Staff by category

Q4 2025 · Oct 1 – Dec 31 More info This data comes from the CMS Payroll-Based Journal report covering October 1 – December 31, 2025.
Certified Nursing Assistant33629513,47192100%7.2
Licensed Practical Nurse2917466,59392100%8.2
Registered Nurse101111,7528896%8
Clinical Nurse Specialist3039796267%8
Other Dietary Services Staff7077727885%7
Qualified Social Worker0666627379%6.8
Speech Language Pathologist0665756874%5.9
RN Director of Nursing3035355863%7.8
Physical Therapy Aide0445076470%7.1
Dietitian1014876166%8
Dental Services Staff1014866166%8
Mental Health Service Worker1014706267%7.6
Administrator1014565762%8
Nurse Practitioner1014485661%8
Physical Therapy Assistant0223496975%5
Respiratory Therapy Technician0552204145%4.6
95 Certified Nursing Assistant
% of Days 100%
46 Licensed Practical Nurse
% of Days 100%
11 Registered Nurse
% of Days 96%
3 Clinical Nurse Specialist
% of Days 67%
7 Other Dietary Services Staff
% of Days 85%
6 Qualified Social Worker
% of Days 79%
6 Speech Language Pathologist
% of Days 74%
3 RN Director of Nursing
% of Days 63%
4 Physical Therapy Aide
% of Days 70%
1 Dietitian
% of Days 66%
1 Dental Services Staff
% of Days 66%
1 Mental Health Service Worker
% of Days 67%
1 Administrator
% of Days 62%
1 Nurse Practitioner
% of Days 61%
2 Physical Therapy Assistant
% of Days 75%
5 Respiratory Therapy Technician
% of Days 45%

Penalties and fines

Federal penalties imposed by CMS for regulatory violations, including civil money penalties (fines) and denials of payment for new Medicare/Medicaid admissions.

Source: CMS Penalties Database

No penalties in the past 3 years

No civil money penalties or payment denials were reported in the last 3 years.

Quality of care over time

These measures show how residents usually do over time at this home, based on health outcomes and preventive care.

High-risk clinical events score Info A composite score based on pressure ulcers, falls with injury, weight loss, walking ability decline, and activities of daily living decline. 11.9
37% worse than South Carolina average

South Carolina average: 8.7

Functional decline score Info A composite score based on activities of daily living decline, walking ability decline, and incontinence. 21.3
37% worse than South Carolina average

South Carolina average: 15.5

Long-stay resident measures
Need for Help with Daily Activities Increased Info Percent of long-stay residents whose need for help with daily activities has increased 20.3%
55% worse than South Carolina average

South Carolina average: 13.1%

Walking Ability Worsened Info Percent of long-stay residents whose ability to move independently worsened 27.3%
68% worse than South Carolina average

South Carolina average: 16.2%

Low Risk Residents with Bowel/Bladder Incontinence Info Percent of low risk long-stay residents who lose control of their bowels or bladder 16.2%
5% better than South Carolina average

South Carolina average: 17.0%

Falls with Major Injury Info Percent of long-stay residents experiencing one or more falls with major injury 2.0%
32% better than South Carolina average

South Carolina average: 3.0%

High Risk Residents with Pressure Ulcers Info Percent of long-stay high risk residents with pressure ulcers 6.7%
9% worse than South Carolina average

South Carolina average: 6.1%

Urinary Tract Infection Info Percent of long-stay residents with a urinary tract infection 0.0%
100% better than South Carolina average

South Carolina average: 1.6%

Lost Too Much Weight Info Percent of long-stay residents who lose too much weight 3.4%
45% better than South Carolina average

South Carolina average: 6.2%

Depressive Symptoms Info Percent of long-stay residents who have depressive symptoms 2.2%
19% better than South Carolina average

South Carolina average: 2.8%

Antipsychotic Use Info Percent of long-stay residents who received an antipsychotic medication 21.3%
46% worse than South Carolina average

South Carolina average: 14.5%

Pneumococcal Vaccine Info Percent of long-stay residents assessed and appropriately given the pneumococcal vaccine 69.9%
23% worse than South Carolina average

South Carolina average: 90.5%

Influenza Vaccine Info Percent of long-stay residents assessed and appropriately given the seasonal influenza vaccine 93.5%
In line with South Carolina average

South Carolina average: 90.6%

Short-stay resident measures
Pneumococcal Vaccine Info Percent of short-stay residents assessed and appropriately given the pneumococcal vaccine 75.1%
6% worse than South Carolina average

South Carolina average: 79.5%

Antipsychotic medication increase Info Percent of short-stay residents who newly received an antipsychotic medication 0.6%
65% better than South Carolina average

South Carolina average: 1.7%

Influenza Vaccine Info Percent of short-stay residents assessed and appropriately given the seasonal influenza vaccine 77.2%
In line with South Carolina average

South Carolina average: 78.0%

Breakdown by payment type

Medicare

61% of new residents, usually for short-term rehab.

Typical stay 2 months

Private pay

29% of new residents, often for short stays.

Typical stay 3 - 4 months

Medicaid

10% of new residents, often for long-term daily care.

Typical stay 4 years

Facility Characteristics

Source: CMS Long-Term Care Facility Characteristics (Data as of Jan 2026)

Total residents 86
Medicare
12
14% of residents
Medicaid
62
72.1% of residents
Private pay or other
12
14% of residents
Programs & Services
Residents Group

Residents meet regularly to discuss policies, care quality, and activities

Active Resident Council

Organized group of residents that meets regularly to discuss facility policies, quality of life, and activities.

Finances and operations

Privately-owned community
Home revenue
$11.6M
Profit
$171.7K
Privately-owned community
Home revenue
$11.6M Rank #73 / 116Revenue — State benchmarkedThis home is ranked 73rd out of 116 homes in South Carolina. Shows this facility's annual revenue compared to the South Carolina SNF average. Higher revenue generally means more resources for staffing and capital — read alongside Payroll %.Click the rank badge to see the full State ranking.Click here to see the full State ranking.
Profit
$171.7K
Payroll costs Info The portion of the home's budget spent on staff, including nurses, caregivers, and other employees who support care and operations. Rank #82 / 116Payroll — State benchmarkedThis home is ranked 82nd out of 116 homes in South Carolina. Shows total annual staff payroll benchmarked to the South Carolina average. Higher payroll investment relative to peers often signals better staffing and less reliance on cheaper contract labor.Click the rank badge to see the full State ranking.Click here to see the full State ranking.
$5.1M
44.3% of revenue Rank #77 / 116Payroll % — State benchmarkedThis home is ranked 77th out of 116 homes in South Carolina. Shows payroll as a percentage of revenue versus the South Carolina average. Well-run South Carolina SNFs typically land around 53–64% — the top third Statewide. Below 25% may signal understaffing or heavy agency use — read with Staffing ratings.Click the rank badge to see the full State ranking.Click here to see the full State ranking.
Other operating costs Info All remaining costs needed to run the home, such as food, utilities, building maintenance, supplies and administrative expenses.
$6.3M
Total costs $11.4M

What does this home offer?

Pets allowed icon
Pets allowed icon

Pets Allowed

Housing options icon

Housing Options: Studio / 1 Bed

Building type icon
Building type icon

Building Type: 2-story

Transportation services icon

Transportation Services

Fitness and recreation icon

Fitness and Recreation

Who this home usually serves

TYPE OF STAY

Mostly short-term rehab stays

Most residents typically stay for a few weeks or months before returning home or moving on.

Places of interest near Cypress Square

Address 4.6 miles from city center Info Estimated distance in miles from Summerville's city center to Cypress Square's address, calculated via Google Maps.

Calculate Travel Distance to Cypress Square

Add your location

Address

Financial Assistance for
Nursing Home in South Carolina

Cypress Square is located in Summerville, South Carolina.
Here are the financial assistance programs available to residents in South Carolina.

Get Financial aid guidance

Community Long Term Care (CLTC)

SC Medicaid CLTC

Age 65+ or disabled
General South Carolina resident, Medicaid-eligible, nursing home-level care need.
Income Limits (2025) ~$2,829/month 300% FBR, individual
Asset Limits $2,000 (individual), $3,000 (couple).
SC

High rural demand; waitlists possible.

Benefits
Personal care (5-7 hours/day) Respite (240 hours/year) Adult day care ($60/day) Home modifications ($1,500 avg.)

South Carolina Respite Care Program

SC NFCSP Respite

Age Caregiver of someone 60+ (or with dementia)
General South Carolina resident.
Income Limits No strict limit; prioritizes low-income.
Asset Limits Not applicable.
SC

Limited slots; rural/urban balance.

Benefits
In-home respite (4-6 hours/day) Adult day care (~$60/day) Short-term facility care (up to 5 days)

Medicare Savings Program (MSP)

South Carolina Medicare Savings Program

Age 65+ or disabled
General SC resident, Medicare Part A/B.
Income Limits (2025) ~$2,510/month (QMB), ~$3,380/month (SLMB), ~$3,598/month (QI)—individual.
Asset Limits $9,430 (individual), $14,130 (couple).
SC

Three tiers; includes Extra Help for Part D; no waitlist.

Benefits
Covers Part B premiums ($174.70/month) Deductibles ($240/year) Copays (~20%)

VA Aid and Attendance (A&A) and Housebound Benefits

South Carolina VA Aid and Attendance/Housebound

Age 65+ or disabled veteran/spouse
General SC resident, wartime service, need for ADL help (A&A) or homebound.
Income Limits (2025) Net income < ~$1,984/month (veteran with dependent, A&A); pension offsets income.
Asset Limits ~$155,356 net worth limit
SC

High veteran population; supports rural/urban care needs.

Benefits
Cash (~$1,433-$2,642/month veteran, ~$951-$1,318 spouse) for care costs (e.g., in-home, assisted living)

Senior Farmers’ Market Nutrition Program (SFMNP)

South Carolina SFMNP

Age 60+
General SC resident, low-income.
Income Limits (2025) ~$2,322/month individual, 185% FPL
Asset Limits Not assessed.
SC

Vouchers (~$50/season); serves ~20,000 annually via 10 AAAs.

Benefits
Vouchers (~$50/season) for fresh produce at approved markets

Homestead Exemption Program

South Carolina Homestead Exemption

Age 65+ (or disabled/blind)
General SC resident 1+ year, homeowner.
Income Limits (2025) None; tax-based eligibility.
Asset Limits Not assessed; home-focused.
SC

Saves ~$500-$1,000/year avg.; applies to primary residence.

Benefits
Property tax exemption (~$50,000 value, ~$500-$1,000/year savings)

Elderly Simplified Application Project (ESAP)

South Carolina ESAP (SNAP for Seniors)

Age 60+
General SC resident, no earned income, not on SCCAP.
Income Limits (2025) ~$1,732/month 133% FPL, individual
Asset Limits $4,250 individual, higher than standard SNAP
SC

Simplified process; serves ~50,000 seniors annually.

Benefits
EBT card for food (~$100-$300/month based on income)

Frequently Asked Questions about Cypress Square

Who is the owner of Cypress Square?

The legal owner and operator of Cypress Square is Summerville Al Llc.

Is Cypress Square in a walkable area?

Cypress Square has a walk score of 52. Moderately walkable. Some errands can be accomplished on foot, with a mix of nearby amenities.

What is the license number of Cypress Square?

According to SC state health department records, Cypress Square's license number is CRC-2311.

When does Cypress Square's license expire?

According to SC state health department records, Cypress Square's license expires on June 30, 2026.

What is the best email address for Cypress Square?

The team at Cypress Square can be reached at [email protected].

Who is the administrator of Cypress Square?

Johanna Hooley is the administrator of Cypress Square.

How many beds does Cypress Square have?

Cypress Square has 44 beds.

Guides for Better Senior Living

Care Cost Calculator: See Prices in Your Area

Nursing Home Data Explorer

Don’t Wait Too Long: 7 Red Flag Signs Your Parent Needs Assisted Living Now

The True Cost of Assisted Living in 2025 – And How Families Are Paying For It

Understanding Senior Living Costs: Pricing Models, Discounts & Financial Assistance

Explore Open Rooms
1 Contact details
2 What type of senior care service are you looking for?
3 What budget do you have in mind for senior care?
4 How soon do you need to find care?
5 Additional details

Thank you for your interest!

Our team will be in touch shortly to help with next steps.