Devlin Manor Nursing and Rehabilitation Center
Nursing Home & Hospice Care · Cumberland, MD
CMS overall rating Info CMS (the Centers for Medicare & Medicaid Services) is the federal agency that rates nursing home quality. Its Overall Rating runs from 1 to 5 stars, combining health inspections, staffing, and quality measures, with inspections weighted most heavily.

Devlin Manor Nursing and Rehabilitation Center

Nursing Home & Hospice Care · Cumberland, MD
CMS overall rating Info CMS (the Centers for Medicare & Medicaid Services) is the federal agency that rates nursing home quality. Its Overall Rating runs from 1 to 5 stars, combining health inspections, staffing, and quality measures, with inspections weighted most heavily.
Calculator: See prices in your area
Devlin Manor Nursing and Rehabilitation Center accepts Medicare, Medicaid, and private pay.

Overview of Devlin Manor Nursing and Rehabilitation Center

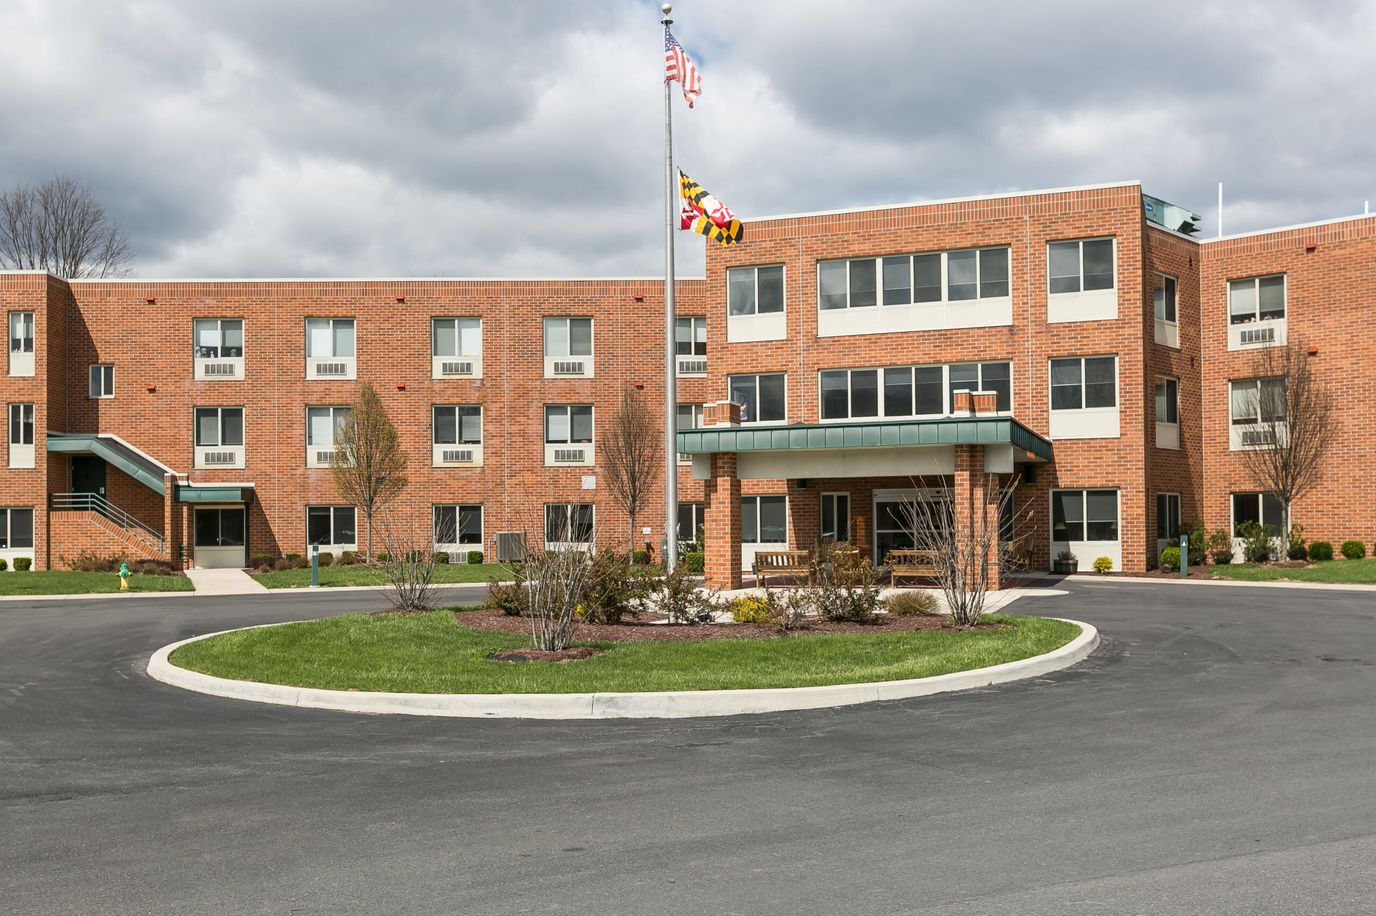
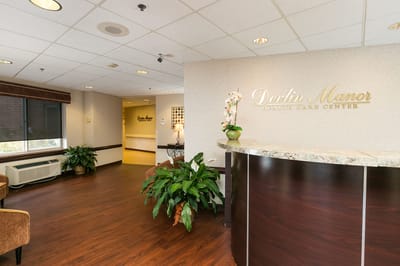
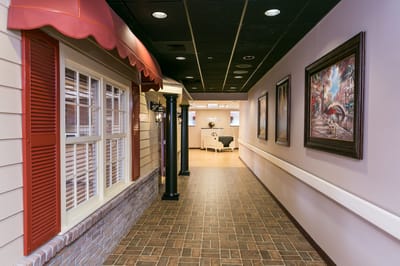
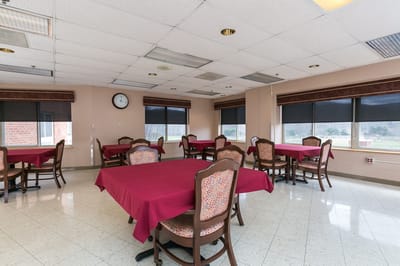
Devlin Manor Nursing and Rehabilitation Center is a nursing home in Cumberland, MD, offering rehabilitation and skilled nursing. Promoting a nurturing and inviting environment, the community ensures older adults’ comfort and safety. 24/7 care, well-balanced meals, and comprehensive therapies are among the exceptional services provided to enrich residents’ living experiences. The community also goes above and beyond to meet residents’ unique needs and preferences through individualized care plans.

Fun gatherings, light physical activities, and games encourage residents to live actively and have fun. Accessible communal spaces and thoughtfully furnished rooms also ensure residents’ relaxation. Situated near Evitts Creek and highways in Cumberland, the community guarantees accessibility and convenience. This nursing home is a good option for senior living in Maryland, as it has top-tier services and a clean setting.

Quality ratings

Measured by Centers for Medicare & Medicaid Services (CMS)

Overall rating Info The Overall CMS Rating combines results from health inspections, staffing levels and quality measures. Health inspections carry the most weight. Staffing and quality scores can increase or decrease the final rating based on performance compared to state and national standards.
▲ 31.5% Above MD avg. ▲ 31.5% Above MD avg.MD average: 3.0Click the badge to see the full State ranking.Click here to see the full State ranking.
Health Inspection Info Based on the results of the facility's three most recent standard inspections and any complaint investigations. CMS reviews the number, scope, and severity of deficiencies, with more recent findings weighted more heavily.
▲ 42.0% Above MD avg. ▲ 42.0% Above MD avg.MD average: 2.8Click the badge to see the full State ranking.Click here to see the full State ranking.
Staffing Info Measures average nursing staff hours per resident per day, including Registered Nurses (RNs) and total nursing staff. Ratings are adjusted based on the level of care residents require and are compared to state and national benchmarks.
▼ 34.3% Below MD avg. ▼ 34.3% Below MD avg.MD average: 3.0Click the badge to see the full State ranking.Click here to see the full State ranking.
Quality Measures Info Based on clinical and physical health indicators reported to CMS, such as hospital readmissions, falls, pressure ulcers, and improvements in mobility. These measures reflect how well residents' health needs are being managed.
▼ 18.8% Below MD avg. ▼ 18.8% Below MD avg.MD average: 3.7Click the badge to see the full State ranking.Click here to see the full State ranking.

Staffing hours breakdown

Info Daily nursing hours per resident by staff type, reported to CMS. Higher is generally better — compare this facility to state and national averages to see where staffing stands.

Hours per resident per day — compared to Maryland state averages

Total nursing care / resident Info Total adjusted nursing hours per resident per day, combining RN, LPN, and aide time. CMS adjusts this for case-mix so facilities can be fairly compared.
2h 57m per day
This facility Maryland avg (3h 46m per day)
vs Maryland avg
-22%

6 of 6 metrics below state avg

Staff typeHours / Day / Residentvs state avg
Registered Nurse (RN) Info RNs hold the highest nursing license and can assess residents, interpret test results, and direct care plans. More RN hours per day often signals stronger clinical oversight and faster response to health changes. 32m per day ▼ 36% State avg: 49m per day · National avg: 41m per day
LPN / LVN Info Licensed Practical Nurses (LPNs) or Licensed Vocational Nurses (LVNs) deliver routine hands-on care — medication administration, wound dressing, and monitoring vital signs. They work under RN supervision and make up a large share of daily bedside care. 36m per day ▼ 34% State avg: 55m per day · National avg: 52m per day
Nurse Aide Info Certified Nurse Aides (CNAs) provide the most direct day-to-day assistance: bathing, dressing, feeding, and mobility. Nurse aide hours are typically the largest staffing category and directly affect residents' quality of life. 1h 46m per day ▼ 17% State avg: 2h 8m per day · National avg: 2h 20m per day
Weekend Total Nursing Info Combined nursing hours (RN + LPN + Nurse Aide) per resident per day on weekends. Staffing often drops on weekends — this figure reveals whether the facility maintains adequate coverage outside of weekday hours. 2h 21m per day ▼ 33% State avg: 3h 31m per day · National avg: 3h 27m per day
Physical Therapist Info Hours per resident per day provided by licensed Physical Therapists (PTs) or PT Assistants. PT services help residents recover mobility after injury or illness and are especially important for post-acute (short-stay) rehabilitation. 3m per day ▼ 43% State avg: 6m per day · National avg: 4m per day
Weekend RN Info Registered nurse hours specifically on weekends. Facilities sometimes reduce RN presence on Saturdays and Sundays — a low weekend RN figure compared to weekday hours can indicate reduced clinical oversight when most administrative staff are absent. 31m per day ▼ 16% State avg: 37m per day · National avg: 29m per day

Capacity and availability

This home usually has availability

Lower occupancy than the Maryland average: 82.4%
Occupancy rate
69.9%
Avg. Length of Stay
116 days
Bed community size
124-bed community Rank #77 / 697Bed count — State benchmarkedThis home is ranked 77th out of 697 homes in Maryland. Shows this facility's certified or reported bed count compared to other Maryland facilities. Larger communities may offer more amenities, programs, and on-site services for residents and families.Rankings are based only on facilities in Maryland that report data for that category. Facilities without available data are excluded from the ranking.Click the rank badge to see the full State ranking.Click here to see the full State ranking.
A larger shared setting that may offer more common spaces and organized community services.
Walk Score
Walk Score: 2 / 100 Rank #940 / 985Walk Score — State benchmarkedThis home is ranked 940th out of 985 homes in Maryland. Shows how walkable this facility's neighborhood is compared to the average Walk Score across Maryland facilities. Higher scores benefit residents, families, and staff.Rankings are based only on facilities in Maryland that report data for that category. Facilities without available data are excluded from the ranking.Click the rank badge to see the full State ranking.Click here to see the full State ranking.
Car-dependent. Most errands require a car, with limited nearby walkable options.

Contact Devlin Manor Nursing and Rehabilitation Center

Staffing Data

Reporting period: October 1 – December 31, 2025 (Q4 2025). Source: CMS Payroll-Based Journal report.

Total staff 155
Employees 92
Contractors 63
Staff to resident ratio 1.67 : 1
8% fewer staff per resident than Maryland average
Maryland average ratio: 1.81 : 1 Maryland average ratio: 1.81 : 1See full Maryland ranking
Avg staff/day 39
Average shift 8.3 hours
0% compared with Maryland average
Maryland average: 8 hours Maryland average shift: 8 hoursSee full Maryland ranking
Total staff hours (quarter) 29,678

Nursing staff breakdown

Q4 2025 · Oct 1 – Dec 31 More info This data comes from the CMS Payroll-Based Journal report covering October 1 – December 31, 2025.
Registered Nurse

Manages medical care and health needs.

RN Staff Info 22 total: 10 full-time employees and 12 contractors. 22
Average shift length Info Average shift length. Calculated as total hours divided by days worked and average staff per day. 9.5 hours
Licensed Practical Nurse

Assists with medical care and medications.

LPN Staff Info 33 total: 13 full-time employees and 20 contractors. 33
Average shift length Info Average shift length. Calculated as total hours divided by days worked and average staff per day. 8.9 hours
Certified Nursing Assistant

Helps with daily care and mobility.

CNA Staff Info 53 total: 36 full-time employees and 17 contractors. 53
Average shift length Info Average shift length. Calculated as total hours divided by days worked and average staff per day. 8.3 hours

Contractor staffing

Q4 2025 · Oct 1 – Dec 31 More info This data comes from the CMS Payroll-Based Journal report covering October 1 – December 31, 2025.

Total hours from contractors

15.7%

4,650 contractor hours this quarter

Licensed Practical Nurse: 20 Certified Nursing Assistant: 17 Registered Nurse: 12 Respiratory Therapy Technician: 4 Physical Therapy Aide: 3 Speech Language Pathologist: 3 Physical Therapy Assistant: 3 Qualified Social Worker: 1

Staff by category

Q4 2025 · Oct 1 – Dec 31 More info This data comes from the CMS Payroll-Based Journal report covering October 1 – December 31, 2025.
Certified Nursing Assistant36175311,37492100%8.3
Licensed Practical Nurse1320335,15992100%8.9
Registered Nurse1012223,15492100%9.5
Nurse Aide in Training140142,3428997%8.2
Medication Aide/Technician5051,6397278%8.6
Clinical Nurse Specialist4041,0116065%7.3
Physical Therapy Aide0339146672%7.2
Speech Language Pathologist0335926470%7.1
Dietitian3035606065%8
Other Dietary Services Staff2024886267%7.9
Respiratory Therapy Technician0444797379%6.5
Dental Services Staff1014516166%7.4
Nurse Practitioner1014405560%8
Administrator1014245358%8
Physical Therapy Assistant0333455054%6.8
Qualified Social Worker0112115661%3.8
RN Director of Nursing2029678%8
53 Certified Nursing Assistant
% of Days 100%
33 Licensed Practical Nurse
% of Days 100%
22 Registered Nurse
% of Days 100%
14 Nurse Aide in Training
% of Days 97%
5 Medication Aide/Technician
% of Days 78%
4 Clinical Nurse Specialist
% of Days 65%
3 Physical Therapy Aide
% of Days 72%
3 Speech Language Pathologist
% of Days 70%
3 Dietitian
% of Days 65%
2 Other Dietary Services Staff
% of Days 67%
4 Respiratory Therapy Technician
% of Days 79%
1 Dental Services Staff
% of Days 66%
1 Nurse Practitioner
% of Days 60%
1 Administrator
% of Days 58%
3 Physical Therapy Assistant
% of Days 54%
1 Qualified Social Worker
% of Days 61%
2 RN Director of Nursing
% of Days 8%

Penalties and fines

Federal penalties imposed by CMS for regulatory violations, including civil money penalties (fines) and denials of payment for new Medicare/Medicaid admissions.

Source: CMS Penalties Database

No penalties in the past 3 years

No civil money penalties or payment denials were reported in the last 3 years.

Quality of care over time

These measures show how residents usually do over time at this home, based on health outcomes and preventive care.

High-risk clinical events score Info A composite score based on pressure ulcers, falls with injury, weight loss, walking ability decline, and activities of daily living decline. 11.2
13% better than Maryland average

Maryland average: 12.9

Functional decline score Info A composite score based on activities of daily living decline, walking ability decline, and incontinence. 19.7
23% better than Maryland average

Maryland average: 25.7

Long-stay resident measures
Need for Help with Daily Activities Increased Info Percent of long-stay residents whose need for help with daily activities has increased 24.6%
In line with Maryland average

Maryland average: 23.7%

Walking Ability Worsened Info Percent of long-stay residents whose ability to move independently worsened 16.0%
42% better than Maryland average

Maryland average: 27.7%

Low Risk Residents with Bowel/Bladder Incontinence Info Percent of low risk long-stay residents who lose control of their bowels or bladder 18.5%
29% better than Maryland average

Maryland average: 25.9%

Falls with Major Injury Info Percent of long-stay residents experiencing one or more falls with major injury 2.1%
10% better than Maryland average

Maryland average: 2.3%

High Risk Residents with Pressure Ulcers Info Percent of long-stay high risk residents with pressure ulcers 7.4%
14% worse than Maryland average

Maryland average: 6.5%

Urinary Tract Infection Info Percent of long-stay residents with a urinary tract infection 3.1%
93% worse than Maryland average

Maryland average: 1.6%

Lost Too Much Weight Info Percent of long-stay residents who lose too much weight 6.1%
5% worse than Maryland average

Maryland average: 5.8%

Depressive Symptoms Info Percent of long-stay residents who have depressive symptoms 33.7%
67% worse than Maryland average

Maryland average: 20.2%

Antipsychotic Use Info Percent of long-stay residents who received an antipsychotic medication 29.3%
127% worse than Maryland average

Maryland average: 12.9%

Pneumococcal Vaccine Info Percent of long-stay residents assessed and appropriately given the pneumococcal vaccine 91.8%
In line with Maryland average

Maryland average: 92.0%

Influenza Vaccine Info Percent of long-stay residents assessed and appropriately given the seasonal influenza vaccine 92.2%
5% worse than Maryland average

Maryland average: 96.6%

Short-stay resident measures
Pneumococcal Vaccine Info Percent of short-stay residents assessed and appropriately given the pneumococcal vaccine 73.2%
7% worse than Maryland average

Maryland average: 78.4%

Antipsychotic medication increase Info Percent of short-stay residents who newly received an antipsychotic medication 1.6%
12% worse than Maryland average

Maryland average: 1.4%

Influenza Vaccine Info Percent of short-stay residents assessed and appropriately given the seasonal influenza vaccine 87.6%
9% better than Maryland average

Maryland average: 80.6%

Breakdown by payment type

Medicare

51% of new residents, usually for short-term rehab.

Typical stay 1 months

Private pay

39% of new residents, often for short stays.

Typical stay 1 - 2 months

Medicaid

10% of new residents, often for long-term daily care.

Typical stay 2 - 3 years

Facility Characteristics

Source: CMS Long-Term Care Facility Characteristics (Data as of Jan 2026)

Total residents 93
Medicare
14
15.1% of residents
Medicaid
66
71% of residents
Private pay or other
13
14% of residents
Programs & Services
Residents Group

Residents meet regularly to discuss policies, care quality, and activities

Nurse Aide Training

State-approved Nurse Aide Training and Competency Evaluation Program on-site

Active Resident Council

Organized group of residents that meets regularly to discuss facility policies, quality of life, and activities.

Finances and operations

Based on CMS SNF Cost Report for fiscal year ending in 12/2023.

For-profit
Individual
Net patient revenue Info Net patient revenue — what the home actually collects for resident care, after contractual allowances, bad debt and discounts are subtracted from its gross charges (CMS cost report, Worksheet G-3). It covers resident care only; money the home earns from other sources is shown separately as "Other income."
$10.1M
Net patient income Info Net patient income: net patient revenue minus the home's total operating expenses. A positive figure means it earns more from resident care than it spends to deliver it; a negative figure means the opposite. It excludes non-operating "other income."
-$529.8K
For-profit Individual
Net patient revenue Info Net patient revenue — what the home actually collects for resident care, after contractual allowances, bad debt and discounts are subtracted from its gross charges (CMS cost report, Worksheet G-3). It covers resident care only; money the home earns from other sources is shown separately as "Other income."
$10.1M
Net patient income Info Net patient income: net patient revenue minus the home's total operating expenses. A positive figure means it earns more from resident care than it spends to deliver it; a negative figure means the opposite. It excludes non-operating "other income."
-$529.8K
Other income Info Money the home earns outside of resident care — such as investments, grants, rentals and other non-operating sources (CMS cost report, Worksheet G-3). It is tracked separately from net patient revenue: it is not part of that figure, and it is not included in net patient income.
$586.6K
Payroll costs Info Staff salaries plus wage-related costs — benefits such as payroll taxes, health insurance and retirement — from the home's own accounting records (CMS cost report, Worksheet A). Contract or agency labor is counted separately, under other operating costs.
$4.4M 43.2% of net patient revenue Info Payroll as a share of revenue: staff salaries and wage-related benefits divided by net patient revenue. A higher figure means more of each revenue dollar goes to staff pay. Rank #85 / 148Payroll % — State benchmarkedThis home is ranked 85th out of 148 homes in Maryland. Shows payroll as a percentage of revenue versus the Maryland average. Well-run Maryland facilities typically land around 49–57% — the top third Statewide. Below 25% may signal understaffing or heavy agency use — read with Staffing ratings.Rankings are based only on facilities in Maryland that report data for that category. Facilities without available data are excluded from the ranking.Click the rank badge to see the full State ranking.Click here to see the full State ranking.
Other operating costs Info Everything it costs to run the home apart from payroll — food, utilities, supplies, maintenance, contract labor and administration. Calculated as total operating expense minus payroll (staff salaries and wage-related benefits).
$6.3M
Total costs Info The home's total operating expense for the year — all the costs of running it, salaries included (CMS cost report, Worksheet G-3).
$10.6M

What does this home offer?

Building type icon
Building type icon

Building Type: 3-story

On-site medical care and health services icon

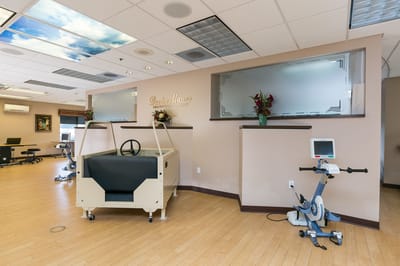
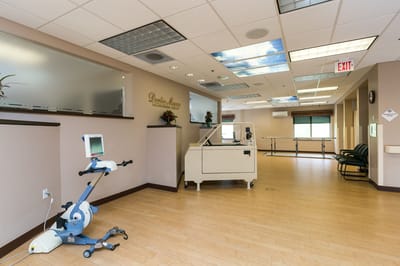
On-site Medical Care and Health Services

Rehabilitative support icon

Rehabilitative Support

Exercise program icon

Exercise Programs

Social and recreational activities icon

Social and Recreational Activities

Who this home usually serves

TYPE OF STAY

Mostly short-term rehab stays

Most residents typically stay for a few weeks or months before returning home or moving on.

Most new residents arrive under Medicare (51% of admissions), and a typical Medicare stay runs around 1 months.

Admissions
237 total

Coverage residents most often arrive under.

Medicare 51%
Private pay 39%
Medicaid 10%
Discharges
272 total

Coverage residents most often leave under.

Medicare 40%
Private pay 37%
Medicaid 22%

Places of interest near Devlin Manor Nursing and Rehabilitation Center

Address 3.6 miles from city center Info Estimated distance in miles from Cumberland's city center to Devlin Manor Nursing and Rehabilitation Center's address, calculated via Google Maps.

Calculate Travel Distance to Devlin Manor Nursing and Rehabilitation Center

Add your location

Address

Compare Nursing Homes around Allegany County

The information below is reported by the Maryland Department of Health, Office of Health Care Quality.

3 facilities compared · CMS & MD Dept. of Health data

Devlin Manor Nursing and Rehabilitation Center
NH
HC
Cumberland
124
Facility 124
MD AVG 43
Rank #77 / 697
69.9% -15%2.95 +3%-22%$0
26
Facility 26
MD AVG 49.9
Rank #27 / 149
5.2-95-
2
Facility 2
MD AVG 43
Rank #940 / 985
-$10.1M$4.4M
43.2%
Facility 43.2%
MD AVG 38.5%
Rank #85 / 148
215244
Cumberland Healthcare Center
NH
AL
HC
MC
RC
Cumberland
130
Facility 130
MD AVG 43
Rank #66 / 697
71.5% -13%3.30 -11%-13%$97.8k
56
Facility 56
MD AVG 49.9
Rank #104 / 149
14.0299-
15
Facility 15
MD AVG 43
Rank #783 / 985
Pc Mstr Lsco, LLC$11.9M$5.9M
49.1%
Facility 49.1%
MD AVG 38.5%
Rank #55 / 148
215055
Egle Nursing and Rehab Center
NH
NC
RC
Lonaconing
66
Facility 66
MD AVG 43
Rank #200 / 697
97.4% +18%3.53 -27%-6%$0
29
Facility 29
MD AVG 49.9
Rank #31 / 149
7.3-64-
22
Facility 22
MD AVG 43
Rank #719 / 985
Barbara Lauder$8.6M$5.2M
61.1%
Facility 61.1%
MD AVG 38.5%
Rank #31 / 148
215307

Financial Assistance for
Nursing Home in Maryland

Devlin Manor Nursing and Rehabilitation Center is located in Cumberland, Maryland.
Here are the financial assistance programs available to residents in Maryland.

Get Financial aid guidance

Community Options Waiver

Maryland Medicaid Community Options Waiver

Age 65+ or disabled
General Maryland resident, Medicaid- eligible, nursing home-level care need.
Income Limits (2025) ~$2,829/month 300% FBR, individual
Asset Limits $2,000 (individual), $3,000 (couple) (excludes home, car).
MD

High urban demand; rural outreach efforts.

Benefits
Personal care (5-7 hours/day, e.g., bathing, dressing) Respite care (up to 240 hours/year) Adult day care ($70/day) Home modifications ($1,500 avg.)

Senior Care Program

Maryland Senior Care

Age 65+
General Maryland resident, at risk of nursing home placement.
Income Limits ~$2,000/month individual, varies by county
Asset Limits $11,000 individual
MD

Limited funding; waitlists common in high-demand areas.

Benefits
In-home care (3-5 hours/week) Respite care (up to 10 days/year) Meals (~$6/meal) Transportation (~5 trips/month) Case management

Maryland Nursing Home Medicaid

Maryland Medical Assistance (Medicaid) Nursing Home Program

Age 65+
General Maryland resident, Medicaid-eligible, requires nursing home-level care.
Income Limits (2025) $943/month (individual); most income applied to care costs.
Asset Limits $2,500 (individual), $3,000 (couple); spousal protections up to $155,356.
MD

Home equity limit $636,000; estate recovery applies post-55.

Benefits
24/7 nursing care Meals Therapy Medications (unlimited per medical need)

Senior Assisted Living Subsidy Program

Maryland Senior Assisted Living Group Home Subsidy

Age 62+
General Maryland resident, in or moving to approved assisted living, low/moderate income.
Income Limits (2025) ~$34,000/year individual, varies by county
Asset Limits Not strict; prioritizes low-income.
MD

Not available statewide; facility must be licensed by MDH.

Benefits
Personal care Meals 24-hour supervision (up to $1,500/month subsidy typical)

Veterans Aid and Attendance (A&A) Benefit

Maryland VA Aid and Attendance

Age
General Wartime veteran/spouse, age 65+ or disabled, needs ADL help, Maryland resident.
Income Limits (2025) Net income minus medical expenses < $1,984/month individual with A&A
Asset Limits $155,356 net worth limit
MD

High veteran population in suburban/rural areas.

Benefits
Cash benefit ($1,478-$2,471/month, varies by status) for care costs

Senior Prescription Drug Assistance Program (SPDAP)

Maryland Senior Prescription Drug Assistance Program

Age 65+
General Maryland resident (6+ months), Medicare Part D enrolled.
Income Limits (2025) $48,560/year individual, 300% FPL
Asset Limits None specified.
MD

Supplements Medicare Part D; annual enrollment required.

Benefits
Up to $40/month premium subsidy Reducing drug costs

Medicare Savings Programs (MSP)

Maryland Medicare Savings Programs

Age 65+
General Maryland resident, Medicare Part A/B enrollee.
Income Limits (2025) $2,014/month (QMB), $2,706/month (SLMB/QI, individual).
Asset Limits $9,090 (individual), $13,630 (couple).
MD

Includes QMB, SLMB, QI categories.

Benefits
Covers premiums (up to $174.70/month Part B) Co-pays Deductibles

Community Personal Assistance Services (CPAS)

Maryland Medicaid Community Personal Assistance Services

Age 65+
General Maryland resident, Medicaid-eligible, needs ADL assistance.
Income Limits (2025) $943/month (individual); spend-down available.
Asset Limits $2,500 (individual), $3,000 (couple).
MD

Consumer-directed option allows hiring family caregivers.

Benefits
Personal care (hours vary, typically 20-30/week) Chores Nurse supervision

Frequently Asked Questions about Devlin Manor Nursing and Rehabilitation Center

Is Devlin Manor Nursing and Rehabilitation Center in a walkable area?

Devlin Manor Nursing and Rehabilitation Center has a walk score of 2. Car-dependent. Most errands require a car, with limited nearby walkable options.

What is the occupancy rate at Devlin Manor Nursing and Rehabilitation Center?

Devlin Manor Nursing and Rehabilitation Center's occupancy is 69.9%.

What is the best email address for Devlin Manor Nursing and Rehabilitation Center?

The team at Devlin Manor Nursing and Rehabilitation Center can be reached at [email protected].

Does Devlin Manor Nursing and Rehabilitation Center operate as a for-profit or non-profit?

Devlin Manor Nursing and Rehabilitation Center is registered as a for-profit.

Are there photos of Devlin Manor Nursing and Rehabilitation Center?

Yes — there are 7 photos of Devlin Manor Nursing and Rehabilitation Center in the photo gallery on this page.

What is the address of Devlin Manor Nursing and Rehabilitation Center?

Devlin Manor Nursing and Rehabilitation Center is located at 10301 Christie Rd Ne, Cumberland, MD 21502.

What is the phone number of Devlin Manor Nursing and Rehabilitation Center?

(301) 724-1400 will put you in contact with the team at Devlin Manor Nursing and Rehabilitation Center.

Guides for Better Senior Living

Care Cost Calculator: See Prices in Your Area

Nursing Home Data Explorer

Don’t Wait Too Long: 7 Red Flag Signs Your Parent Needs Assisted Living Now

The True Cost of Assisted Living in 2025 – And How Families Are Paying For It

Understanding Senior Living Costs: Pricing Models, Discounts & Financial Assistance