The Mather
Nursing Home, Assisted Living, Independent Living & Memory Care · Evanston, IL
CMS overall rating Info CMS (the Centers for Medicare & Medicaid Services) is the federal agency that rates nursing home quality. Its Overall Rating runs from 1 to 5 stars, combining health inspections, staffing, and quality measures, with inspections weighted most heavily.

The Mather

Nursing Home, Assisted Living, Independent Living & Memory Care · Evanston, IL
CMS overall rating Info CMS (the Centers for Medicare & Medicaid Services) is the federal agency that rates nursing home quality. Its Overall Rating runs from 1 to 5 stars, combining health inspections, staffing, and quality measures, with inspections weighted most heavily.
Calculator: See prices in your area
The Mather accepts Medicare and private pay.

Overview of The Mather

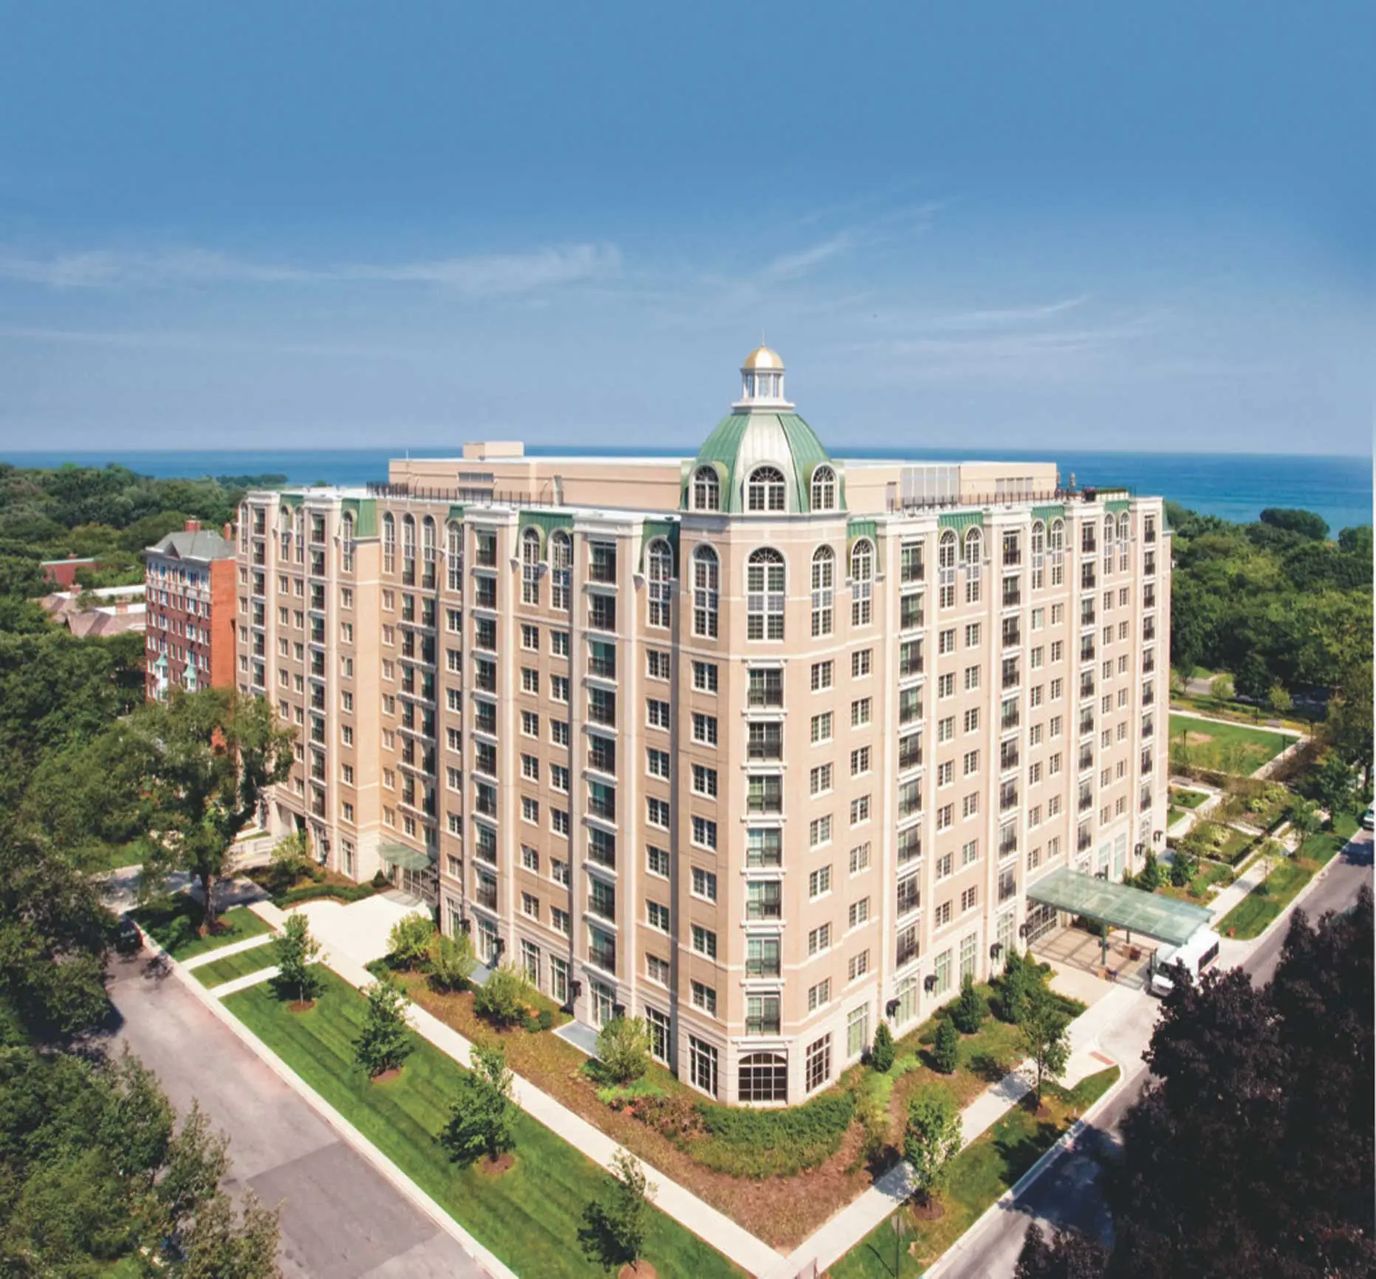
The Mather is undoubtedly the premier Life Plan Community just north of Chicago. The beautiful condominium-style building offers resort-like hospitality, ensuring residents a sense of belonging with a forward-thinking approach to senior living. The luxurious 62+ retirement community has learned year after year the right direction to a quality standard of living and, for years, has promoted and lived by its goal of enhancing the quality of life for every senior who has chosen its approach to senior living.

A luxury community that guarantees cozy apartments where residents can feel comfortable after a day of doing activities. Their amenities and facilities are convenient: a hair salon and barbershop, a library, a recreational studio, a business center, and breathtaking views, to name a few of the community highlights. Their housekeeping and linen services, concierge, and maintenance services are all provided so residents can live a hassle-free lifestyle.

Quality ratings

Measured by Centers for Medicare & Medicaid Services (CMS)

Overall rating Info The Overall CMS Rating combines results from health inspections, staffing levels and quality measures. Health inspections carry the most weight. Staffing and quality scores can increase or decrease the final rating based on performance compared to state and national standards.
▲ 98.4% Above IL avg. ▲ 98.4% Above IL avg.IL average: 2.5Click the badge to see the full State ranking.Click here to see the full State ranking.
Health Inspection Info Based on the results of the facility's three most recent standard inspections and any complaint investigations. CMS reviews the number, scope, and severity of deficiencies, with more recent findings weighted more heavily.
▲ 80.1% Above IL avg. ▲ 80.1% Above IL avg.IL average: 2.8Click the badge to see the full State ranking.Click here to see the full State ranking.
Staffing Info Measures average nursing staff hours per resident per day, including Registered Nurses (RNs) and total nursing staff. Ratings are adjusted based on the level of care residents require and are compared to state and national benchmarks.
▲ 133.9% Above IL avg. ▲ 133.9% Above IL avg.IL average: 2.1Click the badge to see the full State ranking.Click here to see the full State ranking.
Quality Measures Info Based on clinical and physical health indicators reported to CMS, such as hospital readmissions, falls, pressure ulcers, and improvements in mobility. These measures reflect how well residents' health needs are being managed.
▲ 42.1% Above IL avg. ▲ 42.1% Above IL avg.IL average: 2.8Click the badge to see the full State ranking.Click here to see the full State ranking.

Staffing hours breakdown

Info Daily nursing hours per resident by staff type, reported to CMS. Higher is generally better — compare this facility to state and national averages to see where staffing stands.

Hours per resident per day — compared to Illinois state averages

Total nursing care / resident Info This home is ranked 5th out of 172 homes in Illinois for nurse hours. Total adjusted nursing hours per resident per day, combining RN, LPN, and aide time. CMS adjusts this for case-mix so facilities can be fairly compared.
5h 53m per day
Rank #5 / 172Nurse hours — State benchmarkedThis home is ranked 5th out of 172 homes in Illinois. Shows adjusted nurse hours per resident per day benchmarked to the Illinois average, with a ranking across 172 Illinois facilities. More hours mean more direct care. The national average is about 3.5 hrs; below 3.0 is a red flag.Rankings are based only on facilities in Illinois that report data for that category. Facilities without available data are excluded from the ranking.Click the rank badge to see the full State ranking.Click here to see the full State ranking.
This facility Illinois avg (3h 6m per day)
vs Illinois avg
+90%

1 of 6 metrics below state avg

Standout metric Registered Nurse (RN) is +159% above state avg
Staff typeHours / Day / Residentvs state avg
Registered Nurse (RN) Info RNs hold the highest nursing license and can assess residents, interpret test results, and direct care plans. More RN hours per day often signals stronger clinical oversight and faster response to health changes. 1h 52m per day ▲ 159% State avg: 43m per day · National avg: 41m per day
LPN / LVN Info Licensed Practical Nurses (LPNs) or Licensed Vocational Nurses (LVNs) deliver routine hands-on care — medication administration, wound dressing, and monitoring vital signs. They work under RN supervision and make up a large share of daily bedside care. 27m per day ▼ 30% State avg: 39m per day · National avg: 52m per day
Nurse Aide Info Certified Nurse Aides (CNAs) provide the most direct day-to-day assistance: bathing, dressing, feeding, and mobility. Nurse aide hours are typically the largest staffing category and directly affect residents' quality of life. 3h 20m per day ▲ 57% State avg: 2h 7m per day · National avg: 2h 20m per day
Weekend Total Nursing Info Combined nursing hours (RN + LPN + Nurse Aide) per resident per day on weekends. Staffing often drops on weekends — this figure reveals whether the facility maintains adequate coverage outside of weekday hours. 5h 3m per day ▲ 63% State avg: 3h 6m per day · National avg: 3h 27m per day
Physical Therapist Info Hours per resident per day provided by licensed Physical Therapists (PTs) or PT Assistants. PT services help residents recover mobility after injury or illness and are especially important for post-acute (short-stay) rehabilitation. 7m per day ▲ 135% State avg: 3m per day · National avg: 4m per day
Weekend RN Info Registered nurse hours specifically on weekends. Facilities sometimes reduce RN presence on Saturdays and Sundays — a low weekend RN figure compared to weekday hours can indicate reduced clinical oversight when most administrative staff are absent. 1h 25m per day ▲ 153% State avg: 33m per day · National avg: 29m per day

Capacity and availability

Avg. Length of Stay
141 days
Bed community size
22-bed community Rank #401 / 426Bed count — State benchmarkedThis home is ranked 401st out of 426 homes in Illinois. Shows this facility's certified or reported bed count compared to other Illinois facilities. Larger communities may offer more amenities, programs, and on-site services for residents and families.Rankings are based only on facilities in Illinois that report data for that category. Facilities without available data are excluded from the ranking.Click the rank badge to see the full State ranking.Click here to see the full State ranking.
A smaller, more intimate setting that may offer a quieter environment and closer staff-resident interactions.
Walk Score
Walk Score: 95 / 100 Rank #18 / 648Walk Score — State benchmarkedThis home is ranked 18th out of 648 homes in Illinois. Shows how walkable this facility's neighborhood is compared to the average Walk Score across Illinois facilities. Higher scores benefit residents, families, and staff.Rankings are based only on facilities in Illinois that report data for that category. Facilities without available data are excluded from the ranking.Click the rank badge to see the full State ranking.Click here to see the full State ranking.
Walker's paradise. Daily errands do not require a car, with many shops and services nearby.

About this community

Occupancy

Occupancy rate
76%
Rank #95 / 204Occupancy rate — State benchmarkedThis home is ranked 95th out of 204 homes in Illinois. Shows this facility's occupancy rate versus the Illinois average, with its Statewide rank out of 204. Higher occupancy signals strong local demand and financial stability.Rankings are based only on facilities in Illinois that report data for that category. Facilities without available data are excluded from the ranking.Click the rank badge to see the full State ranking.Click here to see the full State ranking.
Higher than the Illinois average: 69.3%
Occupied beds
17 / 22
Average occupied beds in Illinois homes 93 beds

License Details

Facility TypeAssisted Living/shared Housing Establishment
StatusActive
IssuanceJuly 22, 2025
ExpirationJuly 22, 2026 Expires in 28 days
CountyCook
License Number5103350

Ownership & Operating Entity

The Mather is legally operated by The Mather Evanston.

Type Of Units

Permanent Units
10 units
Alzheimer's Units
12 units
Total beds
22 units

Contact The Mather

Inspection History

In Illinois, the Department of Public Health, Office of Health Care Regulation conducts annual unannounced surveys to assess compliance with state and federal healthcare facility standards.

Inspection Scorecard Info This scorecard compares key inspection, deficiency, and complaint metrics at this facility against the Illinois state average. Metrics rated ≥15% worse than average are highlighted in red; those ≥15% better are highlighted in green.

Overall vs. IL average 0 Worse No metrics in this bucket. 1 Better Metrics better than Illinois average:
• Total inspections (38% below)
Latest Inspection April 19, 2026 Facility Reported Incident Inspection

Inspections Info State inspections evaluate whether the facility meets health and safety standards.

This FacilityIL Averagevs. IL Avg
Total inspections Info Combined count of all routine and focused inspections. Excludes complaint investigations. 58 This facility has 38% fewer total inspections than a typical Illinois nursing home (5 vs. IL avg 8).↓ 38% better

Health Inspection History

Inspections since 2023
Total health inspections 2

Illinois average 10.4


Last Health inspection on Mar 2025

Total health citations
7 Rank #5 / 172Health citations — State benchmarkedThis home is ranked 5th out of 172 homes in Illinois. Shows this facility's total health deficiency citations benchmarked to the Illinois State average, with a ranking across all 172 IL facilities. Lower citation counts earn a better rank.Rankings are based only on facilities in Illinois that report data for that category. Facilities without available data are excluded from the ranking.Click the rank badge to see the full State ranking.Click here to see the full State ranking.

Illinois average 36.8

Citations per inspection
3.5 Rank #82 / 172Citations per inspection — State benchmarkedThis home is ranked 82nd out of 172 homes in Illinois. Shows average deficiency citations per CMS inspection for this facility versus the Illinois mean across 172 facilities with citation data. Lower is better.Rankings are based only on facilities in Illinois that report data for that category. Facilities without available data are excluded from the ranking.Click the rank badge to see the full State ranking.Click here to see the full State ranking.

Illinois average 3.68


Health citations are formal notices following inspections when they fail to comply with safety and care standards.

All 7 citations resulted from standard inspections.

Breakdown of citation severity (last 3 years)
Critical health citations
0
100% better than Illinois average

Illinois average: 0.7


Serious health citations
0
100% better than Illinois average

Illinois average: 3.6

0 critical citations Illinois average: 0.7

0 serious citations Illinois average: 3.6

7 moderate citations Illinois average: 32

0 minor citations Illinois average: 0.5
Citations history (last 3 years)
Infection Control moderate citation Mar 20, 2025
Corrected

Nursing Services moderate citation Mar 20, 2025
Corrected

Quality of Care moderate citation Mar 20, 2025
Corrected

Care Planning moderate citation Mar 20, 2025
Corrected

Staffing Data

Reporting period: October 1 – December 31, 2025 (Q4 2025). Source: CMS Payroll-Based Journal report.

Total staff 70
Employees 58
Contractors 12
Staff to resident ratio 3.18 : 1
77% more staff per resident than Illinois average
Illinois average ratio: 1.80 : 1 Illinois average ratio: 1.80 : 1See full Illinois ranking
Avg staff/day 29
Average shift 6.9 hours
9% worse than Illinois average
Illinois average: 7.6 hours Illinois average shift: 7.6 hoursSee full Illinois ranking
Total staff hours (quarter) 18,390

Nursing staff breakdown

Q4 2025 · Oct 1 – Dec 31 More info This data comes from the CMS Payroll-Based Journal report covering October 1 – December 31, 2025.
Registered Nurse

Manages medical care and health needs.

RN Staff Info 20 total: 17 full-time employees and 3 contractors. 20
Average shift length Info Average shift length. Calculated as total hours divided by days worked and average staff per day. 7.3 hours
Licensed Practical Nurse

Assists with medical care and medications.

LPN Staff Info All 5 LPN Staff are full-time employees. No contractors work on this role. 5
Average shift length Info Average shift length. Calculated as total hours divided by days worked and average staff per day. 5.5 hours
Certified Nursing Assistant

Helps with daily care and mobility.

CNA Staff Info 29 total: 28 full-time employees and 1 contractor. 29
Average shift length Info Average shift length. Calculated as total hours divided by days worked and average staff per day. 7.5 hours

Contractor staffing

Q4 2025 · Oct 1 – Dec 31 More info This data comes from the CMS Payroll-Based Journal report covering October 1 – December 31, 2025.

Total hours from contractors

4.1%

758 contractor hours this quarter

Respiratory Therapy Technician: 4 Registered Nurse: 3 Physical Therapy Assistant: 2 Certified Nursing Assistant: 1 Qualified Social Worker: 1 Medical Director: 1

Staff by category

Q4 2025 · Oct 1 – Dec 31 More info This data comes from the CMS Payroll-Based Journal report covering October 1 – December 31, 2025.
Certified Nursing Assistant281299,17792100%7.5
Registered Nurse173204,22492100%7.3
Other Dietary Services Staff3031,31492100%7.5
Licensed Practical Nurse5051,24992100%5.5
Mental Health Service Worker2026516166%7.3
Clinical Nurse Specialist1014486065%7.5
Nurse Practitioner1014435964%7.5
Administrator1013985358%7.5
Respiratory Therapy Technician0443296672%3.7
Physical Therapy Assistant0221114246%2.6
Qualified Social Worker011271921%1.4
Medical Director011211516%1.4
29 Certified Nursing Assistant
% of Days 100%
20 Registered Nurse
% of Days 100%
3 Other Dietary Services Staff
% of Days 100%
5 Licensed Practical Nurse
% of Days 100%
2 Mental Health Service Worker
% of Days 66%
1 Clinical Nurse Specialist
% of Days 65%
1 Nurse Practitioner
% of Days 64%
1 Administrator
% of Days 58%
4 Respiratory Therapy Technician
% of Days 72%
2 Physical Therapy Assistant
% of Days 46%
1 Qualified Social Worker
% of Days 21%
1 Medical Director
% of Days 16%

Penalties and fines

Federal penalties imposed by CMS for regulatory violations, including civil money penalties (fines) and denials of payment for new Medicare/Medicaid admissions.

Source: CMS Penalties Database

No penalties in the past 3 years

No civil money penalties or payment denials were reported in the last 3 years.

Quality of care over time

These measures show how residents usually do over time at this home, based on health outcomes and preventive care.

High-risk clinical events score Info A composite score based on pressure ulcers, falls with injury, weight loss, walking ability decline, and activities of daily living decline. 12.4
28% worse than Illinois average

Illinois average: 9.7

Functional decline score Info A composite score based on activities of daily living decline, walking ability decline, and incontinence. 27.2
46% worse than Illinois average

Illinois average: 18.6

Long-stay resident measures
Need for Help with Daily Activities Increased Info Percent of long-stay residents whose need for help with daily activities has increased 31.3%
102% worse than Illinois average

Illinois average: 15.5%

Walking Ability Worsened Info Percent of long-stay residents whose ability to move independently worsened 21.2%
15% worse than Illinois average

Illinois average: 18.4%

Low Risk Residents with Bowel/Bladder Incontinence Info Percent of low risk long-stay residents who lose control of their bowels or bladder 29.2%
35% worse than Illinois average

Illinois average: 21.6%

Falls with Major Injury Info Percent of long-stay residents experiencing one or more falls with major injury 7.1%
111% worse than Illinois average

Illinois average: 3.4%

High Risk Residents with Pressure Ulcers Info Percent of long-stay high risk residents with pressure ulcers 0.0%
100% better than Illinois average

Illinois average: 5.3%

Urinary Tract Infection Info Percent of long-stay residents with a urinary tract infection 2.4%
35% worse than Illinois average

Illinois average: 1.8%

Lost Too Much Weight Info Percent of long-stay residents who lose too much weight 2.6%
60% better than Illinois average

Illinois average: 6.5%

Depressive Symptoms Info Percent of long-stay residents who have depressive symptoms 11.5%
76% better than Illinois average

Illinois average: 48.1%

Antipsychotic Use Info Percent of long-stay residents who received an antipsychotic medication 7.1%
65% better than Illinois average

Illinois average: 20.2%

Pneumococcal Vaccine Info Percent of long-stay residents assessed and appropriately given the pneumococcal vaccine 96.5%
8% better than Illinois average

Illinois average: 89.2%

Influenza Vaccine Info Percent of long-stay residents assessed and appropriately given the seasonal influenza vaccine 100.0%
9% better than Illinois average

Illinois average: 91.6%

Short-stay resident measures
Pneumococcal Vaccine Info Percent of short-stay residents assessed and appropriately given the pneumococcal vaccine 77.8%
14% better than Illinois average

Illinois average: 68.3%

Antipsychotic medication increase Info Percent of short-stay residents who newly received an antipsychotic medication 0.0%
100% better than Illinois average

Illinois average: 2.3%

Influenza Vaccine Info Percent of short-stay residents assessed and appropriately given the seasonal influenza vaccine 95.7%
52% better than Illinois average

Illinois average: 63.0%

Breakdown by payment type

Medicare

45% of new residents, usually for short-term rehab.

Typical stay 23 days

Private pay

55% of new residents, often for short stays.

Typical stay 6 - 7 months

Facility Characteristics

Source: CMS Long-Term Care Facility Characteristics (Data as of Jan 2026)

Total residents 22
Medicare
2
9.1% of residents
Private pay or other
20
90.9% of residents
Programs & Services
Residents Group

Residents meet regularly to discuss policies, care quality, and activities

CCRC

Part of a Continuing Care Retirement Community offering multiple care levels

Active Resident Council

Organized group of residents that meets regularly to discuss facility policies, quality of life, and activities.

Finances and operations

Based on CMS SNF Cost Report for fiscal year ending in 12/2023.

Nonprofit
Nonprofit Corporation
Net patient revenue Info Net patient revenue — what the home actually collects for resident care, after contractual allowances, bad debt and discounts are subtracted from its gross charges (CMS cost report, Worksheet G-3). It covers resident care only; money the home earns from other sources is shown separately as "Other income."
$24.7M
Net patient income Info Net patient income: net patient revenue minus the home's total operating expenses. A positive figure means it earns more from resident care than it spends to deliver it; a negative figure means the opposite. It excludes non-operating "other income."
-$7.7M
Nonprofit Nonprofit Corporation
Net patient revenue Info Net patient revenue — what the home actually collects for resident care, after contractual allowances, bad debt and discounts are subtracted from its gross charges (CMS cost report, Worksheet G-3). It covers resident care only; money the home earns from other sources is shown separately as "Other income."
$24.7M Rank #41 / 171Revenue — State benchmarkedThis home is ranked 41st out of 171 homes in Illinois. Shows this facility's annual revenue compared to the Illinois average. Higher revenue generally means more resources for staffing and capital — read alongside Payroll %.Rankings are based only on facilities in Illinois that report data for that category. Facilities without available data are excluded from the ranking.Click the rank badge to see the full State ranking.Click here to see the full State ranking.
Net patient income Info Net patient income: net patient revenue minus the home's total operating expenses. A positive figure means it earns more from resident care than it spends to deliver it; a negative figure means the opposite. It excludes non-operating "other income."
-$7.7M
Payroll costs Info Staff salaries plus wage-related costs — benefits such as payroll taxes, health insurance and retirement — from the home's own accounting records (CMS cost report, Worksheet A). Contract or agency labor is counted separately, under other operating costs. Rank #29 / 171Payroll — State benchmarkedThis home is ranked 29th out of 171 homes in Illinois. Shows total annual staff payroll benchmarked to the Illinois average. Higher payroll investment relative to peers often signals better staffing and less reliance on cheaper contract labor.Rankings are based only on facilities in Illinois that report data for that category. Facilities without available data are excluded from the ranking.Click the rank badge to see the full State ranking.Click here to see the full State ranking.
$10.8M 43.6% of net patient revenue Info Payroll as a share of revenue: staff salaries and wage-related benefits divided by net patient revenue. A higher figure means more of each revenue dollar goes to staff pay. Rank #90 / 171Payroll % — State benchmarkedThis home is ranked 90th out of 171 homes in Illinois. Shows payroll as a percentage of revenue versus the Illinois average. Well-run Illinois facilities typically land around 54–67% — the top third Statewide. Below 25% may signal understaffing or heavy agency use — read with Staffing ratings.Rankings are based only on facilities in Illinois that report data for that category. Facilities without available data are excluded from the ranking.Click the rank badge to see the full State ranking.Click here to see the full State ranking.
Other operating costs Info Everything it costs to run the home apart from payroll — food, utilities, supplies, maintenance, contract labor and administration. Calculated as total operating expense minus payroll (staff salaries and wage-related benefits).
$21.6M
Total costs Info The home's total operating expense for the year — all the costs of running it, salaries included (CMS cost report, Worksheet G-3).
$32.4M

What does this home offer?

Minimum age icon
Minimum age icon

Minimum Age: 62 Years Old

Pets allowed icon
Pets allowed icon

Pets Allowed

Housing options icon

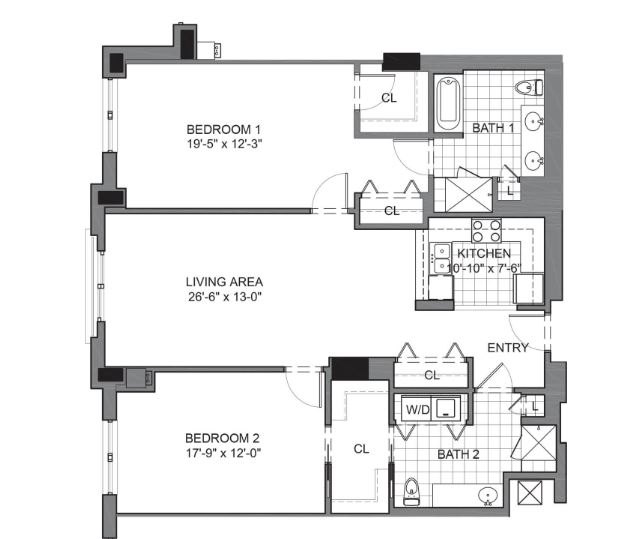
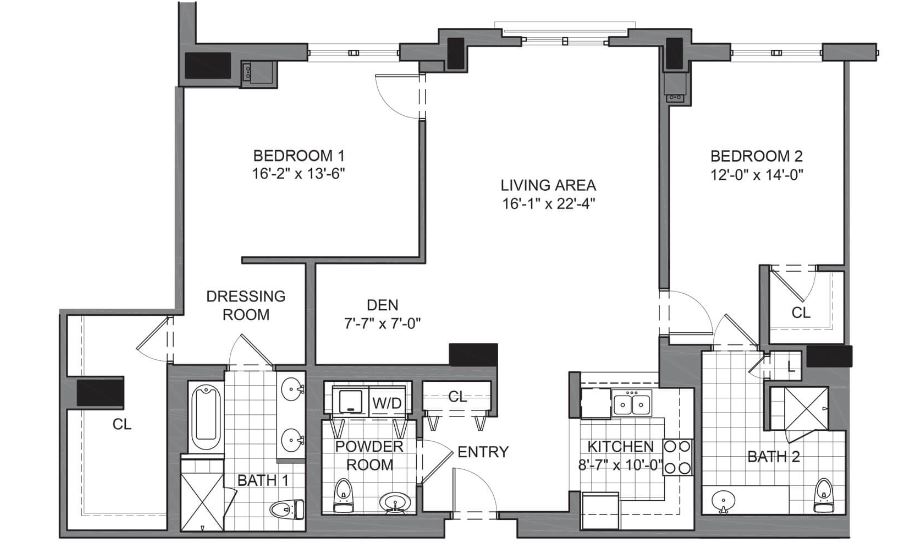
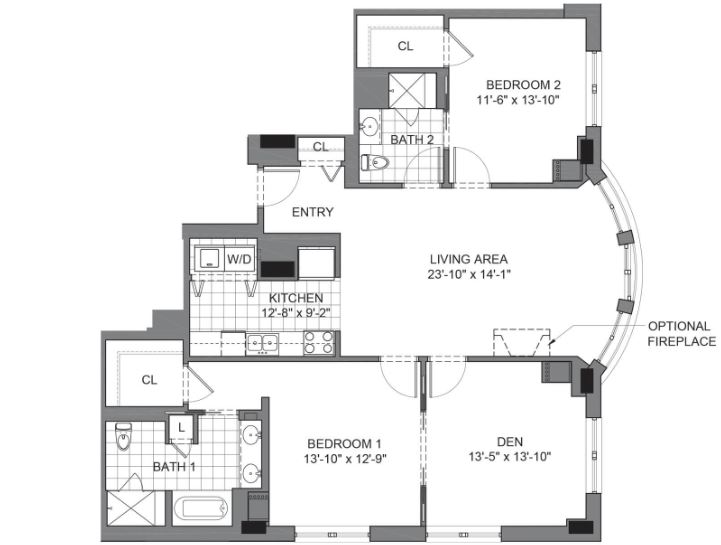
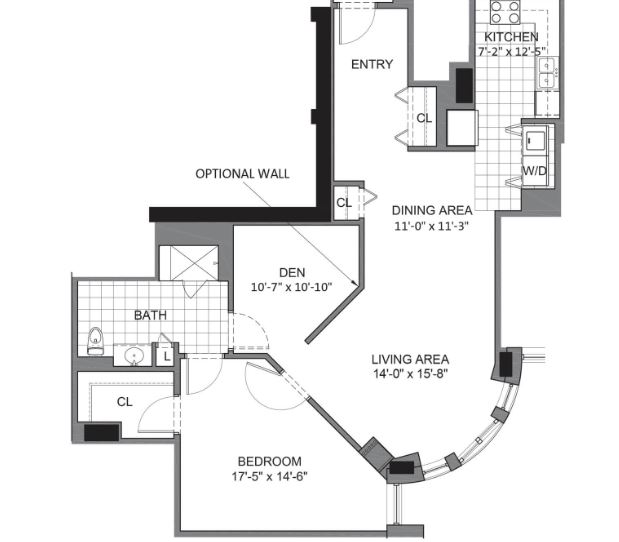
Housing Options: 1 Bed / 2 Bed

Building type icon
Building type icon

Building Type: High-rise

Transportation services icon

Transportation Services

Fitness and recreation icon

Fitness and Recreation

Who this home usually serves

TYPE OF STAY

Mix of rehab and long-term care

This home supports both short-term rehab and long-term care, with residents staying for a wide range of durations.

Most new residents arrive under private pay (55% of admissions), and a typical private pay stay runs around 6 - 7 months.

Admissions
84 total

Coverage residents most often arrive under.

Medicare 45%
Private pay 55%
Discharges
73 total

Coverage residents most often leave under.

Medicare 27%
Private pay 73%

Living Spaces & Floor Plans for The Mather

The Mather Plan 3
The Mather Plan 2
The Mather Plna 1
The Mather Plan 4

Places of interest near The Mather

Address 0.6 miles from city center Info Estimated distance in miles from Evanston's city center to The Mather's address, calculated via Google Maps. — 8 miles to nearest hospital (Ascension Saint Joseph - Chicago)

Calculate Travel Distance to The Mather

Add your location

Address

Compare Nursing Homes around Evanston

The information below is reported by the Illinois Department of Public Health, Office of Health Care Regulation.

5 facilities compared · CMS & IL Dept. of Health data

Westminster Place
NH
AL
IL
MC
RC
Evanston (Grant Street)
105
Facility 105
IL AVG 86
Rank #116 / 426
64.8%
Facility 64.8%
IL AVG 69.3%
Rank #140 / 204
-6%
5.50
Facility 5.50
IL AVG 3.10
Rank #9 / 172
+47%+77%
$0
Facility $0
IL AVG $151.3k
Rank #1 / 173
7
Facility 7
IL AVG 36.8
Rank #5 / 172
2.3
Facility 2.3
IL AVG 3.7
Rank #15 / 172
-60-
44
Facility 44
IL AVG 51
Rank #392 / 648
Presbyterian Homes
$26.3M
Facility $26.3M
IL AVG $12.2M
Rank #2 / 171
$15.3M
Facility $15.3M
IL AVG $4.8M
Rank #8 / 171
58.2%
Facility 58.2%
IL AVG 44.3%
Rank #167 / 171
145026
The Mather
NH
AL
IL
MC
Evanston (Davis Street)
22
Facility 22
IL AVG 86
Rank #401 / 426
76.3%
Facility 76.3%
IL AVG 69.3%
Rank #95 / 204
+10%
5.88
Facility 5.88
IL AVG 3.10
Rank #5 / 172
+102%+90%
$0
Facility $0
IL AVG $151.3k
Rank #1 / 173
7
Facility 7
IL AVG 36.8
Rank #5 / 172
3.5
Facility 3.5
IL AVG 3.7
Rank #82 / 172
-30-
95
Facility 95
IL AVG 51
Rank #18 / 648
Mather Senior Living Communities LLC
$24.7M
Facility $24.7M
IL AVG $12.2M
Rank #41 / 171
$10.8M
Facility $10.8M
IL AVG $4.8M
Rank #29 / 171
43.6%
Facility 43.6%
IL AVG 44.3%
Rank #90 / 171
146145
Dobson Plaza Rehabilitation and Healthcare
NH
NC
PC
RC
Evanston (Dodge Avenue)
97
Facility 97
IL AVG 86
Rank #132 / 426
--
2.39
Facility 2.39
IL AVG 3.10
Rank #137 / 172
+45%-23%
$0
Facility $0
IL AVG $151.3k
Rank #1 / 173
16
Facility 16
IL AVG 36.8
Rank #24 / 172
5.3
Facility 5.3
IL AVG 3.7
Rank #154 / 172
184A+
74
Facility 74
IL AVG 51
Rank #135 / 648
Charlotte Kohn
-
Facility -
IL AVG $12.2M
Rank #171 / 171
$4.5M
Facility $4.5M
IL AVG $4.8M
Rank #147 / 171
-
Facility -
IL AVG 44.3%
Rank #1 / 171
145122
Aperion Care Evanston
NH
AL
HC
MC
NC
PC
Evanston
57
Facility 57
IL AVG 86
Rank #275 / 426
82.5%
Facility 82.5%
IL AVG 69.3%
Rank #73 / 204
+19%
2.09
Facility 2.09
IL AVG 3.10
Rank #157 / 172
+11%-33%
$52.2k
Facility $52.2k
IL AVG $151.3k
Rank #108 / 173
28
Facility 28
IL AVG 36.8
Rank #69 / 172
2.3
Facility 2.3
IL AVG 3.7
Rank #15 / 172
253A+
88
Facility 88
IL AVG 51
Rank #50 / 648
-
$5.8M
Facility $5.8M
IL AVG $12.2M
Rank #155 / 171
$3.2M
Facility $3.2M
IL AVG $4.8M
Rank #160 / 171
54.5%
Facility 54.5%
IL AVG 44.3%
Rank #68 / 171
146058
Three Crowns Park
NH
AL
MC
RC
Evanston (Mcdaniel Avenue)
18
Facility 18
IL AVG 86
Rank #405 / 426
--
7.33
Facility 7.33
IL AVG 3.10
Rank #2 / 172
+68%+137%
$0
Facility $0
IL AVG $151.3k
Rank #1 / 173
2
Facility 2
IL AVG 36.8
Rank #1 / 172
1.0
Facility 1.0
IL AVG 3.7
Rank #1 / 172
125-
68
Facility 68
IL AVG 51
Rank #163 / 648
Three Crowns Park---146199

Financial Assistance for
Nursing Home in Illinois

The Mather is located in Evanston, Illinois.
Here are the financial assistance programs available to residents in Illinois.

Get Financial aid guidance

Community Care Program

Illinois CCP

Age 60+
General Illinois resident, at risk of nursing home placement.
Income Limits (2025) ~$1,215/month individual
Asset Limits $17,500 individual, excludes home, car
IL

High demand in urban areas; waitlists possible.

Benefits
In-home care (3-5 hours/day) Adult day services ($65/day) Emergency home response systems ($30/month)

Illinois Respite Program

IL Respite (via NFCSP)

Age Caregiver of someone 60+ (or with dementia)
General Illinois resident.
Income Limits No strict limit; prioritizes low-income.
Asset Limits Not applicable.
IL

Limited slots; urban/rural balance.

Benefits
In-home respite (4-6 hours/day) Adult day care (~$65/day) Short-term facility care (up to 5 days)

Supportive Living Program (SLP)

Illinois Medicaid Supportive Living Program

Age 65+ or 22-64 with disability
General Illinois resident, Medicaid-eligible, needs moderate assistance (not nursing home-level).
Income Limits (2025) ~$2,829/month (300% FBR, individual); QIT allowed.
Asset Limits $2,000 (individual), $3,000 (couple) (excludes home, car).
IL

~200 SLP sites statewide; room/board not covered.

Benefits
Personal care (5-7 hours/day, e.g., bathing, mobility) Meals Housekeeping Medication management Respite (~240 hours/year)

Persons Who Are Elderly Waiver

Illinois Medicaid Elderly Waiver

Age 65+
General Illinois resident, Medicaid-eligible, nursing home-level care need.
Income Limits (2025) ~$2,829/month 300% FBR, individual
Asset Limits $2,000 (individual), $3,000 (couple).
IL

Part of HealthChoice Illinois; consumer-directed options available.

Benefits
Personal care (5-7 hours/day, e.g., dressing, eating) Homemaker Adult day care (~$60/day) Respite (240 hours/year) Home mods ($1,000 avg.)

Medicare Savings Program (MSP)

Illinois Medicare Savings Program

Age 65+ or disabled
General Illinois resident, Medicare Part A/B.
Income Limits (2025) ~$2,510/month (QMB), ~$3,380/month (SLMB), ~$3,598/month (QI)—individual.
Asset Limits $9,430 (individual), $14,130 (couple).
IL

Three tiers; no waitlist.

Benefits
Covers Part B premiums ($174.70/month) Deductibles ($240/year) Copays (~20%)

Optional State Supplementation (OSS)

Illinois Optional State Supplementation

Age 65+ or disabled
General Illinois resident, in approved facility, SSI recipient or low-income.
Income Limits (2025) ~$1,004/month including SSI
Asset Limits $2,000 (individual), $3,000 (couple).
IL

~$50-$500/month based on facility type.

Benefits
Cash (~$50-$500/month) for room/board in personal care homes or SLFs

VA Aid and Attendance (A&A) and Housebound Benefits

Illinois VA Aid and Attendance/Housebound

Age 65+ or disabled veteran/spouse
General Illinois resident, wartime service, need for ADL help (A&A) or homebound.
Income Limits (2025) Net income < ~$1,984/month (veteran with dependent, A&A); pension offsets income.
Asset Limits ~$155,356 net worth limit
IL

High veteran demand in urban/rural areas.

Benefits
Cash (~$1,433-$2,642/month veteran, ~$951-$1,318 spouse) for care costs (e.g., in-home, assisted living)

Frequently Asked Questions about The Mather

What neighborhood is The Mather in?

The Mather is in the Davis Street neighborhood of Evanston.

Who is the owner of The Mather?

The legal owner and operator of The Mather is The Mather Evanston.

Is The Mather in a walkable area?

The Mather has a walk score of 95. Walker's paradise. Daily errands do not require a car, with many shops and services nearby.

What is the license number of The Mather?

According to IL state health department records, The Mather's license number is 5103350.

When does The Mather's license expire?

According to IL state health department records, The Mather's license expires on July 22, 2026.

What is the occupancy rate at The Mather?

The Mather's occupancy is 76%.

Does The Mather operate as a for-profit or non-profit?

The Mather is registered as a non-profit in IL.

Guides for Better Senior Living

Care Cost Calculator: See Prices in Your Area

Nursing Home Data Explorer

Don’t Wait Too Long: 7 Red Flag Signs Your Parent Needs Assisted Living Now

The True Cost of Assisted Living in 2025 – And How Families Are Paying For It

Understanding Senior Living Costs: Pricing Models, Discounts & Financial Assistance