Dresher Hill Health & Rehabilitation Center

Nursing Home in Dresher

CMS overall rating Info The Overall CMS Rating is scored from 1 to 5 stars and combines results from health inspections, staffing levels, and quality measures. Health inspections carry the most weight. Staffing and quality scores can increase or decrease the final rating based on performance compared to state and national standards.
Calculator: See prices in your area
Dresher Hill Health & Rehabilitation Center accepts Medicare, Medicaid, and private pay.

Overview of Dresher Hill Health & Rehabilitation Center

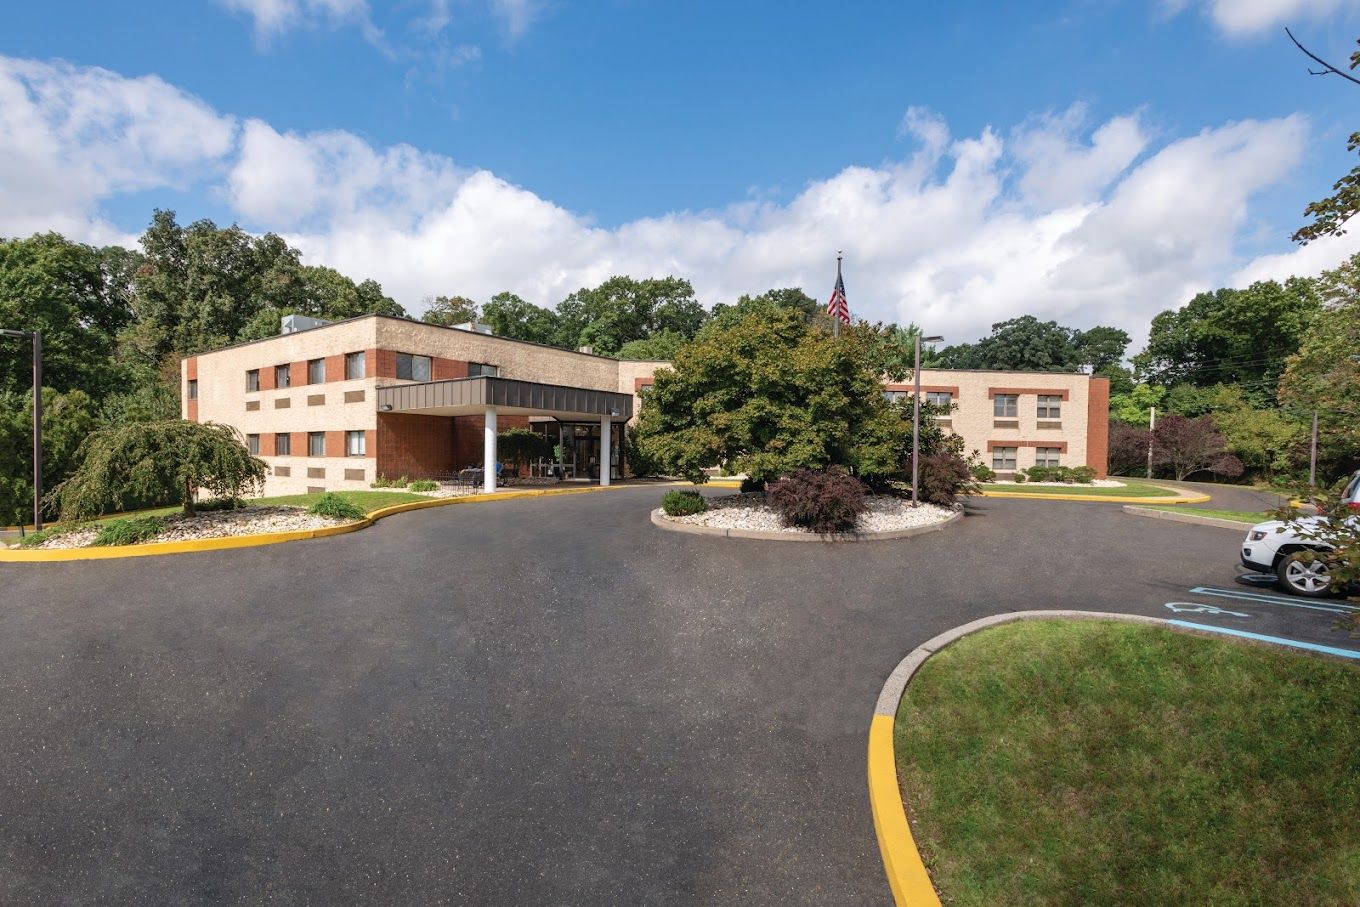
Located in the area of Fort Washington, PA, Dresher Hill Health & Rehabilitation Center is a remarkable senior living community, offering skilled nursing, short-term rehabilitation, and long-term care. The community features an excellent care team that works together to create personalized care plans for residents. Residents in need of recovery support are offered access to services like post-surgical care, cardiac/stroke recovery, IV therapy, and wound care.

The community also encourages families to take part in residents’ care processes, giving residents peace of mind. Residents’ care plans are continuously adjusted to match their ever-changing needs. At Dresher Hill Health & Rehabilitation Center, residents are guaranteed to regain their ability to maintain their independence.

(215) 628-3800

Quality ratings

Measured by Centers for Medicare & Medicaid Services (CMS)

Overall rating Info The Overall CMS Rating combines results from health inspections, staffing levels and quality measures. Health inspections carry the most weight. Staffing and quality scores can increase or decrease the final rating based on performance compared to state and national standards.
5/5 ▲ 2.0 Pennsylvania average: 3.0/5
Health Inspection Info Based on the results of the facility's three most recent standard inspections and any complaint investigations. CMS reviews the number, scope, and severity of deficiencies, with more recent findings weighted more heavily.
4/5 ▲ 1.2 Pennsylvania average: 2.8/5
Staffing Info Measures average nursing staff hours per resident per day, including Registered Nurses (RNs) and total nursing staff. Ratings are adjusted based on the level of care residents require and are compared to state and national benchmarks.
4/5 ▲ 0.6 Pennsylvania average: 3.4/5
Quality Measures Info Based on clinical and physical health indicators reported to CMS, such as hospital readmissions, falls, pressure ulcers, and improvements in mobility. These measures reflect how well residents' health needs are being managed.
5/5 ▲ 1.6 Pennsylvania average: 3.4/5

Staffing hours breakdown

Info Daily nursing hours per resident by staff type, reported to CMS. Higher is generally better — compare this facility to state and national averages to see where staffing stands.

Hours per resident per day — compared to Pennsylvania state averages

Total nursing care / resident Info This home is ranked 94th out of 167 homes in Pennsylvania.

Total adjusted nursing hours per resident per day, combining RN, LPN, and aide time. CMS adjusts this for case-mix so facilities can be fairly compared.
4h 6m per day
Rank #94 / 167Nurse hours — state benchmarkedThis home is ranked 94th out of 167 homes in Pennsylvania.Shows adjusted nurse hours per resident per day benchmarked to the Pennsylvania average, with a ranking across 167 Pennsylvania SNFs. More hours mean more direct care. The national average is about 3.5 hrs; below 3.0 is a red flag.
This facility Pennsylvania avg (4h 9m per day)
vs Pennsylvania avg
-1%

6 of 6 metrics below state avg

Staff typeHours / dayvs state avg
Registered Nurse (RN) Info RNs hold the highest nursing license and can assess residents, interpret test results, and direct care plans. More RN hours per day often signals stronger clinical oversight and faster response to health changes. 31m per day ▼ 34% State avg: 47m per day · National avg: 41m per day
LPN / LVN Info Licensed Practical Nurses (LPNs) or Licensed Vocational Nurses (LVNs) deliver routine hands-on care — medication administration, wound dressing, and monitoring vital signs. They work under RN supervision and make up a large share of daily bedside care. 52m per day ▼ 5% State avg: 55m per day · National avg: 52m per day
Nurse Aide Info Certified Nurse Aides (CNAs) provide the most direct day-to-day assistance: bathing, dressing, feeding, and mobility. Nurse aide hours are typically the largest staffing category and directly affect residents' quality of life. 2h 1m per day ▼ 8% State avg: 2h 12m per day · National avg: 2h 21m per day
Total Nursing (Weekend) Info Combined nursing hours (RN + LPN + Nurse Aide) per resident per day on weekends. Staffing often drops on weekends — this figure reveals whether the facility maintains adequate coverage outside of weekday hours. 3h 13m per day ▼ 9% State avg: 3h 31m per day · National avg: 3h 26m per day
Physical Therapist Info Hours per resident per day provided by licensed Physical Therapists (PTs) or PT Assistants. PT services help residents recover mobility after injury or illness and are especially important for post-acute (short-stay) rehabilitation. 3m per day ▼ 50% State avg: 6m per day · National avg: 4m per day
RN (Weekend) Info Registered nurse hours specifically on weekends. Facilities sometimes reduce RN presence on Saturdays and Sundays — a low weekend RN figure compared to weekday hours can indicate reduced clinical oversight when most administrative staff are absent. 18m per day ▼ 45% State avg: 33m per day · National avg: 29m per day

Capacity and availability

This home usually has availability

Occupancy lower than 85% suggests more openings may be available.

Higher occupancy than the Pennsylvania average: 78.7%
Occupancy rate 80.9% Rank #52 / 170Occupancy rate — state benchmarkedThis home is ranked 52nd out of 170 homes in Pennsylvania.Shows this facility's occupancy rate versus the Pennsylvania average, with its statewide rank out of 170. Higher occupancy signals strong local demand and financial stability.
Avg. Length of Stay 176 days
Occupancy rate
80.9% Rank #52 / 170Occupancy rate — state benchmarkedThis home is ranked 52nd out of 170 homes in Pennsylvania.Shows this facility's occupancy rate versus the Pennsylvania average, with its statewide rank out of 170. Higher occupancy signals strong local demand and financial stability.
Avg. Length of Stay
176 days

Who this home usually serves

TYPE OF STAY

Primarily short stays

Residents typically stay for brief periods, with frequent admissions and discharges throughout the year.

Breakdown by payment type

Medicare

24% of new residents, usually for short-term rehab.

Typical stay 19 days

Private pay

60% of new residents, often for short stays.

Typical stay 1 - 2 months

Medicaid

16% of new residents, often for long-term daily care.

Typical stay 2 - 3 years

Finances and operations

Privately-owned community
Operated by a business corporation.
Home revenue
$14.2M
Operating loss
-$601.3K
Privately-owned community Operated by a business corporation.
Home revenue
$14.2M Rank #120 / 169Revenue — state benchmarkedThis home is ranked 120th out of 169 homes in Pennsylvania.Shows this facility's annual revenue compared to the Pennsylvania SNF average. Higher revenue generally means more resources for staffing and capital — read alongside Payroll %.
Operating loss
-$601.3K
Payroll costs Info The portion of the home's budget spent on staff, including nurses, caregivers, and other employees who support care and operations. Rank #114 / 169Payroll — state benchmarkedThis home is ranked 114th out of 169 homes in Pennsylvania.Shows total annual staff payroll benchmarked to the Pennsylvania average. Higher payroll investment relative to peers often signals better staffing and less reliance on cheaper contract labor.
$6.1M
42.8% of revenue Rank #61 / 168Payroll % — state benchmarkedThis home is ranked 61st out of 168 homes in Pennsylvania.Shows payroll as a percentage of revenue versus the Pennsylvania average. Well-run SNFs often land around 55–65%. Below 25% may signal understaffing or heavy agency use — read with Staffing ratings.
Other operating costs Info All remaining costs needed to run the home, such as food, utilities, building maintenance, supplies and administrative expenses.
$8.7M
Total costs $14.8M
Walk Score
Walk Score: 31 / 100 Rank #61 / 95Walk Score — state benchmarkedThis home is ranked 61st out of 95 homes in Pennsylvania.Shows how walkable this facility's neighborhood is compared to the average Walk Score across Pennsylvania SNFs. Higher scores benefit residents, families, and staff.
Somewhat walkable. A few nearby services may be reachable on foot, but most trips require transportation.

About this community

License Details

Accreditations2024 recipient of the Bronze – Commitment to Quality Award by the American Health Care Association and National Center for Assisted Living (AHCA/NCAL)

Therapy & Rehabilitation

2 services
Rehabilitation Services
Respite Care

Staffing & Medical

1 service
24-Hour Staffing

Additional Services

1 service
Personal Care

Amenities & Lifestyle

Specific ProgramsPhysical Therapy, Occupational Therapy, Speech Therapy, Cardiac Care, 24-hour Skilled Nursing Care

What does this home offer?

Accepts Medicaid icon

Accept Medicaid: Yes, Accept

Total residents icon

Total Residents: 118 Residents

Housing options icon

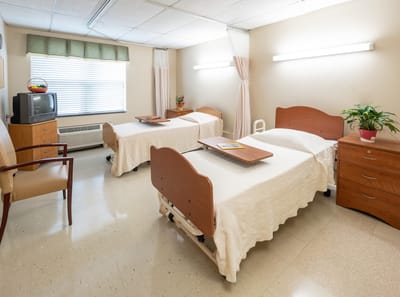
Housing Options: Private / Semi-Private Rooms

Building type icon
Building type icon

Building Type: 2-story

Types of Care at Dresher Hill Health & Rehabilitation Center

Nursing Home

Contact Dresher Hill Health & Rehabilitation Center

Health Inspection History

Inspections
Total health inspections 3

Pennsylvania average 6.7


Last Health inspection on Jan 2024

Total health citations
14 Rank #74 / 167Health citations — state benchmarkedThis home is ranked 74th out of 167 homes in Pennsylvania.Shows this facility's total health deficiency citations benchmarked to the Pennsylvania state average, with a ranking across all 167 PA SNFs. Lower citation counts earn a better rank.

Pennsylvania average 31.3

Citations per inspection
4.67 Rank #109 / 167Citations per inspection — state benchmarkedThis home is ranked 109th out of 167 homes in Pennsylvania.Shows average deficiency citations per CMS inspection for this facility versus the Pennsylvania mean across 167 SNFs with citation data. Lower is better.

Pennsylvania average 4.4


Health citations are formal notices following inspections when they fail to comply with safety and care standards.

All 14 citations resulted from standard inspections.

Breakdown of citation severity (last 3 years)
Critical Health citations More info
0
100% better than Pennsylvania average

Pennsylvania average: 0.3


Serious Health citations More info 0
100% better than Pennsylvania average

Pennsylvania average: 0.6

0 critical citations More info Pennsylvania average: 0.3

0 serious citations More info Pennsylvania average: 0.6

14 moderate citations More info Pennsylvania average: 29.5

0 minor citations More info Pennsylvania average: 0.8
Citations history (last 3 years)
Pharmacy moderate citation Info Issues related to medication management, including how drugs are stored, administered, and monitored. Jan 05, 2024
Corrected

Pharmacy moderate citation Info Issues related to medication management, including how drugs are stored, administered, and monitored. Jan 27, 2023
Corrected

Quality of Care moderate citation Info Issues related to how well residents receive appropriate treatment and support for their medical and daily care needs. Jan 27, 2023
Corrected

Care Planning moderate citation Info Issues related to creating and updating personalized care plans for residents based on their needs and conditions. Jan 27, 2023
Corrected

Financial Assistance for
Nursing Home in Pennsylvania

Dresher Hill Health & Rehabilitation Center is located in Fort Washington, Pennsylvania.
Here are the financial assistance programs available to residents in Pennsylvania.

Get Financial aid guidance

Community HealthChoices (CHC)

PA Medicaid CHC

Age 65+ or disabled
General Pennsylvania resident, Medicaid-eligible, nursing home-level care need.
Income Limits (2025) ~$2,829/month 300% FBR, individual
Asset Limits $2,000 (individual), $3,000 (couple) (excludes home, car).
PA

Managed care model; high urban demand (e.g., Philadelphia, Pittsburgh).

Benefits
Personal care (5-7 hours/day, e.g., bathing, dressing) Respite care (up to 240 hours/year) Adult day care ($70/day) Home modifications ($1,500 avg.)

Pennsylvania OPTIONS Program

PA OPTIONS

Age 60+
General Pennsylvania resident, at risk of nursing home placement.
Income Limits ~$2,000/month individual, varies by region
Asset Limits $8,000 individual
PA

Cost-sharing required above certain income; rural/urban balance.

Benefits
In-home care (3-5 hours/week) Respite (up to 10 days/year) Adult day care (~$70/day) Transportation (~5 trips/month)

Living Independence for the Elderly (LIFE)

Pennsylvania LIFE (PACE)

Age 55+
General PA resident (specific counties), NFLOC, safe with LIFE support.
Income Limits (2025) ~$2,829/month (Medicaid-eligible); private pay option available.
Asset Limits $2,000 (individual), $3,000 (couple) for Medicaid enrollees.
PA

16 providers in 25 counties (e.g., Allegheny, Luzerne); LIFE branding unique to PA.

Benefits
Personal care (5-7 hours/day) Medical care Meals Transportation Respite Therapies

Medicare Savings Program (MSP)

Pennsylvania Medicare Savings Program

Age 65+ or disabled
General PA resident, Medicare Part A/B.
Income Limits (2025) ~$2,510/month (QMB), ~$3,380/month (SLMB), ~$3,598/month (QI)—individual.
Asset Limits $9,430 (individual), $14,130 (couple).
PA

Three tiers; includes Extra Help for Part D; no waitlist.

Benefits
Covers Part B premiums ($174.70/month) Deductibles ($240/year) Copays (~20%)

Low-Income Home Energy Assistance Program (LIHEAP)

Pennsylvania LIHEAP

Age 60+ prioritized
General PA resident, low-income household.
Income Limits (2025) ~$3,970/month individual, 185% FPL
Asset Limits Not assessed; income-focused.
PA

Cash grants and crisis aid; serves ~600,000 households annually.

Benefits
Heating/cooling aid ($300-$1,000/season) Crisis aid ($500 max)

Family Caregiver Support Program (FCSP)

Pennsylvania Family Caregiver Support Program

Age
General Caregivers of 60+ needing care or 55+ caregivers of others; PA resident; functional needs (2+ ADLs).
Income Limits (2025) No strict cap; reimbursements up to $600/month if care recipient income < ~$2,322/month 185% FPL
Asset Limits Not assessed; need-based.
PA

High demand; includes grandparent caregivers.

Benefits
Respite (4-6 hours/week or 5 days/year) Adult day care ($60/day) Supplies (~$2,000/year) Caregiver training

Senior Community Service Employment Program (SCSEP)

Pennsylvania SCSEP

Age 55+
General unemployed, low-income, PA resident.
Income Limits (2025) ~$1,983/month 125% FPL
Asset Limits Not specified; income-focused.
PA

Priority for veterans, rural residents; AARP partnership.

Benefits
Paid training (~20 hours/week at ~$7.25/hour) Job placement

VA Aid and Attendance (A&A) and Housebound Benefits

Pennsylvania VA Aid and Attendance/Housebound

Age 65+ or disabled veteran/spouse
General PA resident, wartime service, need for ADL help (A&A) or homebound.
Income Limits (2025) Net income < ~$1,984/month (veteran with dependent, A&A); pension offsets income.
Asset Limits ~$155,356 net worth limit
PA

High veteran population; supports rural/urban care needs.

Benefits
Cash (~$1,433-$2,642/month veteran, ~$951-$1,318 spouse) for care costs (e.g., in-home, assisted living)

Property Tax/Rent Rebate Program (PTRR)

Pennsylvania Property Tax/Rent Rebate Program

Age 65+
General PA resident, homeowner/renter (or widow/er 50+, disabled 18+).
Income Limits (2025) ~$45,000/year individual or couple, excludes half of Social Security
Asset Limits Not assessed; income-focused.
PA

Rebates up to $1,000; ~600,000 eligible annually.

Benefits
Rebates ($250-$1,000 based on income; e.g., $1,000 if income < $8,000)

Senior Farmers’ Market Nutrition Program (SFMNP)

Pennsylvania SFMNP

Age 60+
General PA resident, low-income.
Income Limits (2025) ~$2,322/month individual, 185% FPL
Asset Limits Not assessed.
PA

Vouchers (~$50/season) via 52 AAAs; serves ~200,000 annually.

Benefits
Vouchers (~$50/season) for fresh produce at approved markets

Places of interest near Dresher Hill Health & Rehabilitation Center

Address 1.3 mile from city center

Calculate Travel Distance to Dresher Hill Health & Rehabilitation Center

Add your location

Address

Staffing Data (Q2 2025)

This data corresponds to Q2 2025 and is based on CMS Payroll-Based Journal.

Total staff 251
Employees 71
Contractors 180
Staff to resident ratio 2.39:1
23% better than Pennsylvania average

Pennsylvania average ratio: 1.94:1

Avg staff/day 55
Average shift 7.8 hours
0% compared with Pennsylvania average

Pennsylvania average: 7.8 hours

Total staff hours (quarter) 39,085
Nursing staff breakdown
Registered Nurse

Manages medical care and health needs.

Total count 17
Average shift length Info Average shift length. Calculated as total hours divided by days worked and average staff per day. 7.9 hours

This role is partially covered by contractors.

Licensed Practical Nurse

Assists with medical care and medications.

Total count 54
Average shift length Info Average shift length. Calculated as total hours divided by days worked and average staff per day. 7.5 hours

This role is partially covered by contractors.

Certified Nursing Assistant

Helps with daily care and mobility.

Total count 147
Average shift length Info Average shift length. Calculated as total hours divided by days worked and average staff per day. 8.2 hours

This role is partially covered by contractors.

Contractor staffing

Total hours from contractors

29.4%

11,508 contractor hours this quarter

Certified Nursing Assistant: 119 Licensed Practical Nurse: 29 Registered Nurse: 9 Occupational Therapy Assistant: 4 Physical Therapy Aide: 3 Physical Therapy Assistant: 3 Respiratory Therapy Technician: 3 Occupational Therapy Aide: 3 Clinical Nurse Specialist: 2 Speech Language Pathologist: 2 Qualified Social Worker: 2 Medical Director: 1
Staff by category
Certified Nursing Assistant2811914720,63591100%8.2
Licensed Practical Nurse2529548,75891100%7.5
Registered Nurse89172,87991100%7.9
Clinical Nurse Specialist3251,3836774%8
Other Dietary Services Staff2029208998%7.5
Physical Therapy Assistant0336396571%7.8
Respiratory Therapy Technician0335216875%7.7
Administrator1015046369%8
Dental Services Staff1015046066%8.4
Dietitian1014886167%8
Nurse Practitioner1014886167%8
Speech Language Pathologist0224876167%8
Physical Therapy Aide0332885055%5.6
Occupational Therapy Aide1342532325%7.7
Qualified Social Worker0222323437%6.8
Occupational Therapy Assistant044604347%1.2
Medical Director011482831%1.7
147 Certified Nursing Assistant
% of Days 100%
54 Licensed Practical Nurse
% of Days 100%
17 Registered Nurse
% of Days 100%
5 Clinical Nurse Specialist
% of Days 74%
2 Other Dietary Services Staff
% of Days 98%
3 Physical Therapy Assistant
% of Days 71%
3 Respiratory Therapy Technician
% of Days 75%
1 Administrator
% of Days 69%
1 Dental Services Staff
% of Days 66%
1 Dietitian
% of Days 67%
1 Nurse Practitioner
% of Days 67%
2 Speech Language Pathologist
% of Days 67%
3 Physical Therapy Aide
% of Days 55%
4 Occupational Therapy Aide
% of Days 25%
2 Qualified Social Worker
% of Days 37%
4 Occupational Therapy Assistant
% of Days 47%
1 Medical Director
% of Days 31%

Facility Characteristics

Source: CMS Long-Term Care Facility Characteristics (Data as of Jan 2026)

Total residents 105
Medicare
9
8.6% of residents
Medicaid
87
82.9% of residents
Private pay or other
9
8.6% of residents
Programs & Services
Residents Group

Residents meet regularly to discuss policies, care quality, and activities

Active Resident Council

Organized group of residents that meets regularly to discuss facility policies, quality of life, and activities.

Quality of care over time

These measures show how residents usually do over time at this home, based on health outcomes and preventive care.

High-risk clinical events score Info A composite score based on pressure ulcers, falls with injury, weight loss, walking ability decline, and activities of daily living decline. 7.7
30% better than Pennsylvania average

Pennsylvania average: 11.0

Functional decline score Info A composite score based on activities of daily living decline, walking ability decline, and incontinence. 16.4
26% better than Pennsylvania average

Pennsylvania average: 22.2

Long-stay resident measures
Significantly above average Pennsylvania avg: 3.7 Info CMS star rating based on long-stay quality measure performance. 5 stars = significantly above average, 1 star = significantly below average.
Need for Help with Daily Activities Increased Info Percent of long-stay residents whose need for help with daily activities has increased 14.9%
22% better than Pennsylvania average

Pennsylvania average: 19.0%

Walking Ability Worsened Info Percent of long-stay residents whose ability to move independently worsened 12.6%
40% better than Pennsylvania average

Pennsylvania average: 21.1%

Low Risk Residents with Bowel/Bladder Incontinence Info Percent of low risk long-stay residents who lose control of their bowels or bladder 21.9%
18% better than Pennsylvania average

Pennsylvania average: 26.7%

Falls with Major Injury Info Percent of long-stay residents experiencing one or more falls with major injury 1.3%
60% better than Pennsylvania average

Pennsylvania average: 3.2%

High Risk Residents with Pressure Ulcers Info Percent of long-stay high risk residents with pressure ulcers 6.6%
20% worse than Pennsylvania average

Pennsylvania average: 5.5%

Urinary Tract Infection Info Percent of long-stay residents with a urinary tract infection 0.5%
70% better than Pennsylvania average

Pennsylvania average: 1.8%

Lost Too Much Weight Info Percent of long-stay residents who lose too much weight 3.0%
55% better than Pennsylvania average

Pennsylvania average: 6.6%

Depressive Symptoms Info Percent of long-stay residents who have depressive symptoms 0.6%
90% better than Pennsylvania average

Pennsylvania average: 5.5%

Antipsychotic Use Info Percent of long-stay residents who received an antipsychotic medication 7.7%
55% better than Pennsylvania average

Pennsylvania average: 17.1%

Pneumococcal Vaccine Info Percent of long-stay residents assessed and appropriately given the pneumococcal vaccine 67.1%
23% worse than Pennsylvania average

Pennsylvania average: 86.9%

Influenza Vaccine Info Percent of long-stay residents assessed and appropriately given the seasonal influenza vaccine 100.0%
7% better than Pennsylvania average

Pennsylvania average: 93.5%

Short-stay resident measures
Above average Pennsylvania avg: 3.2 Info CMS star rating based on short-stay quality measure performance. 5 stars = much above average, 1 star = much below average.
Pneumococcal Vaccine Info Percent of short-stay residents assessed and appropriately given the pneumococcal vaccine 49.6%
28% worse than Pennsylvania average

Pennsylvania average: 68.8%

Antipsychotic medication increase Info Percent of short-stay residents who newly received an antipsychotic medication 1.0%
37% better than Pennsylvania average

Pennsylvania average: 1.5%

Influenza Vaccine Info Percent of short-stay residents assessed and appropriately given the seasonal influenza vaccine 90.4%
32% better than Pennsylvania average

Pennsylvania average: 68.7%

Re-hospitalized after SNF stay Info Percentage of short-stay residents who were re-hospitalized after their nursing home admission. 25.6%
11% worse than Pennsylvania average

Pennsylvania average: 23.1%

Emergency department visits Info Percentage of short-stay residents who had an outpatient emergency department visit. 2.4%
76% better than Pennsylvania average

Pennsylvania average: 9.8%

Falls with major injury Info Percentage of SNF residents who experience falls with major injury during their stay. 0.0%
100% better than Pennsylvania average

Pennsylvania average: 0.8%

Ability to care for self at discharge Info Percentage of residents at or above expected ability to care for themselves at discharge. 50.0%
7% worse than Pennsylvania average

Pennsylvania average: 53.7%

Successful return to home or community Info Rate of successful return to home or community from a skilled nursing facility. 48.1%
5% worse than Pennsylvania average

Pennsylvania average: 50.6%

Penalties and fines

Federal penalties imposed by CMS for regulatory violations, including civil money penalties (fines) and denials of payment for new Medicare/Medicaid admissions.

Source: CMS Penalties Database (Data as of Jan 2026)

Total fines amount $12K
80% lower than Pennsylvania average

Pennsylvania average: $59K

Number of fines 1
52% fewer fines than Pennsylvania average

Pennsylvania average: 2.1

Payment Denials Info Serious action where Medicare and/or Medicaid temporarily stops payments for new residents until issues are fixed. 0
100% fewer payment denials than Pennsylvania average

Pennsylvania average: 0.2

Fines amount comparison
This facility $12K
Pennsylvania average $59K
Penalty History

Penalties are imposed by CMS for violations of federal nursing home regulations.

No penalties in the past 3 years

No civil money penalties or payment denials were reported in the last 3 years.

Compare Nursing Homes around Dresher The information below is reported by the Pennsylvania Department of Human Services and Department of Health.

1 facility compared · CMS & PA Dept. of Health data · Updated Apr 2026

Filter by care type
Dresher Hill Health & Rehabilitation Center
AL

Assisted Living A licensed, long-term care setting for seniors or individuals with disabilities who need help with daily activities — like bathing, dressing, and medication management — but not 24-hour skilled nursing. Offers housing, meals, and around-the-clock support while aiming to maximize resident independence.

IL

Independent Living Lifestyle-focused communities for older adults offering dining, activities, and transportation with minimal personal care. Best for active, independent seniors who want community without medical support.

MC

Memory Care Secured, specialized care for people living with Alzheimer's or dementia. Staff trained in cognitive impairment, with higher staff-to-resident ratios and an environment designed to reduce confusion and wandering risk.

NH

Nursing Home Licensed facility providing 24/7 skilled nursing care for residents with complex, ongoing medical needs. Staffed by RNs, LPNs, and CNAs. Inspected and star-rated annually by CMS. Accepts Medicare (short-term rehab) and Medicaid (long-term care).

Fort Washington (Dresher)118 80.9% +3%4.09 -43%-1%1144.70109 31 Quindlen, Stephen$14.2M$6.1M42.8%395509

Guides for Better Senior Living

Care Cost Calculator: See Prices in Your Area

Nursing Home Data Explorer

Don’t Wait Too Long: 7 Red Flag Signs Your Parent Needs Assisted Living Now

The True Cost of Assisted Living in 2025 – And How Families Are Paying For It

Understanding Senior Living Costs: Pricing Models, Discounts & Financial Assistance

Explore Open Rooms
1 Contact details
2 What type of senior care service are you looking for?
3 What budget do you have in mind for senior care?
4 How soon do you need to find care?
5 Additional details

Thank you for your interest!

Our team will be in touch shortly to help with next steps.