El Jen Healthcare and Rehabilitation Services

Nursing Home

El Jen Healthcare and Rehabilitation Services

5538 W Duncan Dr, Las Vegas, NV 89130 View Map
Nursing Home
icon
Care Cost Calculator: See Prices in Your Area Care Cost Calculator: See Prices in Your Area icon
Overview of El Jen Healthcare and Rehabilitation Services

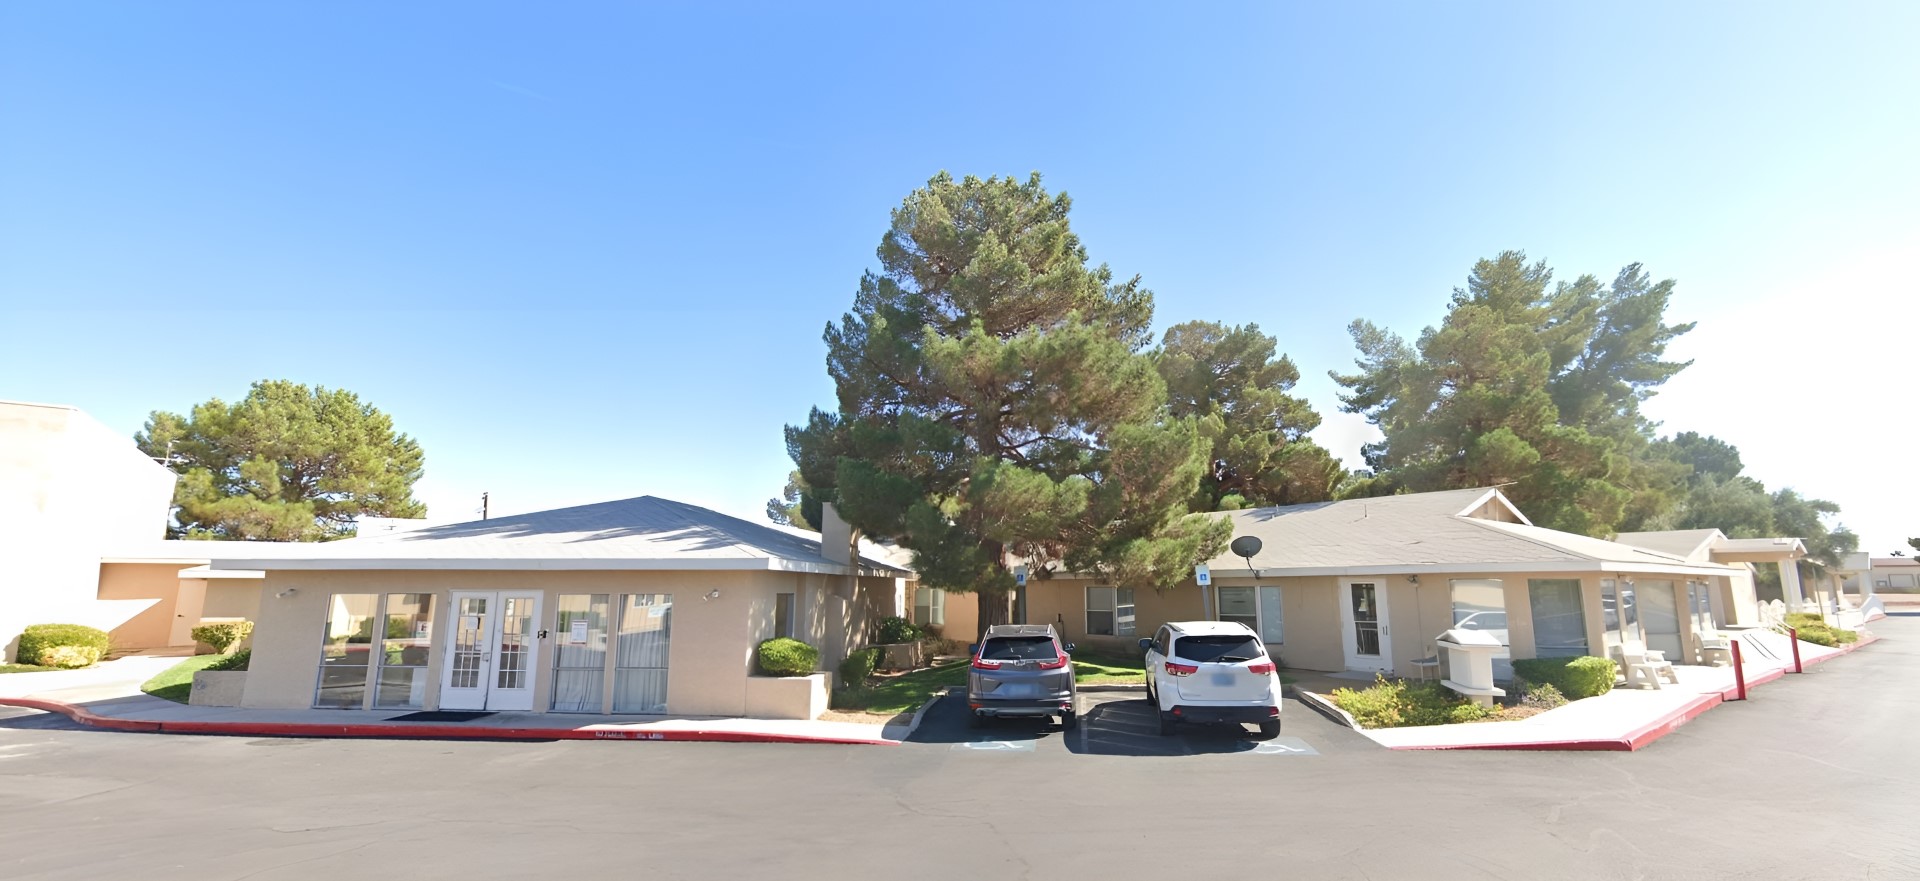
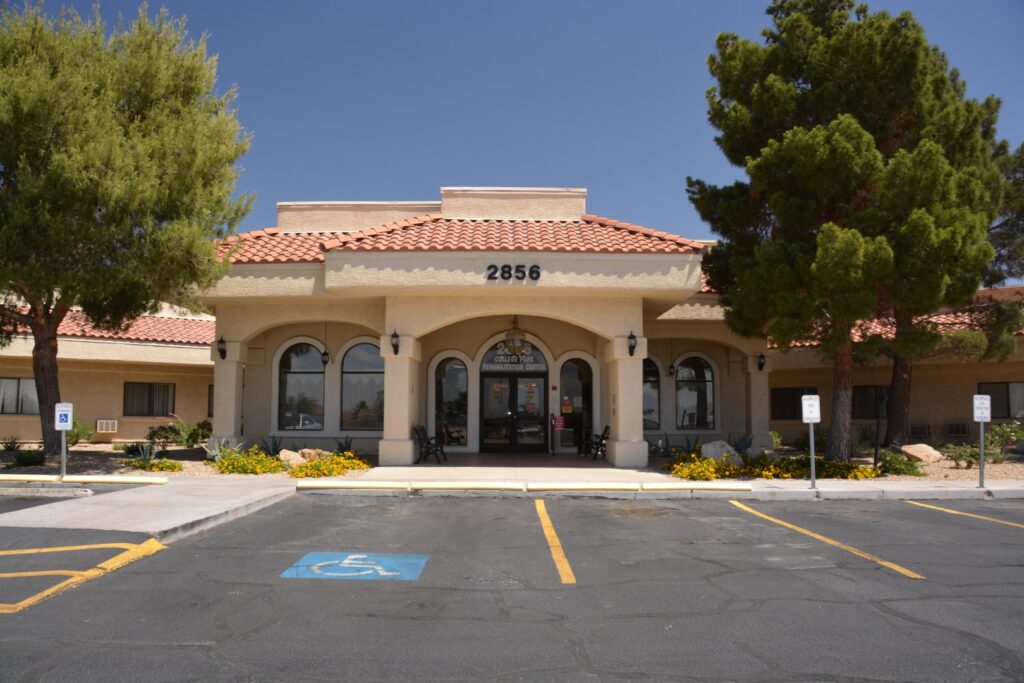
Ideally set in the peaceful neighborhood of Las Vegas, NV, El Jen Healthcare and Rehabilitation Services is a distinct community that offers skilled nursing and rehabilitation. Residents here experience exceptional care for their unique needs with a compassionate and highly trained team available around the clock. Providing care for over 20 years, the community is dedicated to understanding residents’ conditions for better care and comfort.

A well-thought-out calendar of fun activities and engaging events, including live entertainment and community outings, is conducted so residents can live actively and remain socially engaged. The community also features newly added behavior units, ideal for those with behavioral issues. Spend your golden years without worries amidst the community’s nurturing and welcoming spaces.

(702) 645-2606

Quality ratings

Measured by Centers for Medicare & Medicaid Services (CMS)

Overall rating Info Official CMS rating based on health inspections, staffing and quality measures.
2/5
Nevada average: 3.0/5
Health Inspection Info Official CMS rating based on deficiencies found during state health inspections.
2/5
Nevada average: 2.8/5
Staffing Info Official CMS rating based on nurse staffing hours per resident per day.
4/5
Nevada average: 3.1/5
Quality Measures Info Official CMS rating based on clinical outcomes for residents.
2/5
Nevada average: 3.6/5

Nursing care per resident

Info Average daily nursing hours per resident (adjusted for acuity). Higher values indicate more nursing time per resident.
4h 21m per day

This home provides 8% more nursing time per resident than the state average.

Nevada average: 4h 2m per day

Staffing hours breakdown

Info Hours of care per resident per day, broken down by staff type. Data from CMS Medicare.
Staff type Facility State avg National avg
Registered Nurse (RN) Info Registered nurse hours per resident per day. 30m per day 1h 4m per day 41m per day
LPN / LVN Info Licensed Practical Nurse / Licensed Vocational Nurse hours per resident per day. 1h 3m per day 54m per day 52m per day
Nurse Aide Info Nurse aide hours per resident per day. 2h 14m per day 2h 23m per day 2h 21m per day
Total Nursing (Weekend) Info Total number of nurse staff hours per resident per day on weekends. 3h 23m per day 3h 51m per day 3h 26m per day
Physical Therapist Info Physical therapist staff hours per resident per day. 3m per day 5m per day 4m per day
RN (Weekend) Info Registered nurse hours per resident per day on weekends. 21m per day 51m per day 29m per day

Capacity and availability

This home is often near full

That suggests steady demand, but availability may be limited.

Higher demand than most homes in Nevada
Occupancy rate 95.2%
Residents per day (avg) 138
Occupancy rate
95.2%
Residents per day (avg)
138

Who this home usually serves

TYPE OF STAY

Mostly short-term rehab stays

Most residents typically stay for a few weeks or months before returning home or moving on.

Might be optimal for
Short stays Recovery Medicare-covered care

Breakdown by payment type

Medicare

62% of new residents, usually for short-term rehab.

Typical stay 1 months

Private pay

26% of new residents, often for short stays.

Typical stay 1 - 2 months

Medicaid

12% of new residents, often for long-term daily care.

Typical stay 3 years

Finances and operations

Proprietary home
Other
Home revenue
$18.9M
Operating loss
-$1.1M
Proprietary home Other
Home revenue
$18,914,501.00
Operating loss
$-1,062,574.00
Payroll costs Info The portion of the home's budget spent on staff, including nurses, caregivers, and other employees who support care and operations.
$9.3M
49.2% of revenue
Other operating costs Info All remaining costs needed to run the home, such as food, utilities, building maintenance, supplies and administrative expenses.
$10.7M
Total costs $20.0M
Walk Score
Walk Score: 41 / 100
Somewhat walkable. A few nearby services may be reachable on foot, but most trips require transportation.
BBB Rating
BBB Rating: A+ (Not Accredited)
An independent rating from the Better Business Bureau based on factors such as complaint history, transparency, and business practices.
How BBB ratings work

About this community

Staffing

Key information about the people who lead and staff this community.

Leadership

Contact: Mr. James Toomey, President

Care Services

Nursing Services
Rehabilitation Services
Respite Care
Memory Care
Independent Living
Skilled Nursing
Licensed Nurses/CNAs
24-Hour Staffing
Short-Term Rehab

All Levels of Care

Skilled Nursing Care
Rehabilitation Therapy
Memory Support
Respite Stays

Amenities & Lifestyle

24/7 professional nursing care
comfortable accommodations
nutritious meals
engaging activities
medication management
personal care support

Programs & Activities

Specific Programs
Skilled Nursing Care, Rehabilitation Therapy, Memory Support, Respite Stays, Supplementary Care Options

What does this home offer?

Accepts Medicaid icon

Accept Medicaid: Yes

Total residents icon

Total Residents: 132 Residents

Housing options icon

Housing Options: Private / Semi-private Rooms

Building type icon
Building type icon

Building Type: Single-story

Health Programs icon

Health Programs

Types of Care at El Jen Healthcare and Rehabilitation Services

Nursing Home
Contact El Jen Healthcare and Rehabilitation Services

Compare Nursing Homes around Clark County

The information below is reported by the Nevada Department of Health and Human Services, Bureau of Health Care Quality and Compliance.
College Park Rehabilitation Center
SNF

Nursing Homes 24/7 care needed

North Las Vegas
98
No
-
46
AUFIERO, LAUREN
86.6%
$16,400,874.00
$6,424,513.00
39.2%
91.00
5/5
2.7834
5/5
3/5
4/5
1
19
-
+2%
-31%
+6%
Private / Semi-private Rooms
Henderson Health and Rehab
SNF

Nursing Homes 24/7 care needed

Henderson (Valley View)
266
No
-
22
ANDERSON, SETH
89.1%
$34,884,096.00
$13,713,018.00
39.3%
237.00
3/5
3.6583
3/5
3/5
4/5
1
37
1
-9%
-9%
+9%
Private / Semi-private Rooms
Coronado Ridge Skilled Nursing and Rehabilitation Center
SNF

Nursing Homes 24/7 care needed

Henderson
121
No
-
72
JENSEN, RHETT
85.9%
$25,164,523.00
$8,260,126.00
32.8%
-
3/5
-
3/5
-
3/5
-
29
-
+2%
-
+5%
Private / Semi-private Rooms
Canyon Vista Post-Acute
SNF

Nursing Homes 24/7 care needed

Las Vegas (Rhodes Ranch)
120
No
-
36
NEVADA OPCO LLC
91.6%
$34,028,199.00
$10,592,354.00
31.1%
117.50
3/5
3.0264
2/5
2/5
5/5
2
36
1
+50%
-25%
+12%
Private / Semi-private Rooms
El Jen Healthcare and Rehabilitation Services
SNF

Nursing Homes 24/7 care needed

Las Vegas (Rancho)
144
No
A+
41
EL JEN SNF OPERATIONS HOLDINGS LLC
95.2%
$18,556,342.00
$9,302,661.00
50.1%
137.70
2/5
4.3559
2/5
4/5
2/5
-
58
2
-48%
+8%
+17%
Private / Semi-private Rooms

Places of interest near El Jen Healthcare and Rehabilitation Services

Address 6.9 miles from city center

Address 5538 W Duncan Dr, Las Vegas, NV 89130

Calculate Travel Distance to El Jen Healthcare and Rehabilitation Services

Add your location

Address

Staffing Data

Source: CMS Payroll-Based Journal (Q2 2025)

163
Total Staff
143
Employees
20
Contractors
54,166
Total Hours (Quarter)
65
Avg Staff/Day
9.2
Avg Shift (hrs)
Nursing Staff Breakdown
Role Count Avg Shift (hrs) Uses Contractors?
Registered Nurse129.8 No
Licensed Practical Nurse369.6 No
Certified Nursing Assistant719.6 No
Staff by Category
Administration
2 staff
7.3hs shift avg
Nursing Staff
122 staff
9.6hs shift avg
Physicians & Practitioners
11 staff
8.4hs shift avg
Therapy Services
18 staff
6.8hs shift avg
Activities & Recreation
0 staff
0hs shift avg
Social Services
1 staff
7.3hs shift avg
Dietary Services
6 staff
7.9hs shift avg
Other Services
3 staff
7.8hs shift avg
Contractor Analysis
6.1%
of total hours from contractors
3,288 contractor hours this quarter
Physical Therapy Aide: 4 Physical Therapy Assistant: 3 Qualified Social Worker: 1 Occupational Therapy Aide: 4 Speech Language Pathologist: 3 Occupational Therapy Assistant: 2 Respiratory Therapy Technician: 2 Medical Director: 1
Role Employees Contractors Total Staff Total Hours Days Worked % of Days Avg Shift (hrs)
Certified Nursing Assistant7107126,62391100%9.6
Licensed Practical Nurse3603611,55791100%9.6
Registered Nurse120124,37891100%9.8
Clinical Nurse Specialist9093,1799099%8.4
Other Dietary Services Staff6061,9528998%7.9
RN Director of Nursing3031,1548290%8.4
Physical Therapy Aide0447387279%7
Nurse Practitioner2025766268%8
Respiratory Therapy Technician0225526571%6.6
Speech Language Pathologist0335477481%7.4
Physical Therapy Assistant0335396571%7.4
Administrator1015206571%8
Dental Services Staff1015126470%8
Mental Health Service Worker2024275662%7.6
Occupational Therapy Aide0444205662%7.5
Qualified Social Worker0113564954%7.3
Occupational Therapy Assistant022852730%2.8
Medical Director011521314%4

Health Inspection History

Inspections
Total health inspections 10

Nevada average 5.1


Last Health inspection on Aug 2025

Total health citations 58
Citations per inspection
5.8

Health citations are formal notices following inspections when they fail to comply with safety and care standards.

38 of 58 citations resulted from standard inspections; 17 of 58 resulted from complaint investigations; and 3 of 58 came from combined inspections (standard and complaint).

Breakdown of citation severity (last 3 years)
Critical Health citations More info 0
100% better than Nevada average

Nevada average: 0.1


Serious Health citations More info 2
300% worse than Nevada average

Nevada average: 0.5

0 critical citations More info Nevada average: 0.1

2 serious citations More info Nevada average: 0.5

56 moderate citations More info Nevada average: 35

0 minor citations More info Nevada average: 0.5
Citations history (last 3 years)
Abuse/Neglect moderate citation Aug 01, 2025
Corrected

Infection Control moderate citation Aug 01, 2025
Corrected

Quality of Care moderate citation Aug 01, 2025
Corrected

Resident Rights moderate citation Aug 01, 2025
Corrected

Facility Characteristics

Source: CMS Long-Term Care Facility Characteristics (Data as of Jan 2026)

Ownership: For-Profit LLC
Resident Census by Payment Source
135 Total Residents
Medicare 11 (8.1%)
Medicaid 112 (83%)
Private Pay/Other 12 (8.9%)
Specialized Care Beds
118 Total Specialty Beds
81.9% of Bed Capacity
118
Other Specialized Rehab Beds
81.9%
Programs & Services
Residents' Group
Family Engagement

Active councils help families stay involved in care decisions and facility operations.

Quality of care over time

These measures show how residents usually do over time at this home, based on health outcomes and preventive care.

High-risk clinical events score Info A composite score based on pressure ulcers, falls with injury, weight loss, walking ability decline, and activities of daily living decline. 12.1
24% worse than Nevada average

Nevada average: 9.7

Functional decline score Info A composite score based on activities of daily living decline, walking ability decline, and incontinence. 20.6
18% worse than Nevada average

Nevada average: 17.5

Long-stay resident measures
Need for Help with Daily Activities Increased Info Percent of long-stay residents whose need for help with daily activities has increased 15.5%
In line with Nevada average

Nevada average: 15.6%

Walking Ability Worsened Info Percent of long-stay residents whose ability to move independently worsened 21.6%
In line with Nevada average

Nevada average: 20.8%

Low Risk Residents with Bowel/Bladder Incontinence Info Percent of low risk long-stay residents who lose control of their bowels or bladder 24.6%
46% worse than Nevada average

Nevada average: 16.9%

Falls with Major Injury Info Percent of long-stay residents experiencing one or more falls with major injury 1.8%
26% better than Nevada average

Nevada average: 2.5%

High Risk Residents with Pressure Ulcers Info Percent of long-stay high risk residents with pressure ulcers 3.9%
28% better than Nevada average

Nevada average: 5.5%

Urinary Tract Infection Info Percent of long-stay residents with a urinary tract infection 0.4%
70% better than Nevada average

Nevada average: 1.4%

Lost Too Much Weight Info Percent of long-stay residents who lose too much weight 17.5%
222% worse than Nevada average

Nevada average: 5.4%

Depressive Symptoms Info Percent of long-stay residents who have depressive symptoms 0.0%
100% better than Nevada average

Nevada average: 4.2%

Antipsychotic Use Info Percent of long-stay residents who received an antipsychotic medication 32.4%
130% worse than Nevada average

Nevada average: 14.1%

Pneumococcal Vaccine Info Percent of long-stay residents assessed and appropriately given the pneumococcal vaccine 74.7%
18% worse than Nevada average

Nevada average: 91.0%

Influenza Vaccine Info Percent of long-stay residents assessed and appropriately given the seasonal influenza vaccine 81.0%
10% worse than Nevada average

Nevada average: 89.6%

Hospitalizations per 1,000 days Info Number of hospitalizations per 1,000 long-stay resident days. 1.89
In line with Nevada average

Nevada average: 1.82

ED visits per 1,000 days Info Number of outpatient emergency department visits per 1,000 long-stay resident days. 1.10
27% better than Nevada average

Nevada average: 1.50

Short-stay resident measures
Pneumococcal Vaccine Info Percent of short-stay residents assessed and appropriately given the pneumococcal vaccine 60.4%
28% worse than Nevada average

Nevada average: 83.9%

Antipsychotic medication increase Info Percent of short-stay residents who newly received an antipsychotic medication 3.7%
81% worse than Nevada average

Nevada average: 2.0%

Influenza Vaccine Info Percent of short-stay residents assessed and appropriately given the seasonal influenza vaccine 70.5%
13% worse than Nevada average

Nevada average: 80.7%

Re-hospitalized after SNF stay Info Percentage of short-stay residents who were re-hospitalized after their nursing home admission. 27.3%
17% worse than Nevada average

Nevada average: 23.4%

Emergency department visits Info Percentage of short-stay residents who had an outpatient emergency department visit. 12.6%
29% worse than Nevada average

Nevada average: 9.8%

Falls with major injury Info Percentage of SNF residents who experience falls with major injury during their stay. 0.0%
100% better than Nevada average

Nevada average: 0.8%

Ability to care for self at discharge Info Percentage of residents at or above expected ability to care for themselves at discharge. 31.2%
42% worse than Nevada average

Nevada average: 53.7%

Successful return to home or community Info Rate of successful return to home or community from a skilled nursing facility. 32.0%
37% worse than Nevada average

Nevada average: 50.6%

Guides for Better Senior Living

Care Cost Calculator: See Prices in Your Area

Nursing Home Data Explorer

Don’t Wait Too Long: 7 Red Flag Signs Your Parent Needs Assisted Living Now

The True Cost of Assisted Living in 2025 – And How Families Are Paying For It

Understanding Senior Living Costs: Pricing Models, Discounts & Financial Assistance

Financial Aid for Nevada Seniors

Get financial aid guidance

Home and Community Based Waiver

Nevada Medicaid HCBW

Age 65+ or disabled, Nevada resident, Medicaid-eligible, nursing home-level care need.

~$2,829/month (300% FBR, individual).

$2,000 (individual), $3,000 (couple).

High urban demand (e.g., Las Vegas); rural challenges.

Nevada Senior Services Program

NV SSP

Age 60+, Nevada resident, at risk of decline.

~$1,800/month (individual, varies).

$5,000 (individual).

Limited funding; rural focus.

Personal Care Services (PCS)

Nevada Personal Care Services

Age 19+ (65+ for seniors focus), Nevada resident, Medicaid-eligible, needs help with 1+ ADL.

~$967/month (individual); spenddown allowed.

$2,000 (individual), $3,000 (couple).

Self-directed (family can be paid); statewide via DHHS.

Senior Rx Program

Nevada Senior Rx Program

Age 65+, Nevada resident, enrolled in Medicare Part D, income below limit.

~$2,510/month (individual), ~$3,380/month (couple).

Not assessed.

Covers up to $38.75/month premium; funded by tobacco settlement.

Medicare Savings Program (MSP)

Nevada Medicare Savings Program

Age 65+ or disabled, Nevada resident, Medicare Part A/B.

~$2,510/month (QMB), ~$3,380/month (SLMB), ~$3,598/month (QI)—individual.

$9,430 (individual), $14,130 (couple).

Three tiers; no waitlist; includes Extra Help for Part D.

Nevada Caregiver Support Program (via NFCSP)

Nevada Caregiver Support Program

Caregivers of 60+ needing care or 55+ caregivers of others; Nevada resident; functional needs (2+ ADLs).

Prioritizes ~$24,980/year (individual); no strict cap.

Not assessed; need-based.

5 AAAs; prioritizes rural, low-income caregivers.

VA Aid and Attendance (A&A) and Housebound Benefits

Nevada VA Aid and Attendance/Housebound

Age 65+ or disabled veteran/spouse, Nevada resident, wartime service, need for ADL help (A&A) or homebound.

Net income < ~$1,984/month (veteran with dependent, A&A); pension offsets income.

~$155,356 (net worth limit).

High veteran demand in urban/rural areas.

Who we are

Your Senior Care Partner, Every Step of the Way

We help families find affordable senior communities and unlock same day discounts, Medicaid, and Medicare options tailored to your needs.

Contact us Today