Elderwood at Burlington

Nursing Home
Overview of Elderwood at Burlington

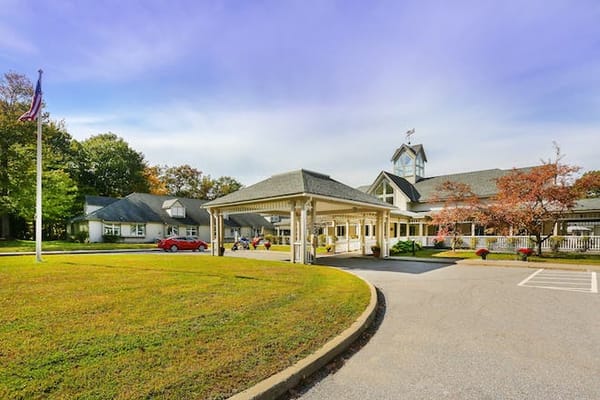
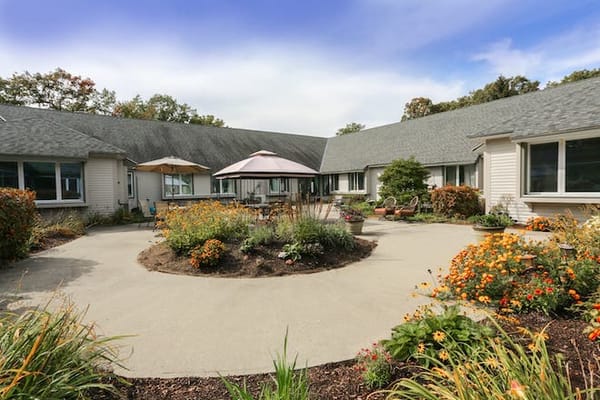
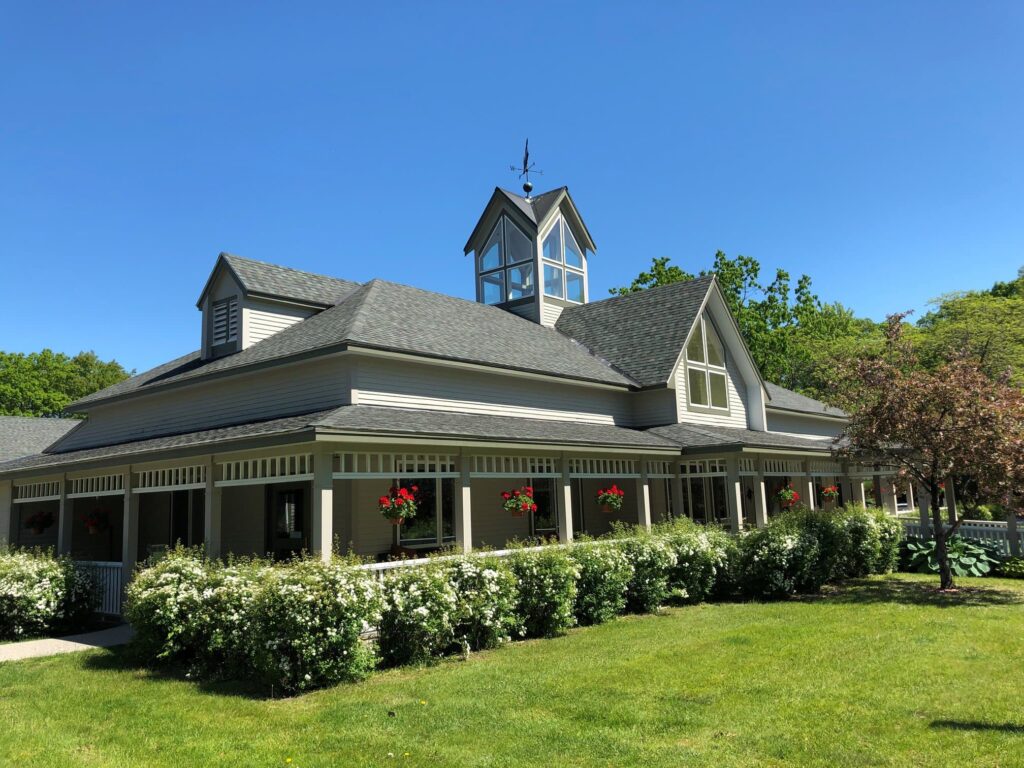
Elderwood at Burlington is a trusted senior care community located in Burlington, Vermont. When it comes to providing exceptional care and support for older adults, Elderwood knows how to do it right. This community offers a range of services to meet the unique needs of each resident, including skilled nursing care, rehabilitation therapies, and specialized programs. The dedicated team of professionals at Elderwood is committed to ensuring the well-being and comfort of every individual in their care.
Elderwood at Burlington prides themselves on their commitment to personalized care. Each resident receives individualized attention and assistance based on their specific needs and preferences. Whether it’s helping with daily activities, providing specialized memory care, or offering rehabilitation services, Elderwood at Burlington is equipped to provide compassionate support and a nurturing environment. The community promotes engagement and social connection, with a variety of activities and programs available for residents to enjoy. From fitness classes to educational seminars, there’s always something exciting happening at Elderwood.

(888) 826-9663

Managed by Pamela Rafferty

Acting Administrator

Pamela Rafferty serves as the Acting Administrator at Elderwood at Burlington. She is dedicated to ensuring a safe, comfortable, and vibrant home for residents, overseeing community operations and care options with a warm and professional approach.

Quality ratings

Measured by Centers for Medicare & Medicaid Services (CMS)

Overall rating Info Official CMS rating based on health inspections, staffing and quality measures.
1/5
Vermont average: 2.8/5
Health Inspection Info Official CMS rating based on deficiencies found during state health inspections.
1/5
Vermont average: 2.8/5
Staffing Info Official CMS rating based on nurse staffing hours per resident per day.
3/5
Vermont average: 3.0/5
Quality Measures Info Official CMS rating based on clinical outcomes for residents.
2/5
Vermont average: 3.0/5

Nursing care per resident

Info Average daily nursing hours per resident (adjusted for acuity). Higher values indicate more nursing time per resident.
3h 42m per day

This home provides 13% less nursing time per resident than the state average.

Vermont average: 4h 16m per day

Staffing hours breakdown

Info Hours of care per resident per day, broken down by staff type. Data from CMS Medicare.
Staff type Facility State avg National avg
Registered Nurse (RN) Info Registered nurse hours per resident per day. 53m per day 49m per day 41m per day
LPN / LVN Info Licensed Practical Nurse / Licensed Vocational Nurse hours per resident per day. 40m per day 53m per day 52m per day
Nurse Aide Info Nurse aide hours per resident per day. 2h 11m per day 2h 35m per day 2h 21m per day
Total Nursing (Weekend) Info Total number of nurse staff hours per resident per day on weekends. 3h 32m per day 3h 41m per day 3h 26m per day
Physical Therapist Info Physical therapist staff hours per resident per day. 12m per day 6m per day 4m per day
RN (Weekend) Info Registered nurse hours per resident per day on weekends. 45m per day 32m per day 29m per day

Capacity and availability

Medium-capacity home

Offers a balance of services and community atmosphere.

Total beds 150

This home usually has availability

Lower occupancy suggests more openings may be available.

Lower demand than the Vermont average
Occupancy rate 72.9%
Residents per day (avg) 121
Occupancy rate
72.9%
Residents per day (avg)
121

Who this home usually serves

TYPE OF STAY

Mostly short-term rehab stays

Most residents typically stay for a few weeks or months before returning home or moving on.

Might be optimal for
Short stays Recovery Medicare-covered care

Breakdown by payment type

Medicare

53% of new residents, usually for short-term rehab.

Typical stay 30 days

Private pay

44% of new residents, often for short stays.

Typical stay 1 - 2 months

Medicaid

2% of new residents, often for long-term daily care.

Typical stay 12 years

Finances and operations

Proprietary home
Partnership
Home revenue
$20.5M
Operating loss
-$2.6M
Proprietary home Partnership
Home revenue
$20,541,468.00
Operating loss
$-2,570,810.00
Payroll costs Info The portion of the home's budget spent on staff, including nurses, caregivers, and other employees who support care and operations.
$7.0M
34.1% of revenue
Other operating costs Info All remaining costs needed to run the home, such as food, utilities, building maintenance, supplies and administrative expenses.
$16.1M
Total costs $23.1M
Walk Score
Walk Score: 7 / 100
Car-dependent. Most errands require a car, with limited nearby walkable options.

About this community

Facility Type
Nursing Home

Additional licensing details

County: Chittenden

Safety & Compliance

Care Services

Provides Memory Care
Nursing Services
Rehabilitation Services
Respite Care
Memory Care
Skilled Nursing
Licensed Nurses/CNAs
Short-Term Rehab

All Levels of Care

Skilled Nursing
Respite Care
Subacute Rehabilitation
Memory Care
Palliative Care

Contact Information

Fax: 802-658-6432

Amenities & Lifestyle

Two bright
spacious rehab gyms with state-of-the-art equipment
comfortable private and companion rooms
friendly home-like atmosphere
attractive common spaces
daily housekeeping and laundry
lively social activities.

Programs & Activities

Specific Programs
Skilled Nursing, Respite Care, Subacute Rehabilitation, Memory Care, Palliative Care

Dining & Nutrition

Food Description
Pleasant dining experience at every meal.
Meals Included
Yes
Contact Elderwood at Burlington

Compare Assisted Living around Burlington

The information below is reported by the Vermont Department of Disabilities, Aging and Independent Living.
Elderwood at Burlington
AL

Assisted Living For seniors needing help with daily tasks but not full-time nursing.

SNF

Nursing Homes 24/7 care needed

Burlington (New North End)
150
No
-
7
98 STARR FARM ROAD OPERATING HOLDCO LLC
72.9%
$19,998,734.00
$7,012,952.00
35.1%
120.60
1/5
3.7063
1/5
3/5
2/5
3
83
15
+53%
-13%
-10%
Birchwood Terrace Rehab and Healthcare
AL

Assisted Living For seniors needing help with daily tasks but not full-time nursing.

SNF

Nursing Homes 24/7 care needed

Burlington (New North End)
144
No
-
36
RUBIN, ALTER
86.8%
$18,834,549.00
$7,455,045.00
39.6%
129.70
1/5
4.0556
1/5
3/5
3/5
1
20
1
-12%
-5%
+7%
Burlington Health & Rehabilitation Center
AL

Assisted Living For seniors needing help with daily tasks but not full-time nursing.

SNF

Nursing Homes 24/7 care needed

Burlington (Old North End)
126
No
-
86
-
65.8%
$14,576,297.00
$3,280,662.00
22.5%
105.20
2/5
3.4938
2/5
2/5
4/5
2
35
7
-17%
-18%
-19%
The Arbors of Shelburne
AL

Assisted Living For seniors needing help with daily tasks but not full-time nursing.

Shelburne
-
Yes
F
28
-
-
-
-
-
-
-
-
-
-
-
-
-
-
-
-
-
Gazebo Apartments
AL

Assisted Living For seniors needing help with daily tasks but not full-time nursing.

-
-
No
-
71
-
-
-
-
-
-
-
-
-
-
-
-
-
-
-
-
-

Places of interest near Elderwood at Burlington

Address 3.9 miles from city center — 4.01 miles to nearest hospital (Emily R. Kavouksorian, PA)

Address 98 Starr Farm Rd, Burlington, VT 05408

Calculate Travel Distance to Elderwood at Burlington

Add your location

Address

Staffing Data

Source: CMS Payroll-Based Journal (Q2 2025)

132
Total Staff
132
Employees
0
Contractors
48,017
Total Hours (Quarter)
55
Avg Staff/Day
9.6
Avg Shift (hrs)
Nursing Staff Breakdown
Role Count Avg Shift (hrs) Uses Contractors?
Registered Nurse2410.3 No
Licensed Practical Nurse2010.7 No
Certified Nursing Assistant5210.7 No
Staff by Category
Administration
3 staff
7.5hs shift avg
Nursing Staff
97 staff
10.6hs shift avg
Physicians & Practitioners
6 staff
6.1hs shift avg
Therapy Services
14 staff
7.4hs shift avg
Activities & Recreation
0 staff
0hs shift avg
Social Services
3 staff
6.9hs shift avg
Dietary Services
6 staff
7.5hs shift avg
Other Services
3 staff
7.5hs shift avg
Role Employees Contractors Total Staff Total Hours Days Worked % of Days Avg Shift (hrs)
Certified Nursing Assistant5205222,91291100%10.7
Registered Nurse240247,26091100%10.3
Licensed Practical Nurse200206,99291100%10.7
Respiratory Therapy Technician6062,2407481%7.9
Physical Therapy Assistant6061,9978897%7.2
Other Dietary Services Staff5051,2198998%7.5
Dental Services Staff2029517077%7.6
Qualified Social Worker3037648189%6.9
Clinical Nurse Specialist3036357886%5.3
Dietitian1014736369%7.5
Occupational Therapy Aide1014656268%7.5
Nurse Practitioner1014586167%7.5
Administrator3034505662%7.5
Mental Health Service Worker1014355864%7.5
Physical Therapy Aide1013756066%6.2
RN Director of Nursing1012513033%8.4
Other Physician2021432224%6.5

Health Inspection History

Inspections
Total health inspections 11

Vermont average 6.5


Last Health inspection on Aug 2025

Total health citations 83
Citations per inspection
7.55

Health citations are formal notices following inspections when they fail to comply with safety and care standards.

58 of 83 citations resulted from standard inspections; 22 of 83 resulted from complaint investigations; and 3 of 83 came from combined inspections (standard and complaint).

Breakdown of citation severity (last 3 years)
Critical Health citations More info 0
100% better than Vermont average

Vermont average: 0.7


Serious Health citations More info 15
689% worse than Vermont average

Vermont average: 1.9

0 critical citations More info Vermont average: 0.7

15 serious citations More info Vermont average: 1.9

66 moderate citations More info Vermont average: 24.6

2 minor citations More info Vermont average: 1.5
Citations history (last 3 years)
Abuse/Neglect moderate citation Aug 11, 2025
Corrected

Pharmacy moderate citation Aug 11, 2025
Corrected

Abuse/Neglect moderate citation May 12, 2025
Corrected

Abuse/Neglect moderate citation May 12, 2025
Corrected

Facility Characteristics

Source: CMS Long-Term Care Facility Characteristics (Data as of Jan 2026)

Ownership: For-Profit LLC
Resident Census by Payment Source
121 Total Residents
Medicare 23 (19%)
Medicaid 72 (59.5%)
Private Pay/Other 26 (21.5%)
Programs & Services
Residents' Group
Family Engagement

Active councils help families stay involved in care decisions and facility operations.

Quality of care over time

These measures show how residents usually do over time at this home, based on health outcomes and preventive care.

High-risk clinical events score Info A composite score based on pressure ulcers, falls with injury, weight loss, walking ability decline, and activities of daily living decline. 15.2
31% worse than Vermont average

Vermont average: 11.6

Functional decline score Info A composite score based on activities of daily living decline, walking ability decline, and incontinence. 29.4
30% worse than Vermont average

Vermont average: 22.7

Long-stay resident measures
Need for Help with Daily Activities Increased Info Percent of long-stay residents whose need for help with daily activities has increased 23.3%
14% worse than Vermont average

Vermont average: 20.4%

Walking Ability Worsened Info Percent of long-stay residents whose ability to move independently worsened 34.4%
71% worse than Vermont average

Vermont average: 20.1%

Low Risk Residents with Bowel/Bladder Incontinence Info Percent of low risk long-stay residents who lose control of their bowels or bladder 30.7%
11% worse than Vermont average

Vermont average: 27.6%

Falls with Major Injury Info Percent of long-stay residents experiencing one or more falls with major injury 7.3%
26% worse than Vermont average

Vermont average: 5.8%

High Risk Residents with Pressure Ulcers Info Percent of long-stay high risk residents with pressure ulcers 6.0%
6% better than Vermont average

Vermont average: 6.4%

Urinary Tract Infection Info Percent of long-stay residents with a urinary tract infection 1.4%
44% better than Vermont average

Vermont average: 2.5%

Lost Too Much Weight Info Percent of long-stay residents who lose too much weight 5.2%
6% better than Vermont average

Vermont average: 5.5%

Depressive Symptoms Info Percent of long-stay residents who have depressive symptoms 6.6%
35% better than Vermont average

Vermont average: 10.0%

Antipsychotic Use Info Percent of long-stay residents who received an antipsychotic medication 22.2%
14% worse than Vermont average

Vermont average: 19.4%

Pneumococcal Vaccine Info Percent of long-stay residents assessed and appropriately given the pneumococcal vaccine 93.8%
In line with Vermont average

Vermont average: 95.6%

Influenza Vaccine Info Percent of long-stay residents assessed and appropriately given the seasonal influenza vaccine 95.1%
In line with Vermont average

Vermont average: 97.6%

Hospitalizations per 1,000 days Info Number of hospitalizations per 1,000 long-stay resident days. 1.84
28% worse than Vermont average

Vermont average: 1.44

ED visits per 1,000 days Info Number of outpatient emergency department visits per 1,000 long-stay resident days. 3.40
37% worse than Vermont average

Vermont average: 2.48

Short-stay resident measures
Pneumococcal Vaccine Info Percent of short-stay residents assessed and appropriately given the pneumococcal vaccine 82.1%
5% worse than Vermont average

Vermont average: 86.3%

Antipsychotic medication increase Info Percent of short-stay residents who newly received an antipsychotic medication 0.0%
100% better than Vermont average

Vermont average: 1.7%

Influenza Vaccine Info Percent of short-stay residents assessed and appropriately given the seasonal influenza vaccine 63.1%
20% worse than Vermont average

Vermont average: 78.9%

Re-hospitalized after SNF stay Info Percentage of short-stay residents who were re-hospitalized after their nursing home admission. 25.0%
16% worse than Vermont average

Vermont average: 21.5%

Emergency department visits Info Percentage of short-stay residents who had an outpatient emergency department visit. 22.0%
25% worse than Vermont average

Vermont average: 17.6%

Falls with major injury Info Percentage of SNF residents who experience falls with major injury during their stay. 0.0%
100% better than Vermont average

Vermont average: 0.8%

Ability to care for self at discharge Info Percentage of residents at or above expected ability to care for themselves at discharge. 52.6%
In line with Vermont average

Vermont average: 53.7%

Successful return to home or community Info Rate of successful return to home or community from a skilled nursing facility. 56.7%
12% better than Vermont average

Vermont average: 50.6%

Penalties and fines

Federal penalties imposed by CMS for regulatory violations, including civil money penalties (fines) and denials of payment for new Medicare/Medicaid admissions.

Source: CMS Penalties Database (Data as of Jan 2026)

Total fines amount $252K
98% higher than Vermont average

Vermont average: $128K

Number of fines 2
13% more fines than Vermont average

Vermont average: 1.8

Payment Denials Info Serious action where Medicare and/or Medicaid temporarily stops payments for new residents until issues are fixed. 1
83% more payment denials than Vermont average

Vermont average: 0.5

Fines amount comparison
This facility $252K
Vermont average $128K
Penalty History

Penalties are imposed by CMS for violations of federal nursing home regulations.

Civil Money Penalty Info Fines imposed for noncompliance, which can be assessed per day or per instance of violation. Jan 11, 2024
$221K
Payment Denial Info Serious action where Medicare and/or Medicaid temporarily stops payments for new residents until issues are fixed. Jan 11, 2024
49 days
Civil Money Penalty Info Fines imposed for noncompliance, which can be assessed per day or per instance of violation. May 15, 2023
$31K

Last updated: Jan 2026

Guides for Better Senior Living

Care Cost Calculator: See Prices in Your Area

Nursing Home Data Explorer

Don’t Wait Too Long: 7 Red Flag Signs Your Parent Needs Assisted Living Now

The True Cost of Assisted Living in 2025 – And How Families Are Paying For It

Understanding Senior Living Costs: Pricing Models, Discounts & Financial Assistance

Financial Aid for Vermont Seniors

Get financial aid guidance

Choices for Care

VT Medicaid CFC

Age 65+ or disabled, Vermont resident, Medicaid-eligible, nursing home-level care need.

~$2,829/month (300% FBR, individual).

$2,000 (individual), $3,000 (couple).

Small state; rural access emphasis.

Vermont Assistive Community Care Services (ACCS)

VT ACCS

Age 65+, Vermont resident, in approved residential setting.

~$1,732/month (individual, varies).

$2,000 (individual).

Facility-based; limited funding.

Older Americans Act (OAA) Services

Vermont OAA Services

Age 60+, VT resident; no income/asset limits.

None; donations encouraged.

Not assessed.

5 AAAs (Age Well, CVCOA, NEKCOA, Senior Solutions, SVCOA); rural focus.

Medicare Savings Program (MSP)

Vermont Medicare Savings Program

Age 65+ or disabled, VT resident, Medicare Part A/B.

~$2,510/month (QMB), ~$3,380/month (SLMB), ~$3,598/month (QI)—individual.

$9,430 (individual), $14,130 (couple).

Includes Extra Help for Part D; no waitlist.

Fuel Assistance Program

Vermont Seasonal Fuel Assistance

Age 60+ prioritized, VT resident, low-income household.

~$3,970/month (185% FPL).

Not assessed.

Covers oil, gas, wood; emergency aid available.

Family Caregiver Support Program (FCSP)

Vermont Family Caregiver Support Program

Caregivers of 60+ needing care or 55+ caregivers of others; VT resident; 2+ ADLs.

No strict cap; prioritizes low-income (~$24,980/year).

Not assessed.

Includes grandparent caregivers; serves ~1,000 annually.

Senior Community Service Employment Program (SCSEP)

Vermont SCSEP

Age 55+, unemployed, low-income, VT resident.

~$1,983/month (125% FPL).

Not specified.

Priority for veterans, rural residents; AARP partnership.

VA Aid and Attendance (A&A) and Housebound Benefits

Vermont VA Aid and Attendance/Housebound

Age 65+ or disabled veteran/spouse, VT resident, wartime service, ADL help (A&A) or homebound.

Net income < ~$1,984/month (veteran with dependent, A&A); pension offsets income.

~$155,356 (net worth).

High rural veteran use; supports care costs.

Property Tax Adjustment Assistance

Vermont Property Tax Credit

Age 65+ (or all ages), VT resident, homeowner/renter, income-based.

~$47,000/year (household); caps credit at ~$128,000.

Not assessed.

Credits up to $8,000; serves ~20,000 households.

Commodity Supplemental Food Program (CSFP)

Vermont CSFP

Age 60+, VT resident, low-income.

~$1,632/month (130% FPL).

Not assessed.

Serves ~5,000 seniors via 50+ drop sites.

Attendant Services Program (ASP)

Vermont Attendant Services Program

Age 65+ (or disabled 18+), VT resident, severe/permanent disability, 2+ ADL needs.

Medicaid-eligible (~$2,829/month) or near-eligible for General Fund.

$2,000 (individual) for Medicaid; varies for General Fund.

Participants hire/manage caregivers; serves ~500 annually.

Who we are

Your Senior Care Partner, Every Step of the Way

We help families find affordable senior communities and unlock same day discounts, Medicaid, and Medicare options tailored to your needs.

Contact us Today
Tour Icon
Planning a tour? Check our touring checklist.
Chat Icon
Thinking of living here? We can help you speak to a current resident