


Total staff
75
Employees
75
Contractors
0
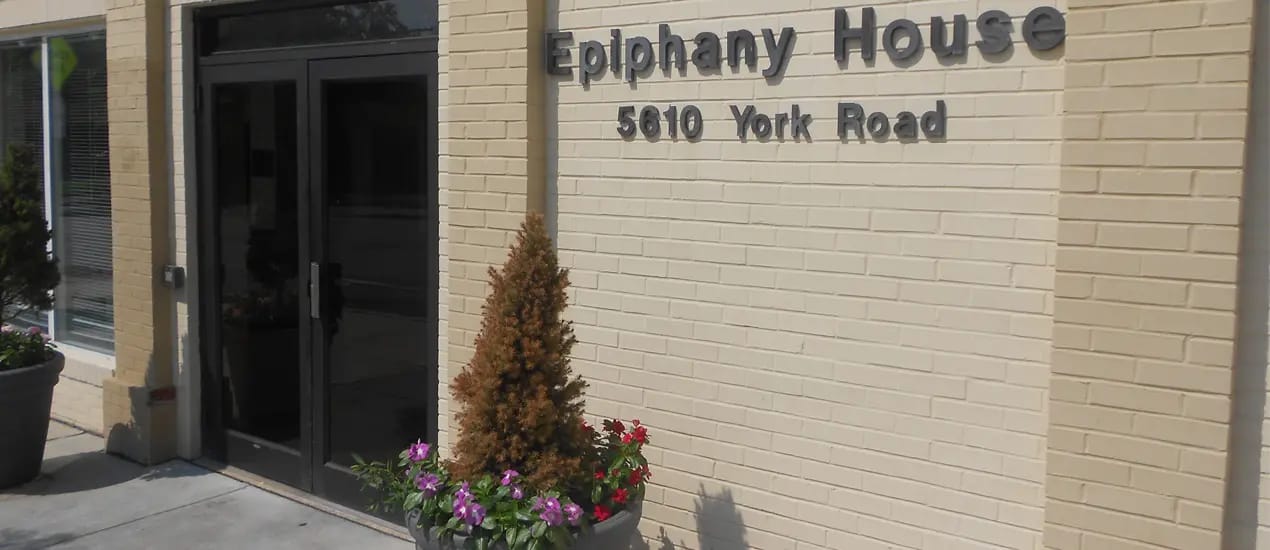
Epiphany House, at 1010 E 33rd Street in the Ednor Gardens-Lakeside neighborhood of Baltimore, is a 53-bed skilled nursing facility owned by Laurie Netzer. Medicare accounts for 88% of new admissions, with Medicaid comprising 5% and private pay 8%; residents typically stay 89 days.
The facility is 2.7 miles from downtown and operates in a very walkable neighborhood (Walk Score: 72). It is 2.14 miles from MedStar Good Samaritan Hospital.
Epiphany House earns a 4-star CMS overall rating, built on exceptional health inspection performance (4-star, 6.5% above Maryland average) and quality measures (4-star, 35.3% above state average).
Staffing is rated 3-star and runs at the state average. The facility provides 3h 51m of nursing care per resident daily, with weekend staffing at 3h 34m per day (3% above state average). Its 75-person workforce includes 3 RNs, 15 LPNs, and 28 CNAs, with no contract labor; staff-to-resident ratio is 1.79:1, matching the state benchmark.
Quality metrics show particular strength in injury prevention and pharmaceutical restraint.
Falls with major injury affect 1.0% of long-stay residents, 57% better than state average. Pressure ulcers in high-risk residents run 4.1%, 38% better than state average. Antipsychotic use stands at 3.9%, substantially below the Maryland average of 12.9%. One concerning finding emerges: 65.4% of long-stay residents report depressive symptoms, more than triple the state average of 20.2%, suggesting possible gaps in behavioral health intervention or resident acuity selection.
The facility reported a single federal fine of $67,000 and no payment denials; no penalties have occurred in the past three years.
Occupancy is high at 91.6%, ranking it 30th of 146 Maryland facilities.
Payroll consumes 31.8% of revenue, the lowest proportion among Maryland SNFs and well below the typical 49-57% for well-managed facilities, indicating significant operational constraints.
Epiphany House is oriented toward short-term post-acute Medicare rehabilitation, though the depression prevalence warrants candid inquiry into mental health staffing and support structures.
| Staff type | Hours / Day / Resident | vs state avg |
|---|---|---|
|
Registered Nurse (RN)
| 25m per day | ▼ 50% State avg: 49m per day · National avg: 41m per day |
|
LPN / LVN
| 1h 7m per day | ▲ 22% State avg: 55m per day · National avg: 52m per day |
|
Nurse Aide
| 2h 14m per day | ▲ 4% State avg: 2h 8m per day · National avg: 2h 20m per day |
|
Weekend Total Nursing
| 3h 20m per day | ▼ 5% State avg: 3h 31m per day · National avg: 3h 27m per day |
|
Physical Therapist
| 14m per day | ▲ 134% State avg: 6m per day · National avg: 4m per day |
|
Weekend RN
| 15m per day | ▼ 59% State avg: 37m per day · National avg: 29m per day |
Reporting period: October 1 – December 31, 2025 (Q4 2025). Source: CMS Payroll-Based Journal report.
Manages medical care and health needs.
Assists with medical care and medications.
Helps with daily care and mobility.
| Certified Nursing Assistant | 28 | 0 | 28 | 7,883 | 92 | 100% | 7.1 |
| Licensed Practical Nurse | 15 | 0 | 15 | 4,279 | 92 | 100% | 7.9 |
| Medication Aide/Technician | 4 | 0 | 4 | 1,266 | 91 | 99% | 7.4 |
| Speech Language Pathologist | 3 | 0 | 3 | 941 | 70 | 76% | 7.8 |
| Respiratory Therapy Technician | 3 | 0 | 3 | 935 | 69 | 75% | 7.2 |
| Registered Nurse | 3 | 0 | 3 | 882 | 81 | 88% | 8.3 |
| Other Dietary Services Staff | 2 | 0 | 2 | 708 | 80 | 87% | 6.4 |
| Physical Therapy Aide | 3 | 0 | 3 | 515 | 64 | 70% | 5.8 |
| Dietitian | 1 | 0 | 1 | 508 | 65 | 71% | 7.8 |
| Mental Health Service Worker | 1 | 0 | 1 | 496 | 60 | 65% | 8.3 |
| Physical Therapy Assistant | 4 | 0 | 4 | 472 | 71 | 77% | 5.1 |
| Administrator | 1 | 0 | 1 | 461 | 62 | 67% | 7.4 |
| Qualified Social Worker | 1 | 0 | 1 | 439 | 55 | 60% | 8 |
| Nurse Practitioner | 1 | 0 | 1 | 438 | 61 | 66% | 7.2 |
| Clinical Nurse Specialist | 4 | 0 | 4 | 366 | 43 | 47% | 8 |
| RN Director of Nursing | 1 | 0 | 1 | 278 | 39 | 42% | 7.1 |
Federal penalties imposed by CMS for regulatory violations, including civil money penalties (fines) and denials of payment for new Medicare/Medicaid admissions.
Source: CMS Penalties Database (Data as of Jan 2026)
Maryland average: $61K
Maryland average: 1.5
Maryland average: 0.1
No penalties in the past 3 years
No civil money penalties or payment denials were reported in the last 3 years.
These measures show how residents usually do over time at this home, based on health outcomes and preventive care.
Maryland average: 12.9
Maryland average: 25.7
Maryland average: 23.7%
Maryland average: 27.7%
Maryland average: 25.9%
Maryland average: 2.3%
Maryland average: 6.5%
Maryland average: 1.6%
Maryland average: 5.8%
Maryland average: 20.2%
Maryland average: 12.9%
Maryland average: 92.0%
Maryland average: 96.6%
Maryland average: 78.4%
Maryland average: 1.4%
Maryland average: 80.6%
Quality measures are calculated from Minimum Data Set (MDS) assessments. For most measures, lower percentages indicate better care quality.
88% of new residents, usually for short-term rehab.
8% of new residents, often for short stays.
5% of new residents, often for long-term daily care.
Source: CMS Long-Term Care Facility Characteristics (Data as of Jan 2026)
Residents meet regularly to discuss policies, care quality, and activities
Organized group of residents that meets regularly to discuss facility policies, quality of life, and activities.
Data sourced from CMS Long-Term Care Facility Characteristics quarterly report. Payer mix reflects the current resident census by primary payment source.
Historical financial and operational data for Epiphany House from 2012–2023, based on CMS SNF Cost Reports.
Based on CMS SNF Cost Report for fiscal year ending in 12/2023.
Most residents typically stay for a few weeks or months before returning home or moving on.
Most new residents arrive under Medicare (88% of admissions), and a typical Medicare stay runs around 1 - 2 months.
Coverage residents most often arrive under.
Coverage residents most often leave under.
![]() 2.7 miles from city center
2.7 miles from city center
![]() Estimated distance in miles from Baltimore's city center to Epiphany House's address, calculated via Google Maps.
— 2.14 miles to nearest hospital (MedStar Good Samaritan Hospital)
Estimated distance in miles from Baltimore's city center to Epiphany House's address, calculated via Google Maps.
— 2.14 miles to nearest hospital (MedStar Good Samaritan Hospital)
Add your location
The information below is reported by the Maryland Department of Health, Office of Health Care Quality.
| Maryland Baptist Aged Home | NH HC NC RC | Baltimore (Mosher) | 29
Facility
29
MD AVG
43
Rank
#254 / 697 | 87.8% | +7% | 3.97 | -21% | +5% | $0 | 44
Facility
44
MD AVG
49.9
Rank
#84 / 149 | 14.7 | - | 26 | - |
84
Facility
84
MD AVG
43
Rank
#66 / 985 | Derrick Dewitt | $2.3M | $1.5M | 65.3%
Facility
65.3%
MD AVG
38.5%
Rank
#7 / 148 | 215360 | ||||
| Epiphany House | NH | Baltimore (Ednor Gardens-Lakeside) | 49
Facility
49
MD AVG
43
Rank
#226 / 697 | 91.6% | +11% | 3.85 | -71% | +2% | $0 | 63 | 15.8 | 1 | 45 | - |
72
Facility
72
MD AVG
43
Rank
#160 / 985 | Laurie Netzer | $8.9M | $3.0M | 33.8% | 215356 | ||||
| Resorts of Augsburg | NH AL IL | Baltimore (Gwynn Oak) | 131
Facility
131
MD AVG
43
Rank
#64 / 697 | 89.4% | +9% | 4.17 | -11% | +11% | $23.9k | 37
Facility
37
MD AVG
49.9
Rank
#62 / 149 | 12.3 | - | 120 | - |
18
Facility
18
MD AVG
43
Rank
#756 / 985 | - | $16.8M | $11.8M | 70%
Facility
70%
MD AVG
38.5%
Rank
#10 / 148 | 215193 | ||||
| Autumn Lake Healthcare at BridgePark | NH HC PC RC | Baltimore (Central Forest Park) | 106
Facility
106
MD AVG
43
Rank
#105 / 697 | 88.9% | +8% | 3.77 | -4% | 0% | $0 | 71
Facility
71
MD AVG
49.9
Rank
#123 / 149 | 17.8 | 1 | 84 | B- |
69
Facility
69
MD AVG
43
Rank
#199 / 985 | Bp Capital | $15.7M | $1.2M | 7.8% | 215195 | ||||
| Autumn Lake Healthcare at Homewood Center | NH PC RC | Baltimore (Homeland) | 112
Facility
112
MD AVG
43
Rank
#95 / 697 | 84.3% | +2% | 3.37 | -44% | -11% | $0 | 72 | 24.0 | - | 104 | - |
81
Facility
81
MD AVG
43
Rank
#86 / 985 | 56 West Frederick Holdco LLC | $14.2M | $1.1M | 7.7% | 215074 |
Epiphany House is located in Baltimore, Maryland.
Here are the financial assistance programs available to residents in Maryland.
Epiphany House is in the Ednor Gardens-Lakeside neighborhood.
Epiphany House has a walk score of 72. Very walkable. Most errands can be accomplished on foot, and many essentials are within a short walk.
Epiphany House's occupancy is 91.6%.
Epiphany House is registered as a for-profit.
Yes — there is 1 photo of Epiphany House in the photo gallery on this page.
Epiphany House is located at 1010 E 33Rd St, Baltimore, MD 21218.
(763) 755-0320 will put you in contact with the team at Epiphany House.
Care Cost Calculator: See Prices in Your Area
Nursing Home Data Explorer
Don’t Wait Too Long: 7 Red Flag Signs Your Parent Needs Assisted Living Now
The True Cost of Assisted Living in 2025 – And How Families Are Paying For It
Understanding Senior Living Costs: Pricing Models, Discounts & Financial Assistance


