Fair Oaks Health Care Center
Nursing Home, Assisted Living, Home Care, Hospice Care, Independent Living, Memory Care & Respite Care · Crystal Lake, IL
CMS overall rating Info CMS (the Centers for Medicare & Medicaid Services) is the federal agency that rates nursing home quality. Its Overall Rating runs from 1 to 5 stars, combining health inspections, staffing, and quality measures, with inspections weighted most heavily.

Fair Oaks Health Care Center

Nursing Home, Assisted Living, Home Care, Hospice Care, Independent Living, Memory Care & Respite Care · Crystal Lake, IL
CMS overall rating Info CMS (the Centers for Medicare & Medicaid Services) is the federal agency that rates nursing home quality. Its Overall Rating runs from 1 to 5 stars, combining health inspections, staffing, and quality measures, with inspections weighted most heavily.
Calculator: See prices in your area
Fair Oaks Health Care Center accepts Medicare and private pay.

Overview of Fair Oaks Health Care Center

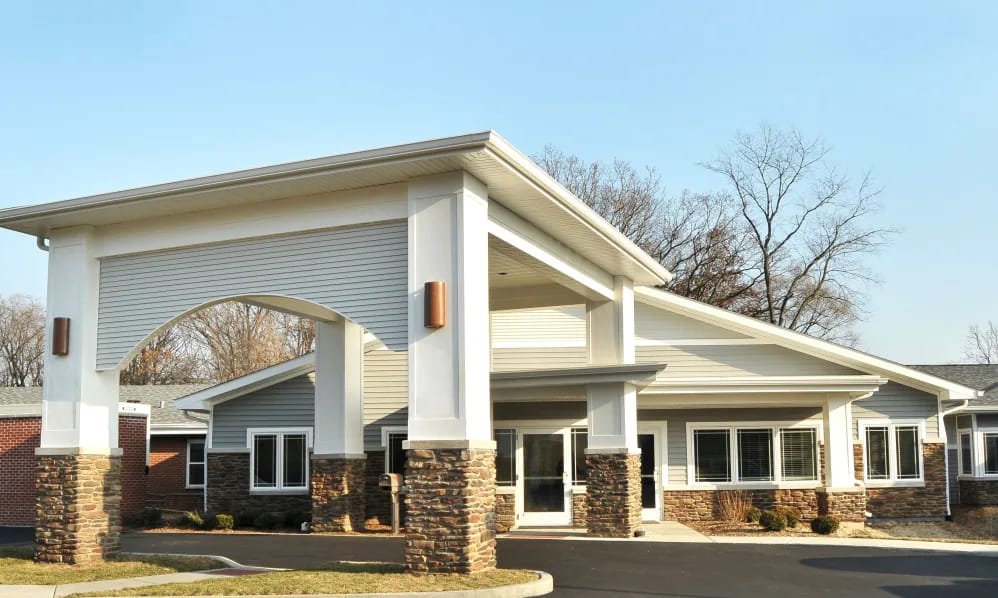
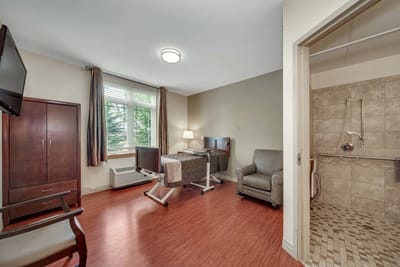
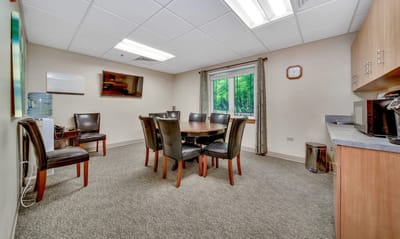
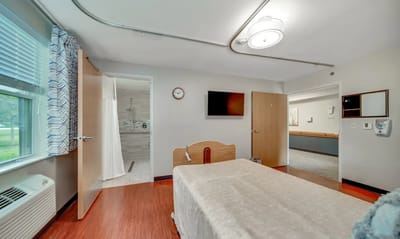
Fair Oaks Health Care Center is a well-recognized nursing home in Crystal Lake, IL, offering long-term care, hospice care, respite care, rehabilitation, and therapy. Promoting a compassionate and nurturing environment, the community strives to keep older adults comfortable and safe. Exceptional services, including restaurant-style dining, laundry, housekeeping, and scheduled transportation, are also provided to improve residents’ quality of life. With a highly trained team of professionals, the community ensures residents receive the utmost attention and care for their unique needs and preferences.

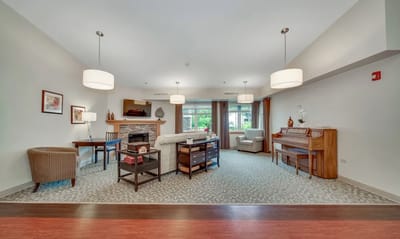
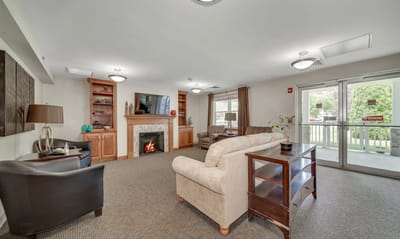
Outings, fun gatherings, and various recreational activities ensure residents can live actively and have fun. Residents can also focus on their recovery with a state-of-the-art therapy gym and lively common areas. Situated near schools and bus stops in Crystal Lake, the community guarantees accessibility and convenience. This nursing home is one of the trusted choices for senior living in Illinois, especially with its top-notch services.

Quality ratings

Measured by Centers for Medicare & Medicaid Services (CMS)

Overall rating Info The Overall CMS Rating combines results from health inspections, staffing levels and quality measures. Health inspections carry the most weight. Staffing and quality scores can increase or decrease the final rating based on performance compared to state and national standards.
▲ 19.0% Above IL avg. ▲ 19.0% Above IL avg.IL average: 2.5Click the badge to see the full State ranking.Click here to see the full State ranking.
Health Inspection Info Based on the results of the facility's three most recent standard inspections and any complaint investigations. CMS reviews the number, scope, and severity of deficiencies, with more recent findings weighted more heavily.
▲ 8.1% Above IL avg. ▲ 8.1% Above IL avg.IL average: 2.8Click the badge to see the full State ranking.Click here to see the full State ranking.
Staffing Info Measures average nursing staff hours per resident per day, including Registered Nurses (RNs) and total nursing staff. Ratings are adjusted based on the level of care residents require and are compared to state and national benchmarks.
▲ 87.2% Above IL avg. ▲ 87.2% Above IL avg.IL average: 2.1Click the badge to see the full State ranking.Click here to see the full State ranking.
Quality Measures Info Based on clinical and physical health indicators reported to CMS, such as hospital readmissions, falls, pressure ulcers, and improvements in mobility. These measures reflect how well residents' health needs are being managed.
▲ 6.6% Above IL avg. ▲ 6.6% Above IL avg.IL average: 2.8Click the badge to see the full State ranking.Click here to see the full State ranking.

Staffing hours breakdown

Info Daily nursing hours per resident by staff type, reported to CMS. Higher is generally better — compare this facility to state and national averages to see where staffing stands.

Hours per resident per day — compared to Illinois state averages

Total nursing care / resident Info This home is ranked 24th out of 172 homes in Illinois for nurse hours. Total adjusted nursing hours per resident per day, combining RN, LPN, and aide time. CMS adjusts this for case-mix so facilities can be fairly compared.
4h 35m per day
Rank #24 / 172Nurse hours — State benchmarkedThis home is ranked 24th out of 172 homes in Illinois. Shows adjusted nurse hours per resident per day benchmarked to the Illinois average, with a ranking across 172 Illinois facilities. More hours mean more direct care. The national average is about 3.5 hrs; below 3.0 is a red flag.Rankings are based only on facilities in Illinois that report data for that category. Facilities without available data are excluded from the ranking.Click the rank badge to see the full State ranking.Click here to see the full State ranking.
This facility Illinois avg (3h 6m per day)
vs Illinois avg
+48%

1 of 6 metrics below state avg

Standout metric Registered Nurse (RN) is +103% above state avg
Staff typeHours / Day / Residentvs state avg
Registered Nurse (RN) Info RNs hold the highest nursing license and can assess residents, interpret test results, and direct care plans. More RN hours per day often signals stronger clinical oversight and faster response to health changes. 1h 27m per day ▲ 103% State avg: 43m per day · National avg: 41m per day
LPN / LVN Info Licensed Practical Nurses (LPNs) or Licensed Vocational Nurses (LVNs) deliver routine hands-on care — medication administration, wound dressing, and monitoring vital signs. They work under RN supervision and make up a large share of daily bedside care. 24m per day ▼ 37% State avg: 39m per day · National avg: 52m per day
Nurse Aide Info Certified Nurse Aides (CNAs) provide the most direct day-to-day assistance: bathing, dressing, feeding, and mobility. Nurse aide hours are typically the largest staffing category and directly affect residents' quality of life. 3h 12m per day ▲ 51% State avg: 2h 7m per day · National avg: 2h 20m per day
Weekend Total Nursing Info Combined nursing hours (RN + LPN + Nurse Aide) per resident per day on weekends. Staffing often drops on weekends — this figure reveals whether the facility maintains adequate coverage outside of weekday hours. 4h 15m per day ▲ 37% State avg: 3h 6m per day · National avg: 3h 27m per day
Physical Therapist Info Hours per resident per day provided by licensed Physical Therapists (PTs) or PT Assistants. PT services help residents recover mobility after injury or illness and are especially important for post-acute (short-stay) rehabilitation. 5m per day ▲ 80% State avg: 3m per day · National avg: 4m per day
Weekend RN Info Registered nurse hours specifically on weekends. Facilities sometimes reduce RN presence on Saturdays and Sundays — a low weekend RN figure compared to weekday hours can indicate reduced clinical oversight when most administrative staff are absent. 1h 2m per day ▲ 85% State avg: 33m per day · National avg: 29m per day

Capacity and availability

This home usually has availability

Higher occupancy than the Illinois average: 69.3%
Occupancy rate
74.2% Rank #107 / 204Occupancy rate — State benchmarkedThis home is ranked 107th out of 204 homes in Illinois. Shows this facility's occupancy rate versus the Illinois average, with its Statewide rank out of 204. Higher occupancy signals strong local demand and financial stability.Rankings are based only on facilities in Illinois that report data for that category. Facilities without available data are excluded from the ranking.Click the rank badge to see the full State ranking.Click here to see the full State ranking.
Avg. Length of Stay
32 days
Bed community size
51-bed community Rank #292 / 426Bed count — State benchmarkedThis home is ranked 292nd out of 426 homes in Illinois. Shows this facility's certified or reported bed count compared to other Illinois facilities. Larger communities may offer more amenities, programs, and on-site services for residents and families.Rankings are based only on facilities in Illinois that report data for that category. Facilities without available data are excluded from the ranking.Click the rank badge to see the full State ranking.Click here to see the full State ranking.
A moderately sized community that may balance personal attention with shared amenities and social activities.
Walk Score
Walk Score: 29 / 100 Rank #502 / 648Walk Score — State benchmarkedThis home is ranked 502nd out of 648 homes in Illinois. Shows how walkable this facility's neighborhood is compared to the average Walk Score across Illinois facilities. Higher scores benefit residents, families, and staff.Rankings are based only on facilities in Illinois that report data for that category. Facilities without available data are excluded from the ranking.Click the rank badge to see the full State ranking.Click here to see the full State ranking.
Somewhat walkable. A few nearby services may be reachable on foot, but most trips require transportation.

Contact Fair Oaks Health Care Center

Staffing Data

Reporting period: October 1 – December 31, 2025 (Q4 2025). Source: CMS Payroll-Based Journal report.

Total staff 231
Employees 109
Contractors 122
Staff to resident ratio 6.79 : 1
278% more staff per resident than Illinois average
Illinois average ratio: 1.80 : 1 Illinois average ratio: 1.80 : 1See full Illinois ranking
Avg staff/day 39
Average shift 7 hours
8% worse than Illinois average
Illinois average: 7.6 hours Illinois average shift: 7.6 hoursSee full Illinois ranking
Total staff hours (quarter) 25,174

Nursing staff breakdown

Q4 2025 · Oct 1 – Dec 31 More info This data comes from the CMS Payroll-Based Journal report covering October 1 – December 31, 2025.
Registered Nurse

Manages medical care and health needs.

RN Staff Info 43 total: 20 full-time employees and 23 contractors. 43
Average shift length Info Average shift length. Calculated as total hours divided by days worked and average staff per day. 8.2 hours
Licensed Practical Nurse

Assists with medical care and medications.

LPN Staff Info 37 total: 3 full-time employees and 34 contractors. 37
Average shift length Info Average shift length. Calculated as total hours divided by days worked and average staff per day. 7.4 hours
Certified Nursing Assistant

Helps with daily care and mobility.

CNA Staff Info 113 total: 54 full-time employees and 59 contractors. 113
Average shift length Info Average shift length. Calculated as total hours divided by days worked and average staff per day. 7.4 hours

Contractor staffing

Q4 2025 · Oct 1 – Dec 31 More info This data comes from the CMS Payroll-Based Journal report covering October 1 – December 31, 2025.

Total hours from contractors

12.7%

3,204 contractor hours this quarter

Certified Nursing Assistant: 59 Licensed Practical Nurse: 34 Registered Nurse: 23 Occupational Therapy Assistant: 2 Dental Services Staff: 1 Other Activities Staff: 1 Occupational Therapy Aide: 1 Dietitian: 1

Staff by category

Q4 2025 · Oct 1 – Dec 31 More info This data comes from the CMS Payroll-Based Journal report covering October 1 – December 31, 2025.
Certified Nursing Assistant545911311,89892100%7.4
Registered Nurse2023434,32092100%8.2
Speech Language Pathologist5051,6677683%6.5
Licensed Practical Nurse334371,5138896%7.4
Other Dietary Services Staff9091,40092100%6.3
Clinical Nurse Specialist2026076470%6.9
Physical Therapy Aide2025927177%5.6
Qualified Social Worker4045716470%5.9
Dental Services Staff2135366874%7
Administrator1014956672%7.5
Nurse Practitioner1014825964%8.2
Physical Therapy Assistant3034796267%7.2
Respiratory Therapy Technician3033407076%4.5
Occupational Therapy Aide0111383740%3.7
Other Activities Staff0111002729%3.7
Occupational Therapy Assistant022252022%1.2
Dietitian0111222%6
113 Certified Nursing Assistant
% of Days 100%
43 Registered Nurse
% of Days 100%
5 Speech Language Pathologist
% of Days 83%
37 Licensed Practical Nurse
% of Days 96%
9 Other Dietary Services Staff
% of Days 100%
2 Clinical Nurse Specialist
% of Days 70%
2 Physical Therapy Aide
% of Days 77%
4 Qualified Social Worker
% of Days 70%
3 Dental Services Staff
% of Days 74%
1 Administrator
% of Days 72%
1 Nurse Practitioner
% of Days 64%
3 Physical Therapy Assistant
% of Days 67%
3 Respiratory Therapy Technician
% of Days 76%
1 Occupational Therapy Aide
% of Days 40%
1 Other Activities Staff
% of Days 29%
2 Occupational Therapy Assistant
% of Days 22%
1 Dietitian
% of Days 2%

Penalties and fines

Federal penalties imposed by CMS for regulatory violations, including civil money penalties (fines) and denials of payment for new Medicare/Medicaid admissions.

Source: CMS Penalties Database

No penalties in the past 3 years

No civil money penalties or payment denials were reported in the last 3 years.

Quality of care over time

These measures show how residents usually do over time at this home, based on health outcomes and preventive care.

High-risk clinical events score Info A composite score based on pressure ulcers, falls with injury, weight loss, walking ability decline, and activities of daily living decline. 12.0
23% worse than Illinois average

Illinois average: 9.7

Functional decline score Info A composite score based on activities of daily living decline, walking ability decline, and incontinence. 15.4
17% better than Illinois average

Illinois average: 18.6

Long-stay resident measures
Need for Help with Daily Activities Increased Info Percent of long-stay residents whose need for help with daily activities has increased 18.8%
21% worse than Illinois average

Illinois average: 15.5%

Low Risk Residents with Bowel/Bladder Incontinence Info Percent of low risk long-stay residents who lose control of their bowels or bladder 12.0%
45% better than Illinois average

Illinois average: 21.6%

Falls with Major Injury Info Percent of long-stay residents experiencing one or more falls with major injury 0.0%
100% better than Illinois average

Illinois average: 3.4%

High Risk Residents with Pressure Ulcers Info Percent of long-stay high risk residents with pressure ulcers 12.4%
135% worse than Illinois average

Illinois average: 5.3%

Urinary Tract Infection Info Percent of long-stay residents with a urinary tract infection 2.0%
11% worse than Illinois average

Illinois average: 1.8%

Lost Too Much Weight Info Percent of long-stay residents who lose too much weight 16.7%
155% worse than Illinois average

Illinois average: 6.5%

Depressive Symptoms Info Percent of long-stay residents who have depressive symptoms 22.9%
52% better than Illinois average

Illinois average: 48.1%

Antipsychotic Use Info Percent of long-stay residents who received an antipsychotic medication 3.9%
81% better than Illinois average

Illinois average: 20.2%

Pneumococcal Vaccine Info Percent of long-stay residents assessed and appropriately given the pneumococcal vaccine 100.0%
12% better than Illinois average

Illinois average: 89.2%

Short-stay resident measures
Pneumococcal Vaccine Info Percent of short-stay residents assessed and appropriately given the pneumococcal vaccine 92.0%
35% better than Illinois average

Illinois average: 68.3%

Antipsychotic medication increase Info Percent of short-stay residents who newly received an antipsychotic medication 1.8%
25% better than Illinois average

Illinois average: 2.3%

Influenza Vaccine Info Percent of short-stay residents assessed and appropriately given the seasonal influenza vaccine 87.7%
39% better than Illinois average

Illinois average: 63.0%

Breakdown by payment type

Medicare

89% of new residents, usually for short-term rehab.

Typical stay 20 days

Private pay

10% of new residents, often for short stays.

Typical stay 3 - 4 months

Facility Characteristics

Source: CMS Long-Term Care Facility Characteristics (Data as of Jan 2026)

Total residents 34
Medicare
22
64.7% of residents
Medicaid
3
8.8% of residents
Private pay or other
9
26.5% of residents
Programs & Services
Residents Group

Residents meet regularly to discuss policies, care quality, and activities

Active Resident Council

Organized group of residents that meets regularly to discuss facility policies, quality of life, and activities.

Finances and operations

Based on CMS SNF Cost Report for fiscal year ending in 12/2023.

Nonprofit
Nonprofit Corporation
Net patient revenue Info Net patient revenue — what the home actually collects for resident care, after contractual allowances, bad debt and discounts are subtracted from its gross charges (CMS cost report, Worksheet G-3). It covers resident care only; money the home earns from other sources is shown separately as "Other income."
$7.2M
Net patient income Info Net patient income: net patient revenue minus the home's total operating expenses. A positive figure means it earns more from resident care than it spends to deliver it; a negative figure means the opposite. It excludes non-operating "other income."
-$156.6K
Nonprofit Nonprofit Corporation
Net patient revenue Info Net patient revenue — what the home actually collects for resident care, after contractual allowances, bad debt and discounts are subtracted from its gross charges (CMS cost report, Worksheet G-3). It covers resident care only; money the home earns from other sources is shown separately as "Other income."
$7.2M Rank #137 / 171Revenue — State benchmarkedThis home is ranked 137th out of 171 homes in Illinois. Shows this facility's annual revenue compared to the Illinois average. Higher revenue generally means more resources for staffing and capital — read alongside Payroll %.Rankings are based only on facilities in Illinois that report data for that category. Facilities without available data are excluded from the ranking.Click the rank badge to see the full State ranking.Click here to see the full State ranking.
Net patient income Info Net patient income: net patient revenue minus the home's total operating expenses. A positive figure means it earns more from resident care than it spends to deliver it; a negative figure means the opposite. It excludes non-operating "other income."
-$156.6K
Other income Info Money the home earns outside of resident care — such as investments, grants, rentals and other non-operating sources (CMS cost report, Worksheet G-3). It is tracked separately from net patient revenue: it is not part of that figure, and it is not included in net patient income.
$28.8K
Payroll costs Info Staff salaries plus wage-related costs — benefits such as payroll taxes, health insurance and retirement — from the home's own accounting records (CMS cost report, Worksheet A). Contract or agency labor is counted separately, under other operating costs. Rank #143 / 171Payroll — State benchmarkedThis home is ranked 143rd out of 171 homes in Illinois. Shows total annual staff payroll benchmarked to the Illinois average. Higher payroll investment relative to peers often signals better staffing and less reliance on cheaper contract labor.Rankings are based only on facilities in Illinois that report data for that category. Facilities without available data are excluded from the ranking.Click the rank badge to see the full State ranking.Click here to see the full State ranking.
$4.5M 62.4% of net patient revenue Info Payroll as a share of revenue: staff salaries and wage-related benefits divided by net patient revenue. A higher figure means more of each revenue dollar goes to staff pay. Rank #76 / 171Payroll % — State benchmarkedThis home is ranked 76th out of 171 homes in Illinois. Shows payroll as a percentage of revenue versus the Illinois average. Well-run Illinois facilities typically land around 54–67% — the top third Statewide. Below 25% may signal understaffing or heavy agency use — read with Staffing ratings.Rankings are based only on facilities in Illinois that report data for that category. Facilities without available data are excluded from the ranking.Click the rank badge to see the full State ranking.Click here to see the full State ranking.
Other operating costs Info Everything it costs to run the home apart from payroll — food, utilities, supplies, maintenance, contract labor and administration. Calculated as total operating expense minus payroll (staff salaries and wage-related benefits).
$2.9M
Total costs Info The home's total operating expense for the year — all the costs of running it, salaries included (CMS cost report, Worksheet G-3).
$7.4M

What does this home offer?

Housing options icon

Housing Options: Private Rooms

Building type icon
Building type icon

Building Type: Single-story

On-site medical care and health services icon

On-site Medical Care and Health Services

Rehabilitative support icon

Rehabilitative Support

Beauty services icon

Beauty Services

Housekeeping icon
Housekeeping icon

Housekeeping Services

Social and recreational activities icon

Social and Recreational Activities

Transportation services icon

Transportation Services

Who this home usually serves

TYPE OF STAY

Mostly short-term rehab stays

Most residents typically stay for a few weeks or months before returning home or moving on.

Most new residents arrive under Medicare (89% of admissions), and a typical Medicare stay runs around 20 days.

Admissions
436 total

Coverage residents most often arrive under.

Medicare 89%
Private pay 10%
Discharges
431 total

Coverage residents most often leave under.

Medicare 86%
Private pay 14%
Medicaid 1%

Places of interest near Fair Oaks Health Care Center

Address 1.9 miles from city center Info Estimated distance in miles from Crystal Lake's city center to Fair Oaks Health Care Center's address, calculated via Google Maps.

Calculate Travel Distance to Fair Oaks Health Care Center

Add your location

Address

Compare Assisted Living around Crystal Lake

The information below is reported by the Illinois Department of Public Health, Office of Health Care Regulation.

Fair Oaks Health Care Center
AL
HC
IL
MC
RC
NH
Crystal Lake -
51
Facility 51
IL AVG 86
Rank #292 / 426
-
29
Facility 29
IL AVG 51
Rank #502 / 648
Private Rooms
Crystal Pines Rehabilitation & Health Care Center
AL
HC
MC
NH
Crystal Lake -
110
Facility 110
IL AVG 86
Rank #101 / 426
-
46
Facility 46
IL AVG 51
Rank #365 / 648
-
The Pearl of Crystal Lake
AL
MC
NH
RC
Crystal Lake -
97
Facility 97
IL AVG 86
Rank #132 / 426
-
2
Facility 2
IL AVG 51
Rank #629 / 648
-

Financial Assistance for
Assisted Living in Illinois

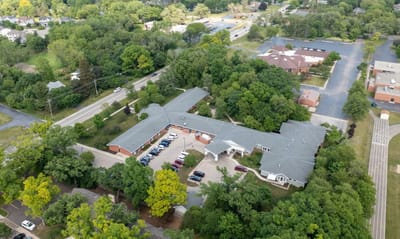
Fair Oaks Health Care Center is located in Crystal Lake, Illinois.
Here are the financial assistance programs available to residents in Illinois.

Get Financial aid guidance

Community Care Program

Illinois CCP

Age 60+
General Illinois resident, at risk of nursing home placement.
Income Limits (2025) ~$1,215/month individual
Asset Limits $17,500 individual, excludes home, car
IL

High demand in urban areas; waitlists possible.

Benefits
In-home care (3-5 hours/day) Adult day services ($65/day) Emergency home response systems ($30/month)

Illinois Respite Program

IL Respite (via NFCSP)

Age Caregiver of someone 60+ (or with dementia)
General Illinois resident.
Income Limits No strict limit; prioritizes low-income.
Asset Limits Not applicable.
IL

Limited slots; urban/rural balance.

Benefits
In-home respite (4-6 hours/day) Adult day care (~$65/day) Short-term facility care (up to 5 days)

Supportive Living Program (SLP)

Illinois Medicaid Supportive Living Program

Age 65+ or 22-64 with disability
General Illinois resident, Medicaid-eligible, needs moderate assistance (not nursing home-level).
Income Limits (2025) ~$2,829/month (300% FBR, individual); QIT allowed.
Asset Limits $2,000 (individual), $3,000 (couple) (excludes home, car).
IL

~200 SLP sites statewide; room/board not covered.

Benefits
Personal care (5-7 hours/day, e.g., bathing, mobility) Meals Housekeeping Medication management Respite (~240 hours/year)

Persons Who Are Elderly Waiver

Illinois Medicaid Elderly Waiver

Age 65+
General Illinois resident, Medicaid-eligible, nursing home-level care need.
Income Limits (2025) ~$2,829/month 300% FBR, individual
Asset Limits $2,000 (individual), $3,000 (couple).
IL

Part of HealthChoice Illinois; consumer-directed options available.

Benefits
Personal care (5-7 hours/day, e.g., dressing, eating) Homemaker Adult day care (~$60/day) Respite (240 hours/year) Home mods ($1,000 avg.)

Medicare Savings Program (MSP)

Illinois Medicare Savings Program

Age 65+ or disabled
General Illinois resident, Medicare Part A/B.
Income Limits (2025) ~$2,510/month (QMB), ~$3,380/month (SLMB), ~$3,598/month (QI)—individual.
Asset Limits $9,430 (individual), $14,130 (couple).
IL

Three tiers; no waitlist.

Benefits
Covers Part B premiums ($174.70/month) Deductibles ($240/year) Copays (~20%)

Optional State Supplementation (OSS)

Illinois Optional State Supplementation

Age 65+ or disabled
General Illinois resident, in approved facility, SSI recipient or low-income.
Income Limits (2025) ~$1,004/month including SSI
Asset Limits $2,000 (individual), $3,000 (couple).
IL

~$50-$500/month based on facility type.

Benefits
Cash (~$50-$500/month) for room/board in personal care homes or SLFs

VA Aid and Attendance (A&A) and Housebound Benefits

Illinois VA Aid and Attendance/Housebound

Age 65+ or disabled veteran/spouse
General Illinois resident, wartime service, need for ADL help (A&A) or homebound.
Income Limits (2025) Net income < ~$1,984/month (veteran with dependent, A&A); pension offsets income.
Asset Limits ~$155,356 net worth limit
IL

High veteran demand in urban/rural areas.

Benefits
Cash (~$1,433-$2,642/month veteran, ~$951-$1,318 spouse) for care costs (e.g., in-home, assisted living)

Frequently Asked Questions about Fair Oaks Health Care Center

Is Fair Oaks Health Care Center in a walkable area?

Fair Oaks Health Care Center has a walk score of 29. Somewhat walkable. A few nearby services may be reachable on foot, but most trips require transportation.

What is the occupancy rate at Fair Oaks Health Care Center?

Fair Oaks Health Care Center's occupancy is 74.2%.

What is the best email address for Fair Oaks Health Care Center?

The team at Fair Oaks Health Care Center can be reached at [email protected].

Does Fair Oaks Health Care Center operate as a for-profit or non-profit?

Fair Oaks Health Care Center is registered as a non-profit.

Are there photos of Fair Oaks Health Care Center?

Yes — there are 7 photos of Fair Oaks Health Care Center in the photo gallery on this page.

What is the address of Fair Oaks Health Care Center?

Fair Oaks Health Care Center is located at 471 W Terra Cotta Ave, Crystal Lake, IL 60014.

What is the phone number of Fair Oaks Health Care Center?

(815) 455-0550 will put you in contact with the team at Fair Oaks Health Care Center.

Guides for Better Senior Living

Care Cost Calculator: See Prices in Your Area

Nursing Home Data Explorer

Don’t Wait Too Long: 7 Red Flag Signs Your Parent Needs Assisted Living Now

The True Cost of Assisted Living in 2025 – And How Families Are Paying For It

Understanding Senior Living Costs: Pricing Models, Discounts & Financial Assistance