Total health inspections
4
New Hampshire average 3.5
Last Health inspection on Nov 2024

We arrange tours, appointments, and even moving support so you don’t have to
Thank you for your interest!
Our team will be in touch shortly to help with next steps.
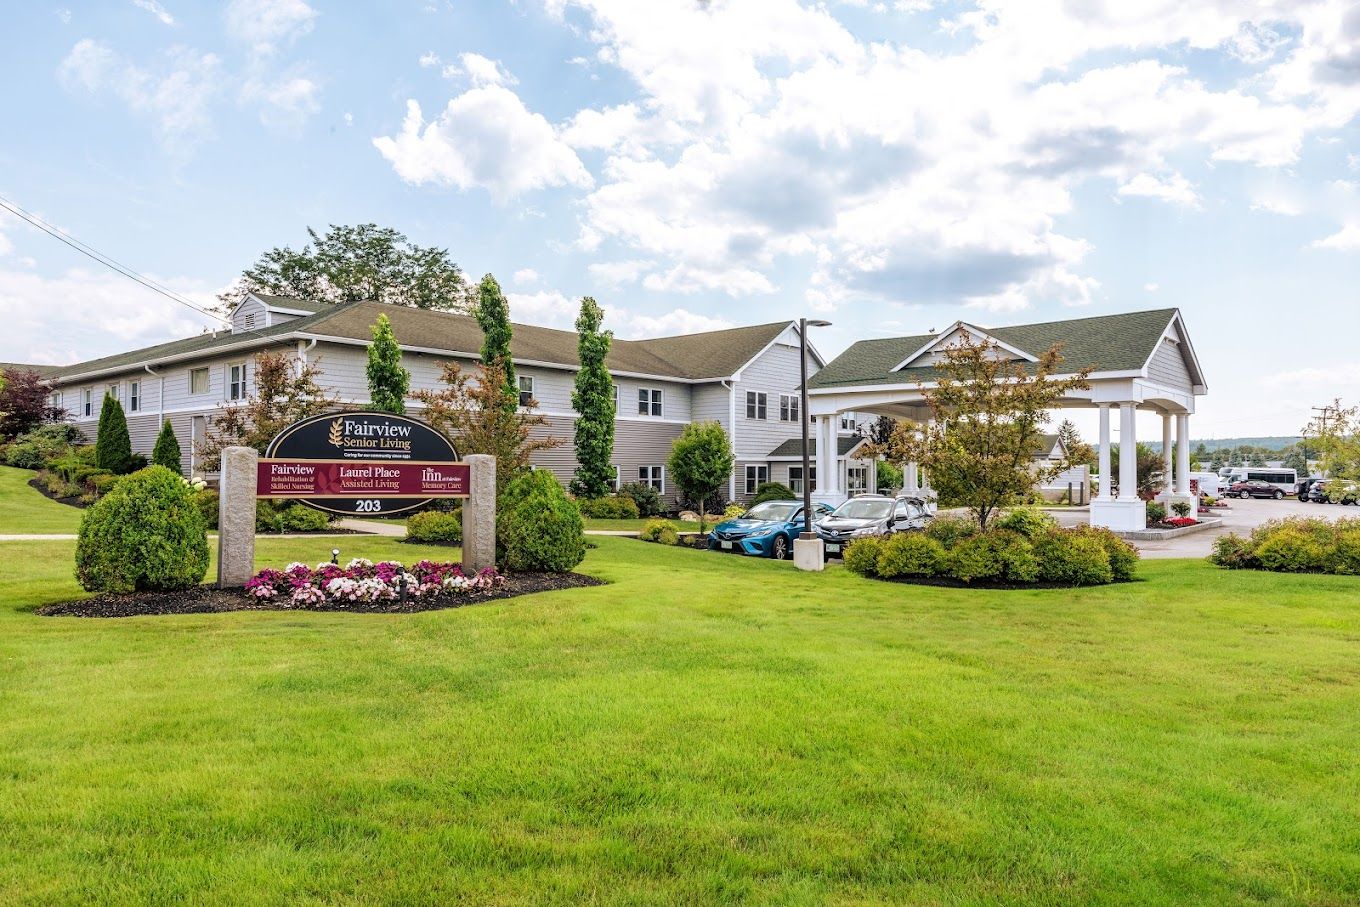
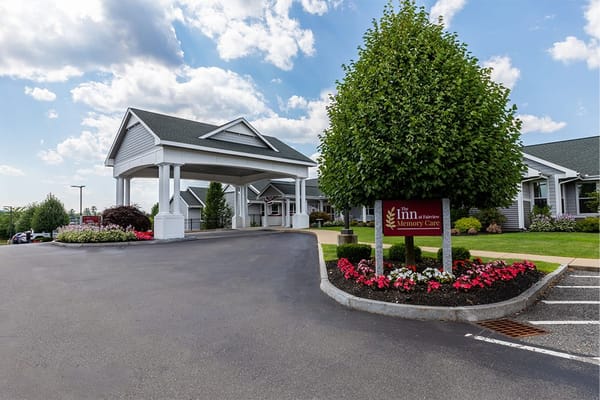
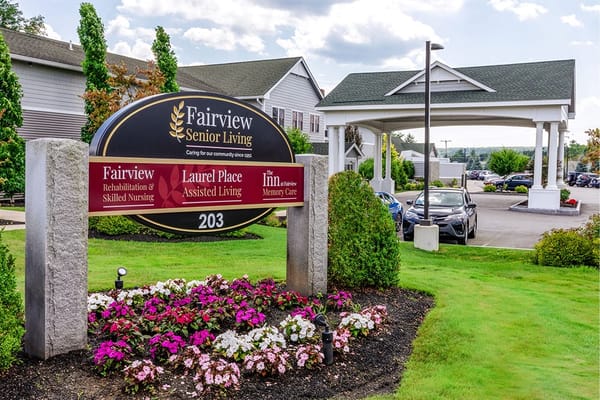
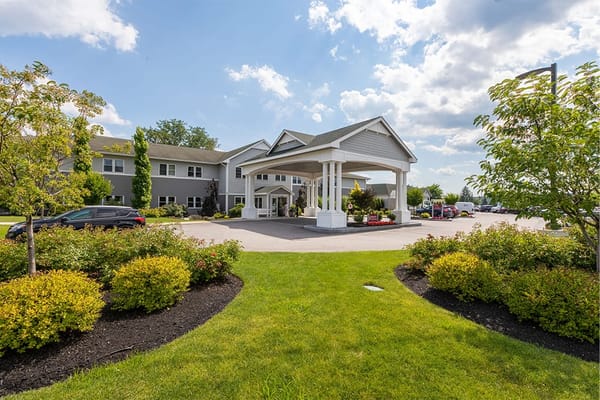
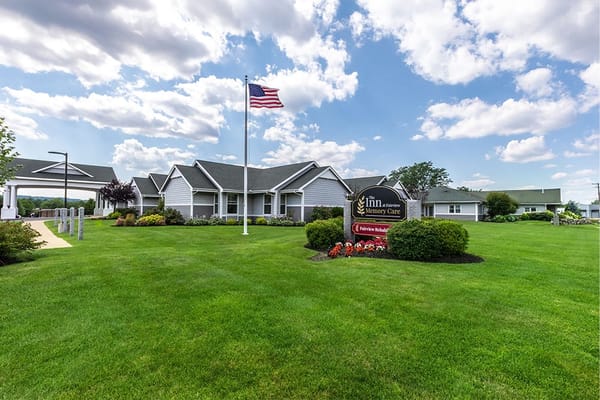
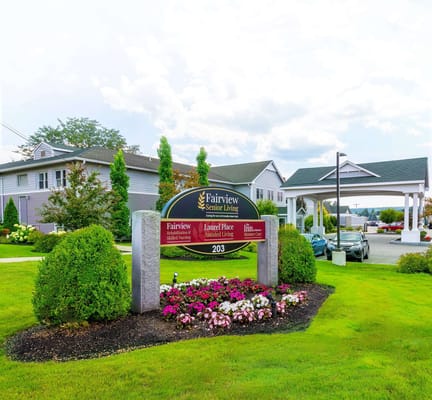
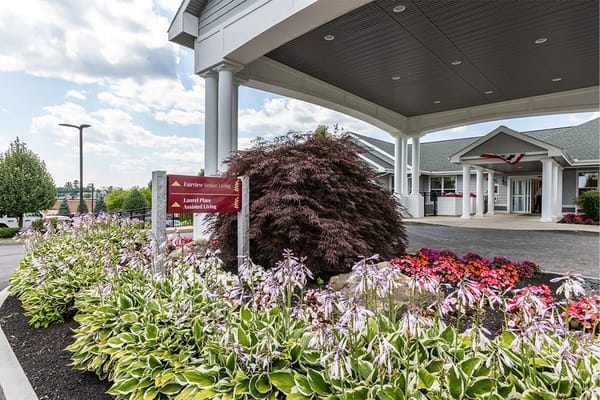
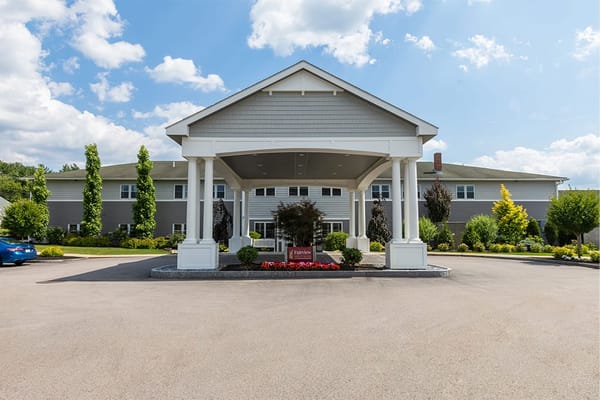
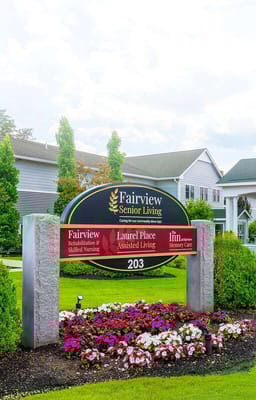
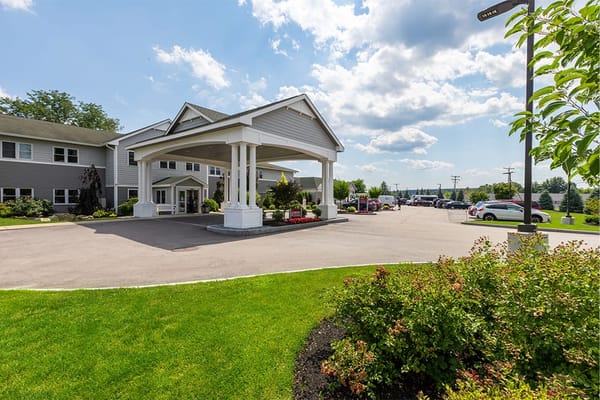
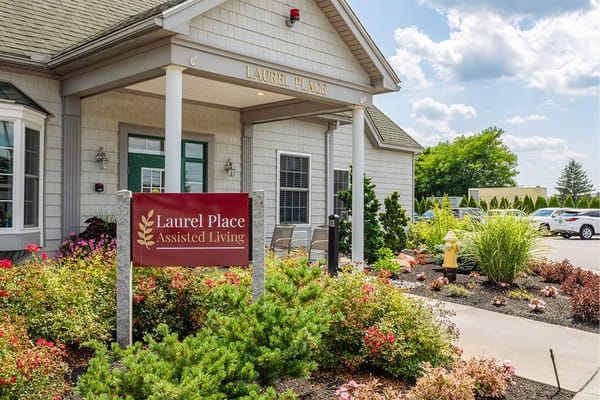
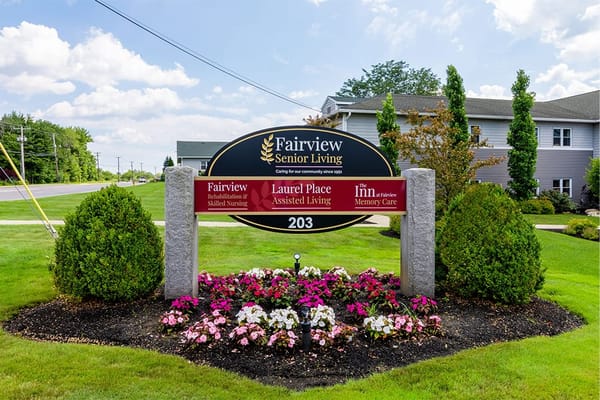
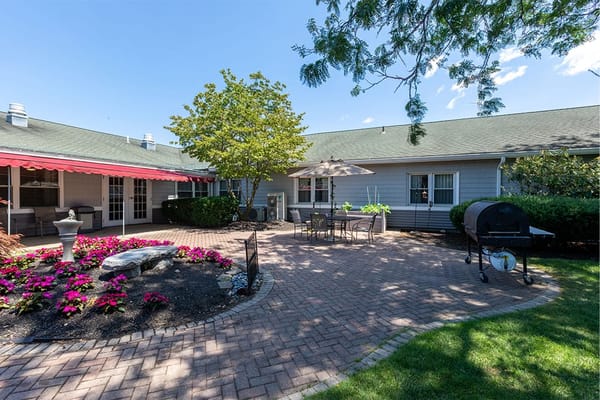
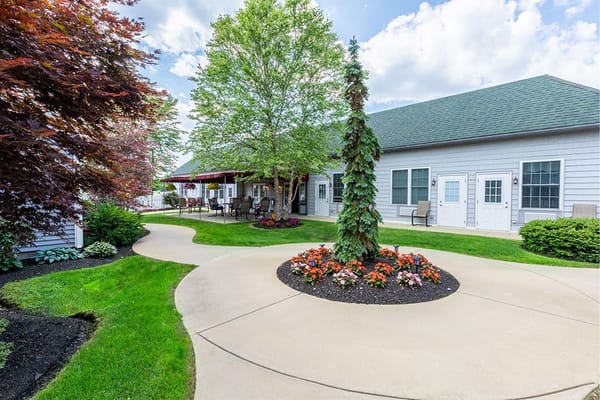
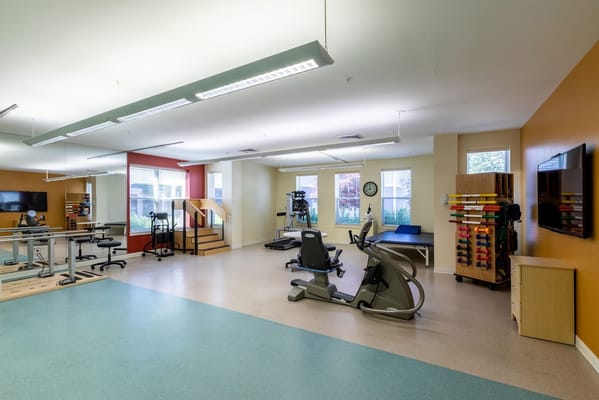
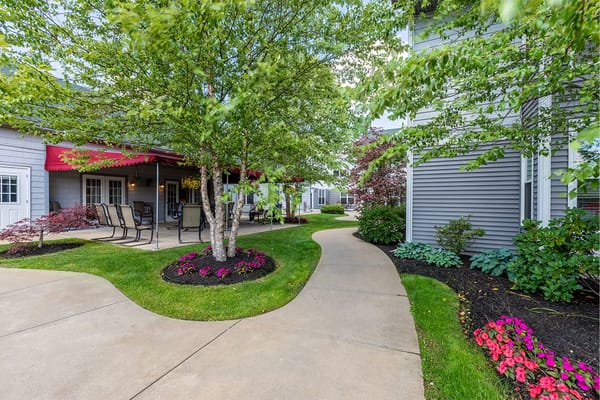
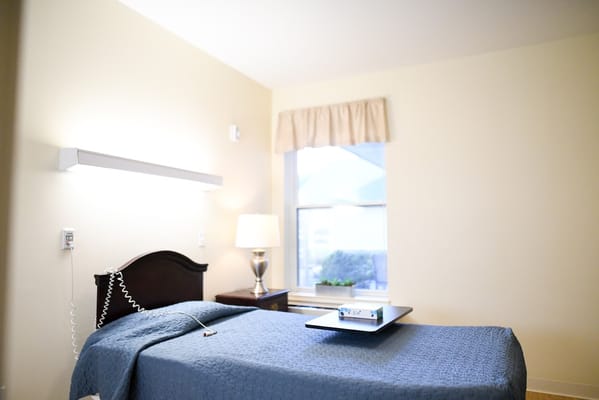
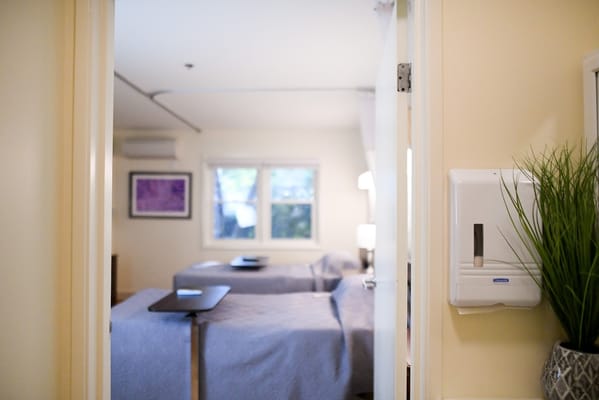
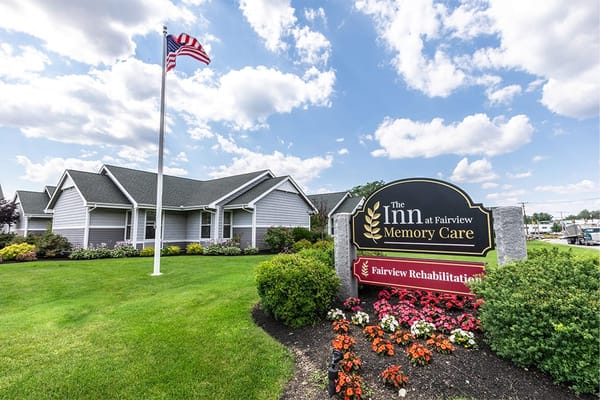


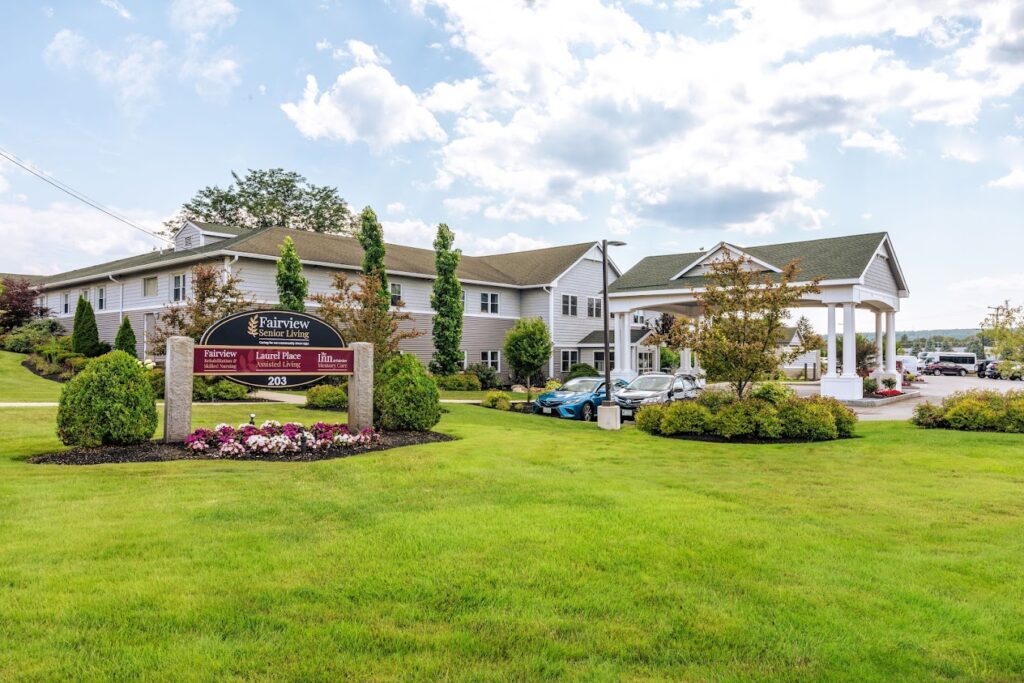
Fairview Senior Living, a cherished home located in the serene town of Hudson, New Hampshire. With a rich history dating back to 1951, this exceptional community has been dedicated to providing top-notch memory care living and assisted living places for seniors. Offering a comprehensive range of care options, including skilled nursing care and rehabilitation, Fairview Senior Living stands out for its commitment to be the best nursing home in New Hampshire.
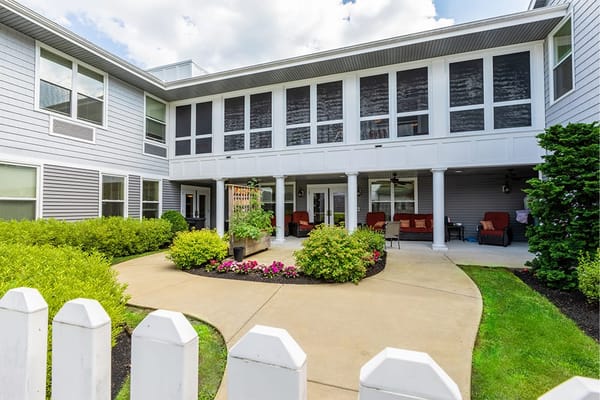
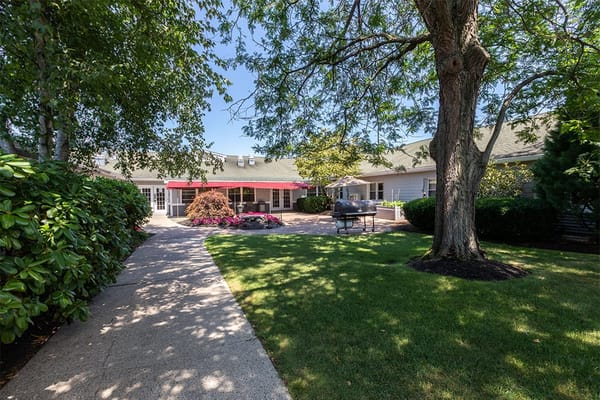
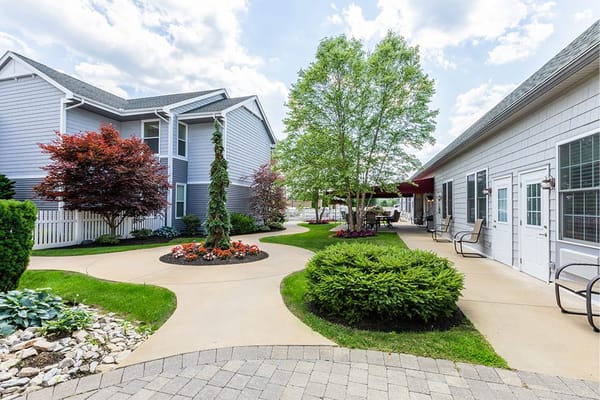
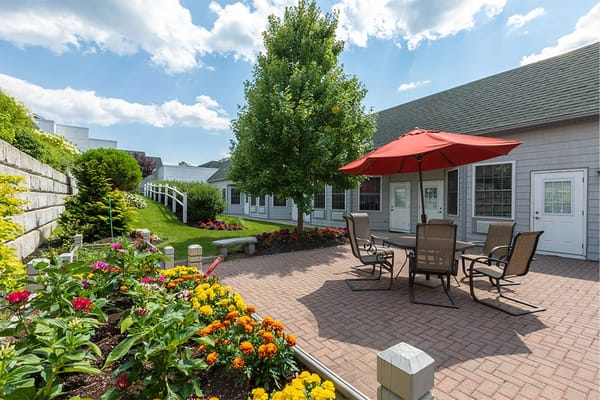
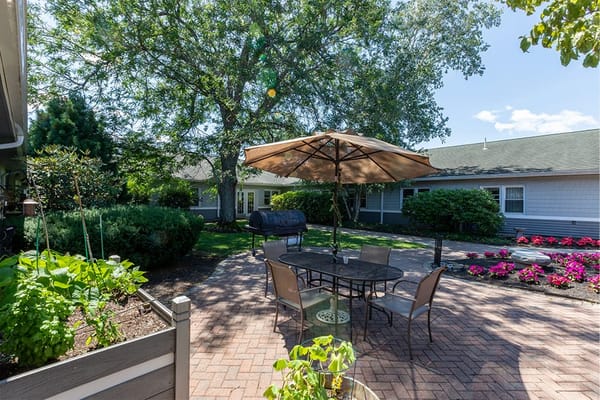
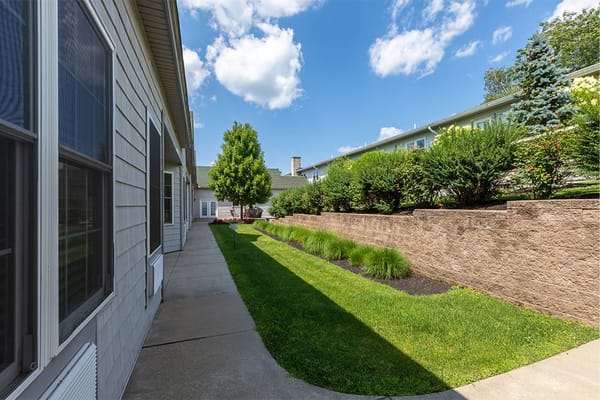
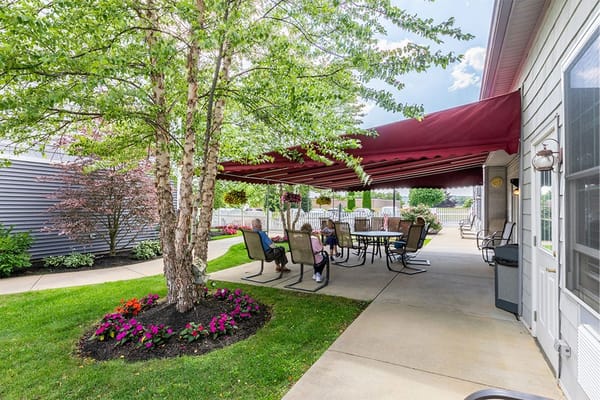
Nestled amidst picturesque surroundings, this lush community serves as a sanctuary where seniors can find peace and tranquility. From engaging in enriching activities like group exercise and dance classes to enjoying the camaraderie of vibrant community outings, every moment at Fairview Senior Living is filled with opportunities for connection and fulfillment. The memory care living program is designed specifically to meet the unique needs of individuals with memory-related conditions, providing specialized care and support to enhance their quality of life. In line with the dedication to nursing home quality measures, Fairview Senior Living continuously monitors and evaluates its services to ensure they meet the highest standards of care. By prioritizing the well-being and happiness of the residents, Fairview Senior Living aims to create an environment where seniors and their families feel confident and reassured.
Steve Pazulski is an accomplished healthcare executive with over 20 years of experience as an Administrator and Operator in senior living. Under his leadership, Fairview Senior Living is recognized for service excellence and compassionate, individualized care. He is a Licensed Administrator in multiple states and actively contributes to healthcare associations, demonstrating a strong commitment to quality senior care.
Offers a balance of services and community atmosphere.
Occupancy is moderate, suggesting balanced demand.
Most residents typically stay for a few weeks or months before returning home or moving on.
68% of new residents, usually for short-term rehab.
32% of new residents, often for short stays.
Fairview Senior Living is administrated by Stephan Pazulski.
Key information about the people who lead and staff this community.
In New Hampshire, the Department of Health and Human Services, Health Facilities Administration is responsible for the unannounced inspection and licensing of all residential care and nursing facilities.
4 visits/inspections triggered by complaints
1 routine inspections
4 with issues
0 without issues
Deficiencies indicate regulatory issues. A higher number implies the facility had several areas requiring improvement.
New Hampshire average: 17 deficiencies
New Hampshire average 3.5
Last Health inspection on Nov 2024
New Hampshire average 14.4
New Hampshire average 3.99
Health citations are formal notices following inspections when they fail to comply with safety and care standards.
10 of 15 citations resulted from standard inspections; 2 of 15 resulted from complaint investigations; and 3 of 15 came from combined inspections (standard and complaint).
New Hampshire average: 0.2
New Hampshire average: 0.1
Data sourced from CMS Health Deficiencies reports. Citation severity codes range from A (least serious) to L (most serious). Immediate Jeopardy (J-L) citations indicate situations where the facility's noncompliance has placed residents at risk of death or serious harm.
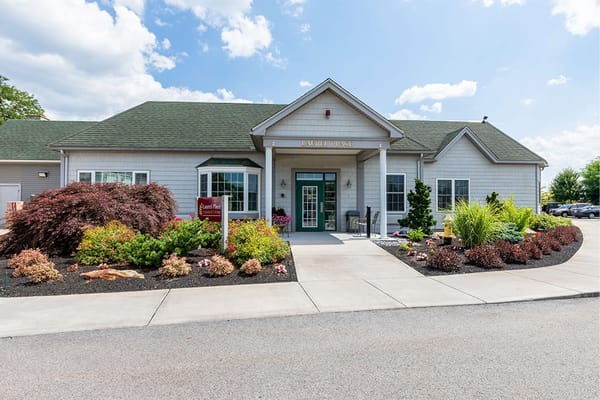
Memory Care Secured, specialized care for people living with Alzheimer's or dementia. Staff trained in cognitive impairment, with higher staff-to-resident ratios and an environment designed to reduce confusion and wandering risk.
Nursing Home Licensed facility providing 24/7 skilled nursing care for residents with complex, ongoing medical needs. Staffed by RNs, LPNs, and CNAs. Inspected and star-rated annually by CMS. Accepts Medicare (short-term rehab) and Medicaid (long-term care).
Assisted Living A licensed, long-term care setting for seniors or individuals with disabilities who need help with daily activities — like bathing, dressing, and medication management — but not 24-hour skilled nursing. Offers housing, meals, and around-the-clock support while aiming to maximize resident independence.
Nursing Home Licensed facility providing 24/7 skilled nursing care for residents with complex, ongoing medical needs. Staffed by RNs, LPNs, and CNAs. Inspected and star-rated annually by CMS. Accepts Medicare (short-term rehab) and Medicaid (long-term care).
Nursing Home Licensed facility providing 24/7 skilled nursing care for residents with complex, ongoing medical needs. Staffed by RNs, LPNs, and CNAs. Inspected and star-rated annually by CMS. Accepts Medicare (short-term rehab) and Medicaid (long-term care).
![]() 3.8 miles from city center — 2.83 miles to nearest hospital (St. Joseph Hospital)
3.8 miles from city center — 2.83 miles to nearest hospital (St. Joseph Hospital)
Add your location
This data corresponds to Q2 2025 and is based on CMS Payroll-Based Journal.
New Hampshire average ratio: 1.87:1
New Hampshire average: 7.8 hours
Manages medical care and health needs.
This role is partially covered by contractors.
Assists with medical care and medications.
This role is partially covered by contractors.
Helps with daily care and mobility.
This role is partially covered by contractors.
Total hours from contractors
7,859 contractor hours this quarter
| Certified Nursing Assistant | 48 | 55 | 103 | 18,708 | 91 | 100% | 8.5 |
| Licensed Practical Nurse | 19 | 12 | 31 | 8,123 | 91 | 100% | 9.1 |
| Registered Nurse | 12 | 12 | 24 | 4,137 | 91 | 100% | 9.3 |
| Other Dietary Services Staff | 10 | 0 | 10 | 3,533 | 91 | 100% | 6.8 |
| Clinical Nurse Specialist | 3 | 0 | 3 | 1,470 | 66 | 73% | 7.5 |
| Physical Therapy Assistant | 0 | 7 | 7 | 1,080 | 76 | 84% | 7.1 |
| Medication Aide/Technician | 2 | 0 | 2 | 996 | 81 | 89% | 9.6 |
| Speech Language Pathologist | 0 | 2 | 2 | 867 | 67 | 74% | 7.4 |
| Respiratory Therapy Technician | 0 | 3 | 3 | 791 | 75 | 82% | 6.9 |
| Qualified Social Worker | 0 | 2 | 2 | 626 | 77 | 85% | 5.2 |
| Physical Therapy Aide | 0 | 2 | 2 | 517 | 61 | 67% | 7.9 |
| Nurse Practitioner | 1 | 0 | 1 | 495 | 66 | 73% | 7.5 |
| Administrator | 1 | 0 | 1 | 488 | 65 | 71% | 7.5 |
| RN Director of Nursing | 1 | 0 | 1 | 488 | 65 | 71% | 7.5 |
| Mental Health Service Worker | 1 | 0 | 1 | 488 | 65 | 71% | 7.5 |
| Dental Services Staff | 1 | 0 | 1 | 423 | 64 | 70% | 6.6 |
| Occupational Therapy Aide | 1 | 0 | 1 | 418 | 53 | 58% | 7.9 |
Source: CMS Long-Term Care Facility Characteristics (Data as of Jan 2026)
Residents meet regularly to discuss policies, care quality, and activities
Organized group of residents that meets regularly to discuss facility policies, quality of life, and activities.
Data sourced from CMS Long-Term Care Facility Characteristics quarterly report. Payer mix reflects the current resident census by primary payment source.
These measures show how residents usually do over time at this home, based on health outcomes and preventive care.
New Hampshire average: 11.4
New Hampshire average: 23.2
New Hampshire average: 21.9%
New Hampshire average: 20.3%
New Hampshire average: 27.1%
New Hampshire average: 4.6%
New Hampshire average: 4.5%
New Hampshire average: 2.5%
New Hampshire average: 5.6%
New Hampshire average: 8.3%
New Hampshire average: 17.4%
New Hampshire average: 96.0%
New Hampshire average: 98.0%
New Hampshire average: 1.65
New Hampshire average: 1.90
New Hampshire average: 83.8%
New Hampshire average: 1.6%
New Hampshire average: 83.0%
New Hampshire average: 22.1%
New Hampshire average: 14.1%
New Hampshire average: 0.8%
New Hampshire average: 53.7%
New Hampshire average: 50.6%
Quality measures are calculated from Minimum Data Set (MDS) assessments. For most measures, lower percentages indicate better care quality.
Historical financial and operational data for Fairview Senior Living based on CMS SNF Cost Reports.
Loading trend charts...
Care Cost Calculator: See Prices in Your Area
Nursing Home Data Explorer
Don’t Wait Too Long: 7 Red Flag Signs Your Parent Needs Assisted Living Now
The True Cost of Assisted Living in 2025 – And How Families Are Paying For It
Understanding Senior Living Costs: Pricing Models, Discounts & Financial Assistance

Touring a community? Use this expert-backed checklist to stay organized, ask the right questions, and find the perfect fit.
We'll send you a PDF version of the touring checklist.