


Total health inspections
4
New Hampshire average 3.5
Last Health inspection on Oct 2024
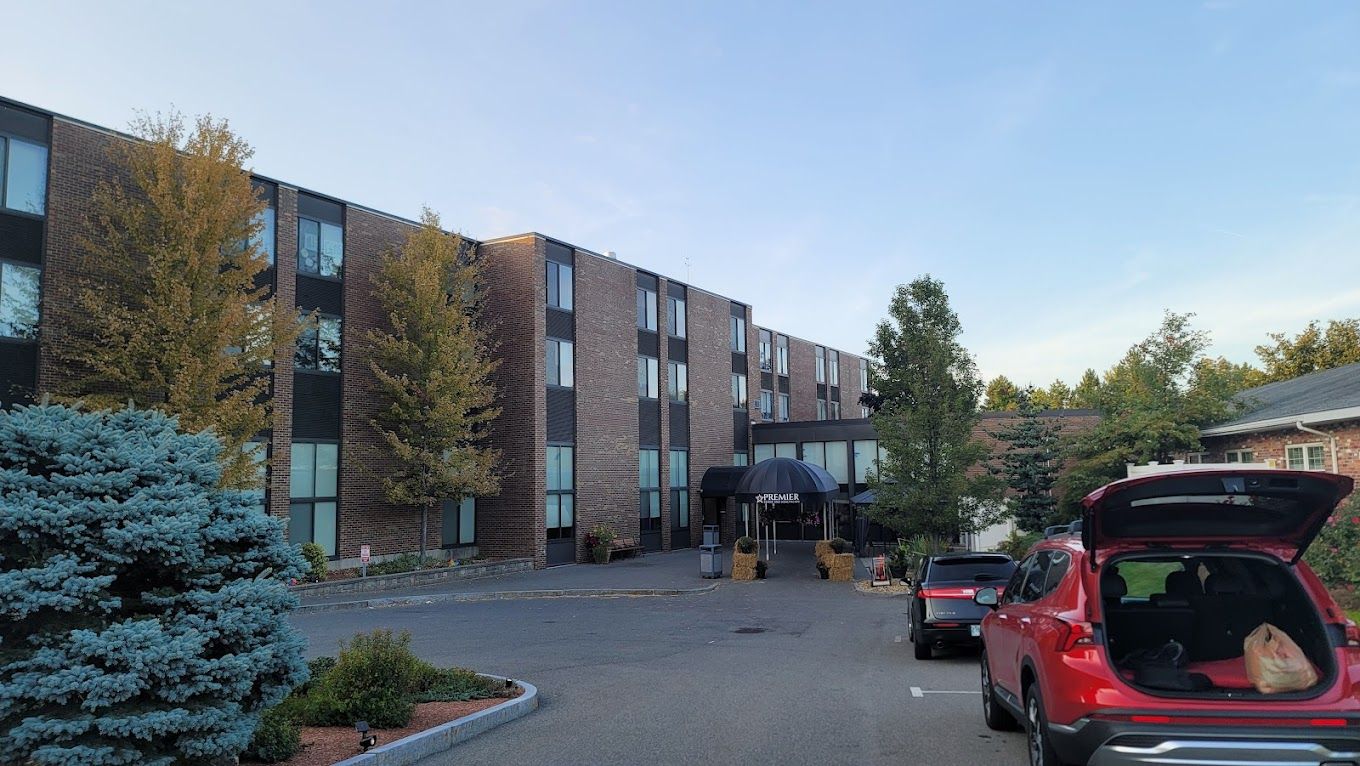

Premier Rehab and Healthcare provides exceptional nursing home care in the heart of Nashua, New Hampshire. From intensive short-term rehabilitation therapy to comprehensive long-term respiratory care, they offer a full range of services designed to meet every individual’s unique needs. With round-the-clock skilled nursing available, you can rest assured that compassionate and experienced professionals are always there to attend to your needs.
Additionally, they specialize in Alzheimer’s and dementia care, offering a supportive and understanding environment for those facing memory-related challenges. From IV therapy to dialysis, cardiac care to oncology care, their expertise extends to a wide range of medical conditions, ensuring that residents receive the highest level of support from an interdisciplinary team of specialists.
| Staff type | Hours / Day / Resident | vs state avg |
|---|---|---|
|
Registered Nurse (RN)
| 41m per day | ▼ 9% State avg: 45m per day · National avg: 41m per day |
|
LPN / LVN
| 45m per day | ▼ 3% State avg: 46m per day · National avg: 52m per day |
|
Nurse Aide
| 1h 34m per day | ▼ 34% State avg: 2h 23m per day · National avg: 2h 21m per day |
|
Weekend Total Nursing
| 2h 35m per day | ▼ 25% State avg: 3h 26m per day · National avg: 3h 26m per day |
|
Physical Therapist
| 2m per day | ▼ 46% State avg: 4m per day · National avg: 4m per day |
|
Weekend RN
| 28m per day | ▼ 8% State avg: 31m per day · National avg: 29m per day |
Key information about the people who lead and staff this community.
In New Hampshire, the Department of Health and Human Services, Health Facilities Administration is responsible for the unannounced inspection and licensing of all residential care and nursing facilities.
Deficiencies
| This Facility | NH Average | vs. NH Avg |
|---|---|---|---|
|
Total deficiencies
| 42 | 17 | This facility has 147% more total deficiencies than a typical New Hampshire nursing home (42 vs. NH avg 17).↑ 147% worse |
New Hampshire average 3.5
Last Health inspection on Oct 2024
New Hampshire average 14.4
New Hampshire average 3.99
Health citations are formal notices following inspections when they fail to comply with safety and care standards.
24 of 25 citations resulted from standard inspections; and 1 of 25 resulted from complaint investigations.
New Hampshire average: 0.2
New Hampshire average: 0.1
Reporting period: October 1 – December 31, 2025 (Q4 2025). Source: CMS Payroll-Based Journal report.
Manages medical care and health needs.
Assists with medical care and medications.
Helps with daily care and mobility.
Total hours from contractors
9,237 contractor hours this quarter
| Certified Nursing Assistant | 79 | 10 | 89 | 32,870 | 92 | 100% | 9.1 |
| Licensed Practical Nurse | 39 | 1 | 40 | 13,271 | 92 | 100% | 9.1 |
| Registered Nurse | 25 | 7 | 32 | 10,291 | 92 | 100% | 9.3 |
| Other Dietary Services Staff | 12 | 0 | 12 | 4,345 | 92 | 100% | 6.5 |
| Clinical Nurse Specialist | 10 | 0 | 10 | 3,524 | 75 | 82% | 8 |
| RN Director of Nursing | 5 | 0 | 5 | 2,288 | 70 | 76% | 8 |
| Dental Services Staff | 15 | 0 | 15 | 1,823 | 82 | 89% | 8.2 |
| Mental Health Service Worker | 4 | 0 | 4 | 1,494 | 77 | 84% | 7.5 |
| Speech Language Pathologist | 0 | 3 | 3 | 1,131 | 91 | 99% | 7.4 |
| Physical Therapy Assistant | 0 | 3 | 3 | 954 | 81 | 88% | 7.8 |
| Respiratory Therapy Technician | 0 | 5 | 5 | 750 | 78 | 85% | 6.2 |
| Dietitian | 2 | 0 | 2 | 728 | 63 | 68% | 8 |
| Qualified Social Worker | 0 | 2 | 2 | 713 | 75 | 82% | 7.5 |
| Physical Therapy Aide | 0 | 3 | 3 | 706 | 68 | 74% | 7.2 |
| Occupational Therapy Aide | 3 | 0 | 3 | 635 | 56 | 61% | 8.8 |
| Qualified Activities Professional | 1 | 0 | 1 | 517 | 61 | 66% | 8.5 |
| Administrator | 1 | 0 | 1 | 504 | 63 | 68% | 8 |
| Nurse Practitioner | 1 | 0 | 1 | 488 | 60 | 65% | 8.1 |
Federal penalties imposed by CMS for regulatory violations, including civil money penalties (fines) and denials of payment for new Medicare/Medicaid admissions.
Source: CMS Penalties Database
No penalties in the past 3 years
No civil money penalties or payment denials were reported in the last 3 years.
These measures show how residents usually do over time at this home, based on health outcomes and preventive care.
New Hampshire average: 11.4
New Hampshire average: 23.2
New Hampshire average: 21.9%
New Hampshire average: 20.3%
New Hampshire average: 27.1%
New Hampshire average: 4.6%
New Hampshire average: 4.5%
New Hampshire average: 2.5%
New Hampshire average: 5.6%
New Hampshire average: 8.3%
New Hampshire average: 17.4%
New Hampshire average: 96.0%
New Hampshire average: 98.0%
New Hampshire average: 1.65
New Hampshire average: 1.90
New Hampshire average: 83.8%
New Hampshire average: 1.6%
New Hampshire average: 83.0%
New Hampshire average: 22.1%
New Hampshire average: 14.1%
New Hampshire average: 0.8%
New Hampshire average: 53.7%
New Hampshire average: 50.6%
Quality measures are calculated from Minimum Data Set (MDS) assessments. For most measures, lower percentages indicate better care quality.
35% of new residents, usually for short-term rehab.
42% of new residents, often for short stays.
24% of new residents, often for long-term daily care.
Source: CMS Long-Term Care Facility Characteristics (Data as of Jan 2026)
Residents meet regularly to discuss policies, care quality, and activities
Organized group of residents that meets regularly to discuss facility policies, quality of life, and activities.
Data sourced from CMS Long-Term Care Facility Characteristics quarterly report. Payer mix reflects the current resident census by primary payment source.
Historical financial and operational data for Premier Rehab and Healthcare from 2012–2023, based on CMS SNF Cost Reports.
Key figures below are for fiscal year ending in 12/2023.
Based on CMS SNF Cost Report for fiscal year ending in 12/2023.
This home supports both short-term rehab and long-term care, with residents staying for a wide range of durations.
New residents most often arrive under private pay (42% of admissions), and a typical private pay stay runs around 1 months.
Coverage residents most often arrive under.
Coverage residents most often leave under.
![]() 2.8 miles from city center
2.8 miles from city center
![]() Estimated distance in miles from Nashua's city center to Premier Rehab and Healthcare's address, calculated via Google Maps.
— 1.17 miles to nearest hospital (St. Joseph Hospital)
Estimated distance in miles from Nashua's city center to Premier Rehab and Healthcare's address, calculated via Google Maps.
— 1.17 miles to nearest hospital (St. Joseph Hospital)
Add your location
Info below is compiled from CMS reports & the NH Dept. of Health & Human Services (DHHS), senior community websites & trusted data sources such as Walk Score & BBB.
Communities are listed from highest to lowest based on our ranking methodology.
| The Courville at Nashua | NH AL MC SNF | Nashua (Hunt Street) | 94
Facility
94
NH AVG
70
Rank
#49 / 168 |
73.4%
Facility
73.4%
NH AVG
82.3
Rank
#42 / 51 | -11% | 3.64
Facility
3.64
NH AVG
4.28
Rank
#37 / 63 | +15% | -15% | $0
Facility
$0
NH AVG
$36.9k
Rank
#1 / 64 | 8
Facility
8
NH AVG
14.4
Rank
#14 / 64 | 2.7
Facility
2.7
NH AVG
4.0
Rank
#14 / 64 | - | 69 | - |
57
Facility
57
NH AVG
31
Rank
#47 / 228 | Richard Courville | $10.6MFiscal year ending 12/2023
Facility
$10.6MFiscal year ending 12/2023
NH AVG
$14.7M
Rank
#35 / 63 | $5.4MFiscal year ending 12/2023
Facility
$5.4MFiscal year ending 12/2023
NH AVG
$5.7M
Rank
#30 / 63 | 50.6%Fiscal year ending 12/2023
Facility
50.6%Fiscal year ending 12/2023
NH AVG
39.8%
Rank
#20 / 63 | 305037 | ||||
| Fairview Senior Living | NH AL MC RC SNF | Hudson (Lowell Road) | 101
Facility
101
NH AVG
70
Rank
#43 / 168 |
93.0%
Facility
93.0%
NH AVG
82.3
Rank
#10 / 51 | +13% | 3.88
Facility
3.88
NH AVG
4.28
Rank
#31 / 63 | +41% | -9% | $0
Facility
$0
NH AVG
$36.9k
Rank
#1 / 64 | 15
Facility
15
NH AVG
14.4
Rank
#35 / 64 | 3.8
Facility
3.8
NH AVG
4.0
Rank
#33 / 64 | - | 94 | A+ |
43
Facility
43
NH AVG
31
Rank
#71 / 228 | Fg Healthcare Properties, LLC | $24.6MFiscal year ending 12/2023
Facility
$24.6MFiscal year ending 12/2023
NH AVG
$14.7M
Rank
#5 / 63 | $11.2MFiscal year ending 12/2023
Facility
$11.2MFiscal year ending 12/2023
NH AVG
$5.7M
Rank
#13 / 63 | 45.6%Fiscal year ending 12/2023
Facility
45.6%Fiscal year ending 12/2023
NH AVG
39.8%
Rank
#62 / 63 | 305100 | ||||
| Premier Rehab and Healthcare | NH HOS PC RC SNF | Nashua (Harris Road) | 290
Facility
290
NH AVG
70
Rank
#2 / 168 |
82.1%
Facility
82.1%
NH AVG
82.3
Rank
#32 / 51 | 0% | 3.71
Facility
3.71
NH AVG
4.28
Rank
#35 / 63 | +9% | -13% | $0
Facility
$0
NH AVG
$36.9k
Rank
#1 / 64 | 25
Facility
25
NH AVG
14.4
Rank
#56 / 64 | 6.3
Facility
6.3
NH AVG
4.0
Rank
#56 / 64 | - | 238 | - |
17
Facility
17
NH AVG
31
Rank
#125 / 228 | Katrina Greenhalgh | $29.7MFiscal year ending 12/2023
Facility
$29.7MFiscal year ending 12/2023
NH AVG
$14.7M
Rank
#2 / 63 | $17.2MFiscal year ending 12/2023
Facility
$17.2MFiscal year ending 12/2023
NH AVG
$5.7M
Rank
#4 / 63 | 58%Fiscal year ending 12/2023
Facility
58%Fiscal year ending 12/2023
NH AVG
39.8%
Rank
#26 / 63 | 305005 |
Premier Rehab and Healthcare is located in Nashua, New Hampshire.
Here are the financial assistance programs available to residents in New Hampshire.
Premier Rehab and Healthcare is in the Harris Road neighborhood of Nashua.
Premier Rehab and Healthcare has a walk score of 17. Car-dependent. Most errands require a car, with limited nearby walkable options.
Premier Rehab and Healthcare's occupancy is 81.5%.
Premier Rehab and Healthcare has been operating for approximately 34 years, based on available licensing and registration records.
No, Premier Rehab and Healthcare has a no-pet policy.
Premier Rehab and Healthcare is registered as a for-profit in NH.
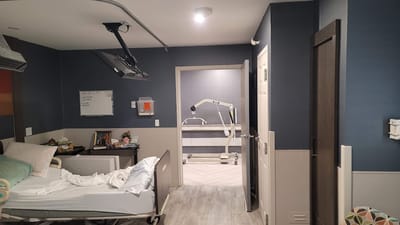
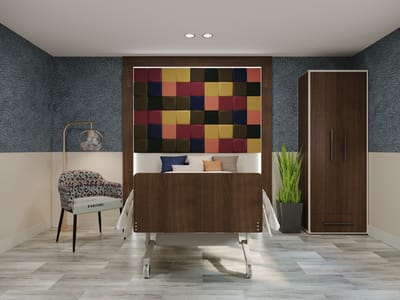
Yes — there are 4 photos of Premier Rehab and Healthcare in the photo gallery on this page.
Care Cost Calculator: See Prices in Your Area
Nursing Home Data Explorer
Don’t Wait Too Long: 7 Red Flag Signs Your Parent Needs Assisted Living Now
The True Cost of Assisted Living in 2025 – And How Families Are Paying For It
Understanding Senior Living Costs: Pricing Models, Discounts & Financial Assistance


