Total health inspections
3
State average 4.2
Last Health inspection on May 2023

We arrange tours, appointments, and even moving support so you don’t have to
Thank you for your interest!
Our team will be in touch shortly to help with next steps.
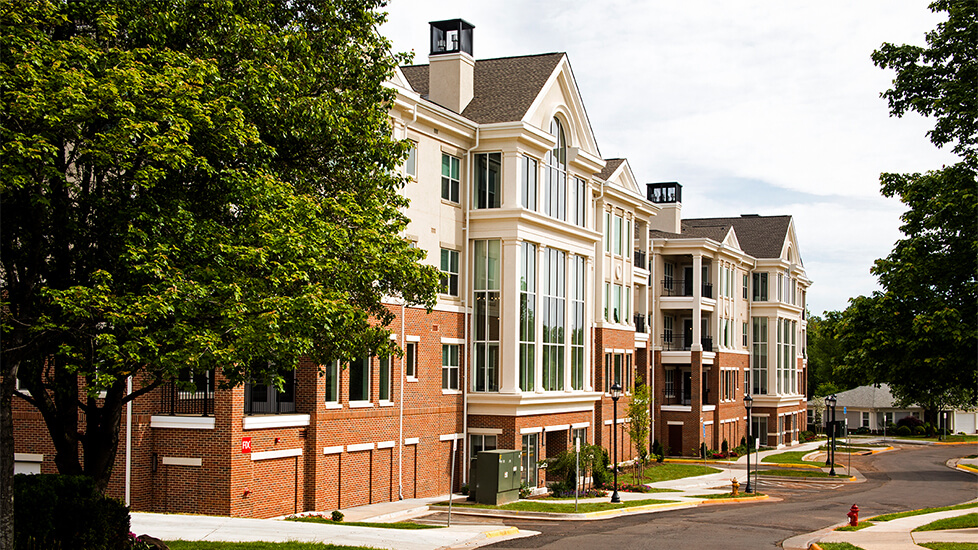
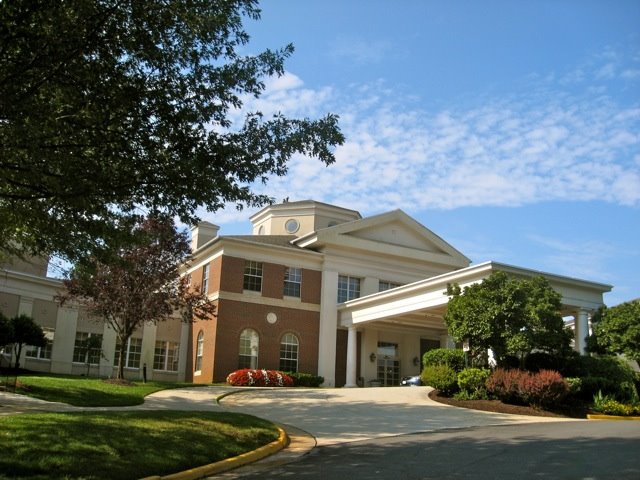
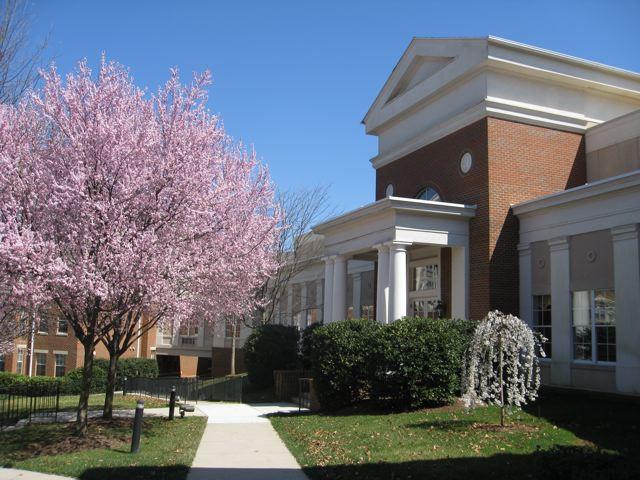
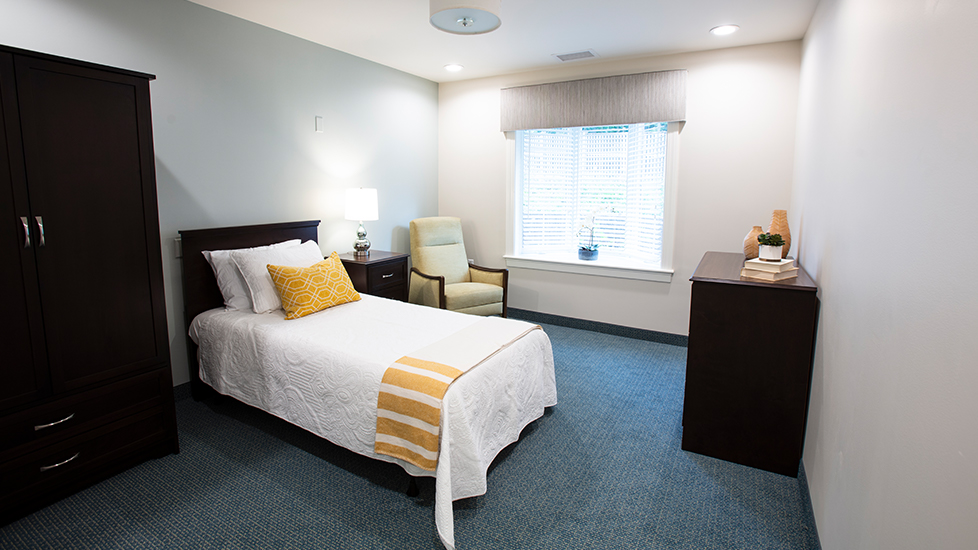
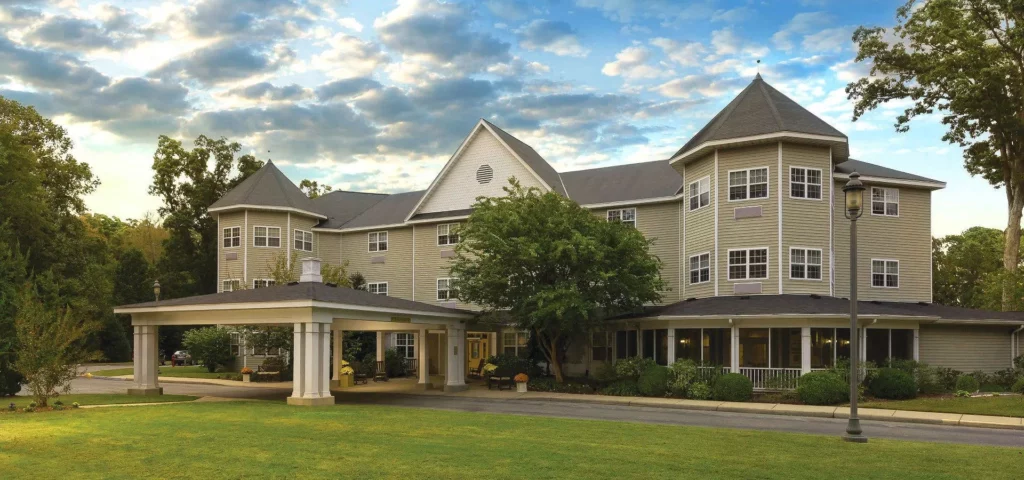
With more than two decades of exceptional service to the senior community and those that have served the nation, Falcon Landing provides premiere independent living, long-term care nursing, short-term rehab, assisted living and memory care in the Potomac Falls area. Committed to the utmost care for veterans and qualified former government employees through the Falcons Landing Life Plan Community, and the general public, Falcons Landing is a place to rest your wings.
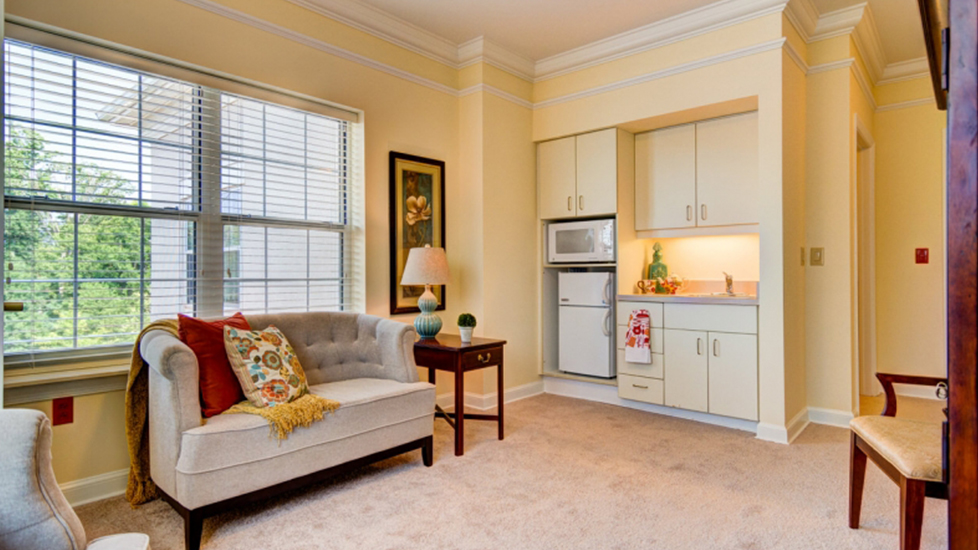
A testament to the promise of quality care that Falcons Landing takes pride in, as a not-for-profit senior living community, all funds are invested back into the continuous upgrading and maintenance of the community. This ensures that amenities and services such as living quarters, wellness programs, and dining experiences, are always at their very best.
Offers a balance of services and community atmosphere.
Lower occupancy suggests more openings may be available.
Most residents typically stay for a few weeks or months before returning home or moving on.
56% of new residents, usually for short-term rehab.
44% of new residents, often for short stays.
Key information about the people who lead and staff this community.
State average 4.2
Last Health inspection on May 2023
State average 38.4
State average 8.93
Health citations are formal notices following inspections when they fail to comply with safety and care standards.
All 11 citations resulted from standard inspections.
State average: 0.4
State average: 1
Data sourced from CMS Health Deficiencies reports. Citation severity codes range from A (least serious) to L (most serious). Immediate Jeopardy (J-L) citations indicate situations where the facility's noncompliance has placed residents at risk of death or serious harm.
Nursing Home Licensed facility providing 24/7 skilled nursing care for residents with complex, ongoing medical needs. Staffed by RNs, LPNs, and CNAs. Inspected and star-rated annually by CMS. Accepts Medicare (short-term rehab) and Medicaid (long-term care).
Nursing Home Licensed facility providing 24/7 skilled nursing care for residents with complex, ongoing medical needs. Staffed by RNs, LPNs, and CNAs. Inspected and star-rated annually by CMS. Accepts Medicare (short-term rehab) and Medicaid (long-term care).
Assisted Living A licensed, long-term care setting for seniors or individuals with disabilities who need help with daily activities — like bathing, dressing, and medication management — but not 24-hour skilled nursing. Offers housing, meals, and around-the-clock support while aiming to maximize resident independence.
Independent Living Lifestyle-focused communities for older adults offering dining, activities, and transportation with minimal personal care. Best for active, independent seniors who want community without medical support.
Memory Care Secured, specialized care for people living with Alzheimer's or dementia. Staff trained in cognitive impairment, with higher staff-to-resident ratios and an environment designed to reduce confusion and wandering risk.
Nursing Home Licensed facility providing 24/7 skilled nursing care for residents with complex, ongoing medical needs. Staffed by RNs, LPNs, and CNAs. Inspected and star-rated annually by CMS. Accepts Medicare (short-term rehab) and Medicaid (long-term care).
Assisted Living A licensed, long-term care setting for seniors or individuals with disabilities who need help with daily activities — like bathing, dressing, and medication management — but not 24-hour skilled nursing. Offers housing, meals, and around-the-clock support while aiming to maximize resident independence.
Independent Living Lifestyle-focused communities for older adults offering dining, activities, and transportation with minimal personal care. Best for active, independent seniors who want community without medical support.
Memory Care Secured, specialized care for people living with Alzheimer's or dementia. Staff trained in cognitive impairment, with higher staff-to-resident ratios and an environment designed to reduce confusion and wandering risk.
Assisted Living A licensed, long-term care setting for seniors or individuals with disabilities who need help with daily activities — like bathing, dressing, and medication management — but not 24-hour skilled nursing. Offers housing, meals, and around-the-clock support while aiming to maximize resident independence.
Home Care Professional care delivered in the person's own home — from companionship and errands to skilled nursing and therapy. Allows seniors to age in place. Medicare covers skilled home health when medically necessary.
![]() 157 miles from city center — 6.01 miles to nearest hospital (Reston Hospital Center)
157 miles from city center — 6.01 miles to nearest hospital (Reston Hospital Center)
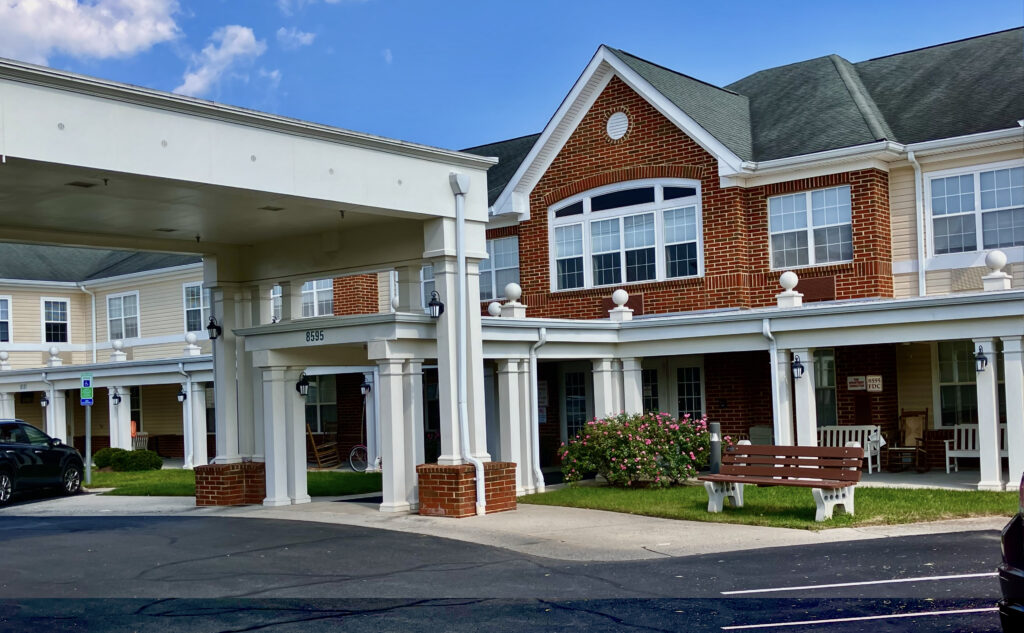
![]() 20522 Falcons Landing Cir, Potomac Falls, VA 20165
20522 Falcons Landing Cir, Potomac Falls, VA 20165
Add your location
This data corresponds to Q2 2025 and is based on CMS Payroll-Based Journal.
Virginia average ratio: 1.67:1
Virginia average: 8 hours
Manages medical care and health needs.
This role is partially covered by contractors.
Assists with medical care and medications.
This role is partially covered by contractors.
Helps with daily care and mobility.
This role is partially covered by contractors.
Total hours from contractors
3,047 contractor hours this quarter
| Certified Nursing Assistant | 36 | 12 | 48 | 13,053 | 91 | 100% | 10.1 |
| Licensed Practical Nurse | 16 | 3 | 19 | 5,096 | 91 | 100% | 10.5 |
| Registered Nurse | 3 | 1 | 4 | 1,168 | 67 | 74% | 10.3 |
| Respiratory Therapy Technician | 5 | 0 | 5 | 923 | 65 | 71% | 6.3 |
| Clinical Nurse Specialist | 2 | 0 | 2 | 827 | 83 | 91% | 9.6 |
| Speech Language Pathologist | 4 | 0 | 4 | 688 | 66 | 73% | 5.7 |
| Physical Therapy Assistant | 3 | 0 | 3 | 671 | 69 | 76% | 5.3 |
| RN Director of Nursing | 1 | 0 | 1 | 518 | 57 | 63% | 9.1 |
| Administrator | 1 | 0 | 1 | 512 | 64 | 70% | 8 |
| Nurse Practitioner | 1 | 0 | 1 | 512 | 64 | 70% | 8 |
| Other Dietary Services Staff | 3 | 0 | 3 | 511 | 64 | 70% | 7.4 |
| Feeding Assistant | 1 | 0 | 1 | 504 | 63 | 69% | 8 |
| Occupational Therapy Aide | 1 | 0 | 1 | 488 | 61 | 67% | 8 |
| Dietitian | 1 | 0 | 1 | 469 | 60 | 66% | 7.8 |
| Physical Therapy Aide | 1 | 0 | 1 | 379 | 63 | 69% | 6 |
| Medical Director | 1 | 0 | 1 | 256 | 64 | 70% | 4 |
| Qualified Social Worker | 2 | 0 | 2 | 228 | 63 | 69% | 3.5 |
| Mental Health Service Worker | 2 | 0 | 2 | 169 | 21 | 23% | 8 |
| Occupational Therapy Assistant | 0 | 1 | 1 | 27 | 10 | 11% | 2.7 |
| Other Physician | 0 | 1 | 1 | 20 | 6 | 7% | 3.3 |
Source: CMS Long-Term Care Facility Characteristics (Data as of Jan 2026)
Residents meet regularly to discuss policies, care quality, and activities
State-approved Nurse Aide Training and Competency Evaluation Program on-site
Part of a Continuing Care Retirement Community offering multiple care levels
Organized group of residents that meets regularly to discuss facility policies, quality of life, and activities.
Data sourced from CMS Long-Term Care Facility Characteristics quarterly report. Payer mix reflects the current resident census by primary payment source.
These measures show how residents usually do over time at this home, based on health outcomes and preventive care.
Virginia average: 10.1
Virginia average: 19.7
Virginia average: 16.8%
Virginia average: 19.7%
Virginia average: 22.6%
Virginia average: 3.6%
Virginia average: 5.4%
Virginia average: 1.5%
Virginia average: 5.9%
Virginia average: 14.9%
Virginia average: 12.9%
Virginia average: 91.3%
Virginia average: 94.0%
Virginia average: 74.9%
Virginia average: 1.2%
Virginia average: 73.6%
Quality measures are calculated from Minimum Data Set (MDS) assessments. For most measures, lower percentages indicate better care quality.
Historical financial and operational data for Falcons Landing based on CMS SNF Cost Reports.
Loading trend charts...
Care Cost Calculator: See Prices in Your Area
Nursing Home Data Explorer
Don’t Wait Too Long: 7 Red Flag Signs Your Parent Needs Assisted Living Now
The True Cost of Assisted Living in 2025 – And How Families Are Paying For It
Understanding Senior Living Costs: Pricing Models, Discounts & Financial Assistance
Touring a community? Use this expert-backed checklist to stay organized, ask the right questions, and find the perfect fit.
We'll send you a PDF version of the touring checklist.