Foxwood Springs Senior Living

Assisted Living & Independent Living · Missouri, MO
CMS overall rating Info The Overall CMS Rating is scored from 1 to 5 stars and combines results from health inspections, staffing levels, and quality measures. Health inspections carry the most weight. Staffing and quality scores can increase or decrease the final rating based on performance compared to state and national standards.
Foxwood Springs Senior Living

Assisted Living in Missouri

CMS overall rating Info The Overall CMS Rating is scored from 1 to 5 stars and combines results from health inspections, staffing levels, and quality measures. Health inspections carry the most weight. Staffing and quality scores can increase or decrease the final rating based on performance compared to state and national standards.
Calculator: See prices in your area
Foxwood Springs Senior Living accepts Medicare and private pay.

Overview of Foxwood Springs Senior Living

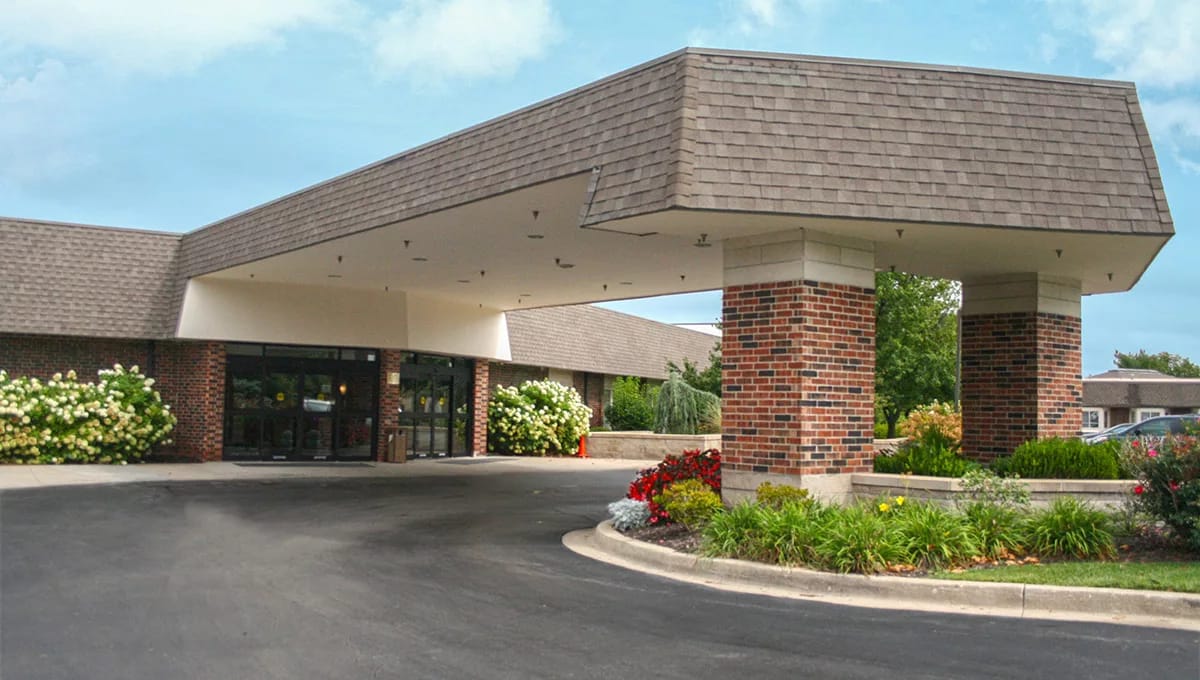
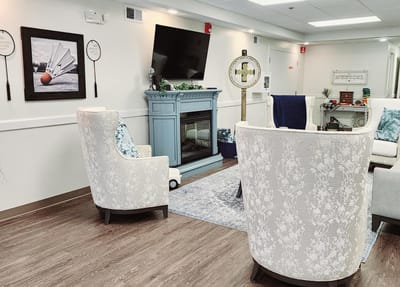
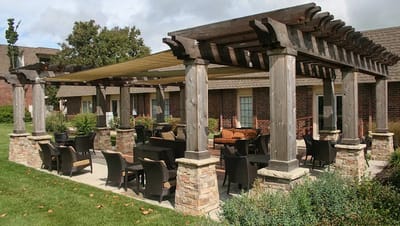
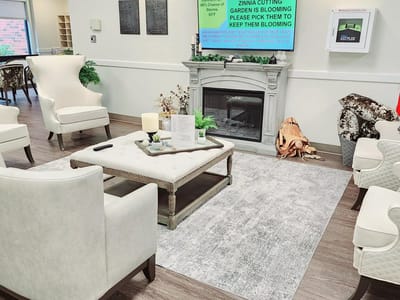
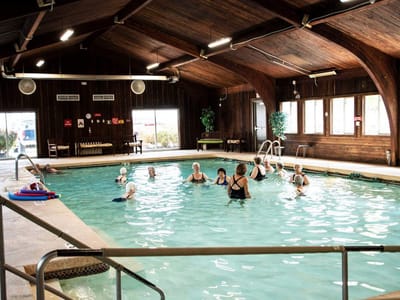
Discover Foxwood Springs, an esteemed senior living community situated in the heart of Raymore, Missouri, encompassing a scenic 138-acre campus. Upon stepping onto this tranquil landscape, a sense of warmth and hospitality embraces all who arrive. Foxwood Springs caters to those seeking an independent retirement lifestyle, where purposeful living harmonizes with the freedom of an active retirement. Residents delight in fostering rewarding friendships, pursuing meaningful activities, and cherishing a profound sense of community.

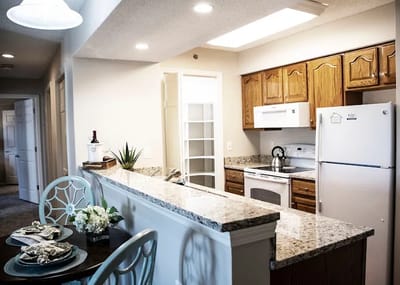
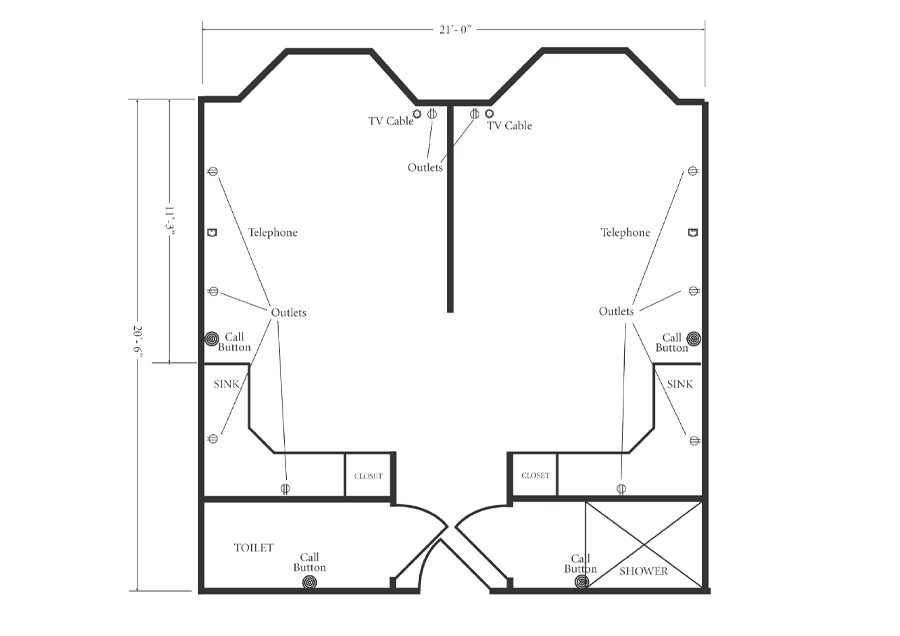
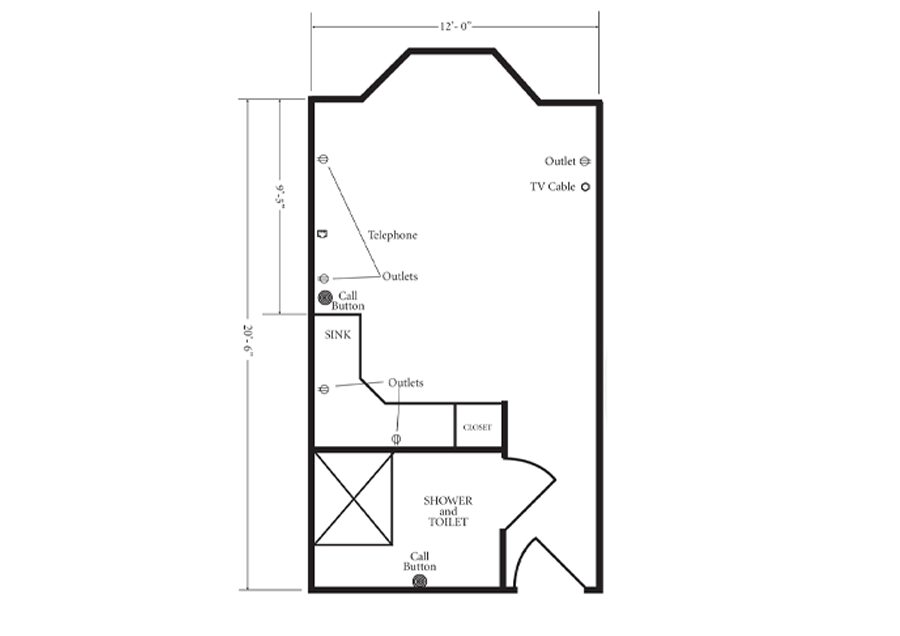
The community’s commitment extends beyond independence, providing access to various levels of senior living, including assisted living, memory care, long-term care, and short-term rehabilitation. Residents find solace and comfort in this vibrant haven, whether reveling in the natural light of their studio, one-bedroom, or two-bedroom apartments or enjoying the tranquility of garden homes with attached garages. Foxwood Springs invites seniors to embrace their golden years with elegance and fulfillment, where choice and freedom flourish.

(816) 331-3111

Quality ratings

Measured by Centers for Medicare & Medicaid Services (CMS)

Overall rating Info The Overall CMS Rating combines results from health inspections, staffing levels and quality measures. Health inspections carry the most weight. Staffing and quality scores can increase or decrease the final rating based on performance compared to state and national standards.
▲ 14.1% Above MO avg.
Health Inspection Info Based on the results of the facility's three most recent standard inspections and any complaint investigations. CMS reviews the number, scope, and severity of deficiencies, with more recent findings weighted more heavily.
▲ 3.4% Above MO avg.
Staffing Info Measures average nursing staff hours per resident per day, including Registered Nurses (RNs) and total nursing staff. Ratings are adjusted based on the level of care residents require and are compared to state and national benchmarks.
▲ 85.2% Above MO avg.
Quality Measures Info Based on clinical and physical health indicators reported to CMS, such as hospital readmissions, falls, pressure ulcers, and improvements in mobility. These measures reflect how well residents' health needs are being managed.
▲ 43.4% Above MO avg.

Staffing hours breakdown

Info Daily nursing hours per resident by staff type, reported to CMS. Higher is generally better — compare this facility to state and national averages to see where staffing stands.

Hours per resident per day — compared to Missouri state averages

Total nursing care / resident Info This home is ranked 36th out of 239 homes in Missouri.

Total adjusted nursing hours per resident per day, combining RN, LPN, and aide time. CMS adjusts this for case-mix so facilities can be fairly compared.
4h 28m per day
Rank #36 / 239Nurse hours — state benchmarkedThis home is ranked 36th out of 239 homes in Missouri.Shows adjusted nurse hours per resident per day benchmarked to the Missouri average, with a ranking across 239 Missouri SNFs. More hours mean more direct care. The national average is about 3.5 hrs; below 3.0 is a red flag.
This facility Missouri avg (3h 48m per day)
vs Missouri avg
+18%

0 of 6 metrics below state avg

Standout metric Physical Therapist is +100% above state avg
Staff typeHours / dayvs state avg
Registered Nurse (RN) Info RNs hold the highest nursing license and can assess residents, interpret test results, and direct care plans. More RN hours per day often signals stronger clinical oversight and faster response to health changes. 34m per day ▲ 21% State avg: 28m per day · National avg: 41m per day
LPN / LVN Info Licensed Practical Nurses (LPNs) or Licensed Vocational Nurses (LVNs) deliver routine hands-on care — medication administration, wound dressing, and monitoring vital signs. They work under RN supervision and make up a large share of daily bedside care. 54m per day ▲ 32% State avg: 41m per day · National avg: 52m per day
Nurse Aide Info Certified Nurse Aides (CNAs) provide the most direct day-to-day assistance: bathing, dressing, feeding, and mobility. Nurse aide hours are typically the largest staffing category and directly affect residents' quality of life. 2h 21m per day ■ Avg State avg: 2h 19m per day · National avg: 2h 20m per day
Total Nursing (Weekend) Info Combined nursing hours (RN + LPN + Nurse Aide) per resident per day on weekends. Staffing often drops on weekends — this figure reveals whether the facility maintains adequate coverage outside of weekday hours. 3h 22m per day ▲ 10% State avg: 3h 3m per day · National avg: 3h 26m per day
Physical Therapist Info Hours per resident per day provided by licensed Physical Therapists (PTs) or PT Assistants. PT services help residents recover mobility after injury or illness and are especially important for post-acute (short-stay) rehabilitation. 4m per day ▲ 100% State avg: 2m per day · National avg: 4m per day
RN (Weekend) Info Registered nurse hours specifically on weekends. Facilities sometimes reduce RN presence on Saturdays and Sundays — a low weekend RN figure compared to weekday hours can indicate reduced clinical oversight when most administrative staff are absent. 24m per day ▲ 20% State avg: 20m per day · National avg: 28m per day

Capacity and availability

Avg. Length of Stay
110 days

Who this home usually serves

TYPE OF STAY

Mix of rehab and long-term care

This home supports both short-term rehab and long-term care, with residents staying for a wide range of durations.

Breakdown by payment type

Medicare

49% of new residents, usually for short-term rehab.

Typical stay 25 days

Private pay

51% of new residents, often for short stays.

Typical stay 6 - 7 months

Finances and operations

Voluntary non-profit community
Home revenue
$28.1M
Operating deficit
-$1.2M
Voluntary non-profit community
Home revenue
$28.1M Rank #23 / 245Revenue — state benchmarkedThis home is ranked 23rd out of 245 homes in Missouri.Shows this facility's annual revenue compared to the Missouri SNF average. Higher revenue generally means more resources for staffing and capital — read alongside Payroll %.
Operating deficit
-$1.2M
Payroll costs Info The portion of the home's budget spent on staff, including nurses, caregivers, and other employees who support care and operations. Rank #4 / 245Payroll — state benchmarkedThis home is ranked 4th out of 245 homes in Missouri.Shows total annual staff payroll benchmarked to the Missouri average. Higher payroll investment relative to peers often signals better staffing and less reliance on cheaper contract labor.
$12.8M
45.6% of revenue Rank #10 / 245Payroll % — state benchmarkedThis home is ranked 10th out of 245 homes in Missouri.Shows payroll as a percentage of revenue versus the Missouri average. Well-run SNFs often land around 55–65%. Below 25% may signal understaffing or heavy agency use — read with Staffing ratings.
Other operating costs Info All remaining costs needed to run the home, such as food, utilities, building maintenance, supplies and administrative expenses.
$16.5M
Total costs $29.3M
Bed community size
62-bed community
A moderately sized community that may balance personal attention with shared amenities and social activities.
Walk Score
Walk Score: 50 / 100 Rank #16 / 66Walk Score — state benchmarkedThis home is ranked 16th out of 66 homes in Missouri.Shows how walkable this facility's neighborhood is compared to the average Walk Score across Missouri SNFs. Higher scores benefit residents, families, and staff.
Moderately walkable. Some errands can be accomplished on foot, with a mix of nearby amenities.

About this community

Occupancy

Occupancy rate
148%
Rank #1 / 245Occupancy rate — state benchmarkedThis home is ranked 1st out of 245 homes in Missouri.Shows this facility's occupancy rate versus the Missouri average, with its statewide rank out of 245. Higher occupancy signals strong local demand and financial stability.
Higher than the Missouri average: 66.6%
Occupied beds
92 / 62
Average residents per home in Missouri 72 per day

License Details

Facility TypeAssisted Living Facility
CountyCass
CMS Certification Number265803

Ownership & Operating Entity

Foxwood Springs Senior Living is legally operated by Raymore Senior Care Llc, and administrated by Derrick Minter.

Corporate EntityRAYMORE SENIOR CARE, LLC

Therapy & Rehabilitation

2 services
Rehabilitation Services
Respite Care

Staffing & Medical

1 service
Nursing Services

Amenities & Lifestyle

Community Garden
Landscaped Grounds
Greenhouse
Wood Shop
Bistro
Transportation
Fitness Center
Library
Billiards And Activity Center
Indoor Salt Water Pool
Stained Glass Art Studio
Beauty Salon/Barber Shop
Fireside Meeting Room
Courtyard
ActivitiesFoxwood Springs offers various activities including outings, entertainment events, and regular classes.
Specific ProgramsShort Term Rehab, In Home Care, Amenities & Services

Dining & Nutrition

Food DescriptionFoxwood Springs offers a Bistro and a variety of dining options.

Types of Care at Foxwood Springs Senior Living

Assisted Living Independent Living

Contact Foxwood Springs Senior Living

Inspection History

In Missouri, the Department of Health and Senior Services, Division of Regulation and Licensure performs the inspections and unannounced surveys required for all long-term care providers.

The data displayed corresponds to the last 6 years.

6 visits/inspections Info Inspections are mandatory, regular evaluations conducted by state health departments or regulatory agencies. They ensure the community provides safe, compliant care, covering areas like resident health, staff and management.

Latest inspection

Date October 22, 2025
Complaint Investigation

29 deficiencies

Deficiencies indicate regulatory issues. A higher number implies the facility had several areas requiring improvement.

Missouri average: 35 deficiencies

Health Inspection History

Inspections
Total health inspections 6

State average 6.6


Last Health inspection on Oct 2025

Total health citations
29 Rank #115 / 243Health citations — state benchmarkedThis home is ranked 115th out of 243 homes in Missouri.Shows this facility's total health deficiency citations benchmarked to the Missouri state average, with a ranking across all 243 MO SNFs. Lower citation counts earn a better rank.

State average 36.5

Citations per inspection
4.83 Rank #102 / 243Citations per inspection — state benchmarkedThis home is ranked 102nd out of 243 homes in Missouri.Shows average deficiency citations per CMS inspection for this facility versus the Missouri mean across 243 SNFs with citation data. Lower is better.

State average 5.67


Health citations are formal notices following inspections when they fail to comply with safety and care standards.

25 of 29 citations resulted from standard inspections; and 4 of 29 resulted from complaint investigations.

Breakdown of citation severity (last 5 years)
Critical Health citations More info
1
43% worse than State average

State average: 0.7


Serious Health citations More info 0
100% better than State average

State average: 1

1 critical citation More info State average: 0.7

0 serious citations More info State average: 1

28 moderate citations More info State average: 33.6

0 minor citations More info State average: 1.2
Citations history (last 5 years)
Pharmacy moderate citation Info Issues related to medication management, including how drugs are stored, administered, and monitored. Oct 22, 2025
Corrected

Administration moderate citation Info Issues related to how the facility is managed, including policies, procedures, and compliance with regulations. Jan 10, 2025
Corrected

Nutrition moderate citation Info Issues related to food quality, meal service, and resident's nutritional needs. Jan 10, 2025
Corrected

Quality of Care moderate citation Info Issues related to how well residents receive appropriate treatment and support for their medical and daily care needs. Jan 10, 2025
Corrected

Living Spaces & Floor Plans for Foxwood Springs Senior Living

Foxwood Springs Senior Living Suite
Foxwood Springs Senior Living Studio

Financial Assistance for
Assisted Living in Missouri

Foxwood Springs Senior Living is located in Raymore, Missouri.
Here are the financial assistance programs available to residents in Missouri.

Get Financial aid guidance

Aged and Disabled Waiver

Missouri Medicaid A&D Waiver

Age 65+ or disabled
General Missouri resident, Medicaid- eligible, nursing home-level care need.
Income Limits (2025) ~$2,829/month 300% FBR, individual
Asset Limits $2,000 (individual), $3,000 (couple).
MO

Rural access prioritized.

Benefits
Personal care (5-7 hours/day) Respite (240 hours/year) Adult day care (~$65/day) Home health services

Missouri Supplemental Nursing Care (SNC)

MO SNC

Age 65+
General Missouri resident, in approved facility.
Income Limits ~$1,215/month individual
Asset Limits $2,000 individual
MO

Supplements SSI; facility-based only.

Benefits
Monthly cash payment (~$156-$292/month) for care costs

Structured Family Caregiving Waiver (SFCW)

Missouri Structured Family Caregiving Waiver

Age 65+
General Missouri resident, MO HealthNet-eligible, NFLOC, dementia diagnosis, live with caregiver.
Income Limits (2025) ~$2,901/month (300% FBR, individual); QIT required.
Asset Limits $5,909.25 (individual), $11,818.45 (couple).
MO

Caregiver must be family; small program size.

Benefits
Cash stipend ($1,000-$1,500/month) to family caregiver Respite Training Supplies ($500/year)

MO HealthNet Aged, Blind, and Disabled (ABD)

Missouri MO HealthNet ABD

Age 65+ or disabled
General Missouri resident, MO HealthNet-eligible, needs help with 1+ ADL.
Income Limits (2025) ~$1,690/month (individual, projected); spenddown allowed.
Asset Limits $5,909.25 (individual), $11,818.45 (couple).
MO

Less intensive than waivers; statewide access.

Benefits
Personal care (2-4 hours/day) Homemaker services Limited respite Medical equipment

Medicare Savings Program (MSP)

Missouri Medicare Savings Program

Age 65+ or disabled
General Missouri resident, Medicare Part A/B.
Income Limits (2025) ~$2,510/month (QMB), ~$3,380/month (SLMB), ~$3,598/month (QI)—individual.
Asset Limits $9,430 (individual), $14,130 (couple).
MO

Three tiers; no waitlist; includes Extra Help for Part D.

Benefits
Covers Part B premiums ($174.70/month) Deductibles ($240/year) Copays (~20%)

Missouri Caregiver Program (Customized Caregiver Training & Relief)

Missouri Caregiver Program

Age
General Caregivers of 60+ with dementia, Missouri resident, functional needs (2+ ADLs).
Income Limits (2025) No strict cap; prioritizes low-income ~$24,980/year individual
Asset Limits Not assessed; need-based.
MO

Administered via AAAs and Alzheimer’s Association; rural focus.

Benefits
Respite (4-6 hours/week) Training Assistive tech ($500/year) Supplies

Senior Community Service Employment Program (SCSEP)

Missouri SCSEP

Age 55+
General unemployed, low-income, Missouri resident.
Income Limits (2025) ~$1,983/month 125% FPL
Asset Limits Not specified; income-focused.
MO

Priority for veterans, rural residents; AARP partnership.

Benefits
Paid training (~20 hours/week at ~$7.25/hour) Job placement

VA Aid and Attendance (A&A) and Housebound Benefits

Missouri VA Aid and Attendance/Housebound

Age 65+ or disabled veteran/spouse
General Missouri resident, wartime service, need for ADL help (A&A) or homebound.
Income Limits (2025) Net income < ~$1,984/month (veteran with dependent, A&A); pension offsets income.
Asset Limits ~$155,356 net worth limit
MO

High veteran demand in rural/urban areas.

Benefits
Cash (~$1,433-$2,642/month veteran, ~$951-$1,318 spouse) for care costs (e.g., in-home, assisted living)

Places of interest near Foxwood Springs Senior Living

Address 1.9 miles from city center Info Estimated distance in miles from Raymore's city center to Foxwood Springs Senior Living's address, calculated via Google Maps. — 10.59 miles to nearest hospital (St Joseph Medical Center: Wilson Luke A MD)

Calculate Travel Distance to Foxwood Springs Senior Living

Add your location

Address

Staffing Data (Q2 2025)

This data corresponds to Q2 2025 and is based on CMS Payroll-Based Journal.

Total staff 165
Employees 135
Contractors 30
Staff to resident ratio 1.96:1
15% better than Missouri average

Missouri average ratio: 1.71:1

Avg staff/day 50
Average shift 8.5 hours
5% better than Missouri average

Missouri average: 8.1 hours

Total staff hours (quarter) 38,806
Nursing staff breakdown
Registered Nurse

Manages medical care and health needs.

Total count 16
Average shift length Info Average shift length. Calculated as total hours divided by days worked and average staff per day. 9.6 hours

No contractors work on this role.

Licensed Practical Nurse

Assists with medical care and medications.

Total count 20
Average shift length Info Average shift length. Calculated as total hours divided by days worked and average staff per day. 9.5 hours

No contractors work on this role.

Certified Nursing Assistant

Helps with daily care and mobility.

Total count 59
Average shift length Info Average shift length. Calculated as total hours divided by days worked and average staff per day. 9.2 hours

No contractors work on this role.

Contractor staffing

Total hours from contractors

8.8%

3,410 contractor hours this quarter

Speech Language Pathologist: 9 Respiratory Therapy Technician: 5 Physical Therapy Aide: 5 Physical Therapy Assistant: 4 Qualified Social Worker: 3 Occupational Therapy Aide: 1 Medical Director: 1 Feeding Assistant: 1 Occupational Therapy Assistant: 1
Staff by category
Certified Nursing Assistant5905914,61791100%9.2
Licensed Practical Nurse200205,51691100%9.5
Medication Aide/Technician170173,64091100%10.3
Registered Nurse160163,57691100%9.6
Other Dietary Services Staff6062,16991100%7.8
RN Director of Nursing4041,8917178%7.9
Clinical Nurse Specialist4041,4287077%7.9
Mental Health Service Worker2021,0466571%8.3
Respiratory Therapy Technician0558417077%6.2
Physical Therapy Aide0556507785%5.7
Speech Language Pathologist0996477886%4.8
Physical Therapy Assistant0446458088%4.9
Administrator1015046369%8
Dietitian1015046369%8
Nurse Practitioner1014725965%8
Qualified Social Worker0334116774%5.6
Occupational Therapy Aide0111301820%7.2
Occupational Therapy Assistant0113833%12.7
Nurse Aide in Training404321314%2.5
Medical Director0112433%8
Feeding Assistant0112467%4
59 Certified Nursing Assistant
% of Days 100%
20 Licensed Practical Nurse
% of Days 100%
17 Medication Aide/Technician
% of Days 100%
16 Registered Nurse
% of Days 100%
6 Other Dietary Services Staff
% of Days 100%
4 RN Director of Nursing
% of Days 78%
4 Clinical Nurse Specialist
% of Days 77%
2 Mental Health Service Worker
% of Days 71%
5 Respiratory Therapy Technician
% of Days 77%
5 Physical Therapy Aide
% of Days 85%
9 Speech Language Pathologist
% of Days 86%
4 Physical Therapy Assistant
% of Days 88%
1 Administrator
% of Days 69%
1 Dietitian
% of Days 69%
1 Nurse Practitioner
% of Days 65%
3 Qualified Social Worker
% of Days 74%
1 Occupational Therapy Aide
% of Days 20%
1 Occupational Therapy Assistant
% of Days 3%
4 Nurse Aide in Training
% of Days 14%
1 Medical Director
% of Days 3%
1 Feeding Assistant
% of Days 7%

Facility Characteristics

Source: CMS Long-Term Care Facility Characteristics (Data as of Jan 2026)

Total residents 84
Medicare
12
14.3% of residents
Medicaid
34
40.5% of residents
Private pay or other
38
45.2% of residents
Programs & Services
Residents Group

Residents meet regularly to discuss policies, care quality, and activities

CCRC

Part of a Continuing Care Retirement Community offering multiple care levels

Active Resident Council

Organized group of residents that meets regularly to discuss facility policies, quality of life, and activities.

Quality of care over time

These measures show how residents usually do over time at this home, based on health outcomes and preventive care.

High-risk clinical events score Info A composite score based on pressure ulcers, falls with injury, weight loss, walking ability decline, and activities of daily living decline. 15.9
46% worse than Missouri average

Missouri average: 10.9

Functional decline score Info A composite score based on activities of daily living decline, walking ability decline, and incontinence. 30.7
58% worse than Missouri average

Missouri average: 19.5

Long-stay resident measures
Below average Missouri avg: 2.7 Info CMS star rating based on long-stay quality measure performance. 5 stars = significantly above average, 1 star = significantly below average.
Need for Help with Daily Activities Increased Info Percent of long-stay residents whose need for help with daily activities has increased 30.5%
54% worse than Missouri average

Missouri average: 19.8%

Walking Ability Worsened Info Percent of long-stay residents whose ability to move independently worsened 28.7%
39% worse than Missouri average

Missouri average: 20.6%

Low Risk Residents with Bowel/Bladder Incontinence Info Percent of low risk long-stay residents who lose control of their bowels or bladder 33.0%
82% worse than Missouri average

Missouri average: 18.1%

Falls with Major Injury Info Percent of long-stay residents experiencing one or more falls with major injury 8.4%
108% worse than Missouri average

Missouri average: 4.0%

High Risk Residents with Pressure Ulcers Info Percent of long-stay high risk residents with pressure ulcers 6.6%
31% worse than Missouri average

Missouri average: 5.0%

Urinary Tract Infection Info Percent of long-stay residents with a urinary tract infection 3.6%
32% worse than Missouri average

Missouri average: 2.7%

Lost Too Much Weight Info Percent of long-stay residents who lose too much weight 5.5%
In line with Missouri average

Missouri average: 5.6%

Depressive Symptoms Info Percent of long-stay residents who have depressive symptoms 3.8%
71% better than Missouri average

Missouri average: 12.8%

Antipsychotic Use Info Percent of long-stay residents who received an antipsychotic medication 13.7%
38% better than Missouri average

Missouri average: 22.0%

Pneumococcal Vaccine Info Percent of long-stay residents assessed and appropriately given the pneumococcal vaccine 95.1%
12% better than Missouri average

Missouri average: 85.2%

Influenza Vaccine Info Percent of long-stay residents assessed and appropriately given the seasonal influenza vaccine 96.1%
6% better than Missouri average

Missouri average: 90.9%

Hospitalizations per 1,000 days Info Number of hospitalizations per 1,000 long-stay resident days. 1.36
35% better than Missouri average

Missouri average: 2.08

ED visits per 1,000 days Info Number of outpatient emergency department visits per 1,000 long-stay resident days. 0.89
62% better than Missouri average

Missouri average: 2.35

Short-stay resident measures
Significantly above average Missouri avg: 2.1 Info CMS star rating based on short-stay quality measure performance. 5 stars = much above average, 1 star = much below average.
Pneumococcal Vaccine Info Percent of short-stay residents assessed and appropriately given the pneumococcal vaccine 55.9%
16% worse than Missouri average

Missouri average: 66.6%

Antipsychotic medication increase Info Percent of short-stay residents who newly received an antipsychotic medication 1.9%
17% better than Missouri average

Missouri average: 2.2%

Influenza Vaccine Info Percent of short-stay residents assessed and appropriately given the seasonal influenza vaccine 63.1%
In line with Missouri average

Missouri average: 63.5%

Re-hospitalized after SNF stay Info Percentage of short-stay residents who were re-hospitalized after their nursing home admission. 21.0%
17% better than Missouri average

Missouri average: 25.3%

Emergency department visits Info Percentage of short-stay residents who had an outpatient emergency department visit. 7.5%
44% better than Missouri average

Missouri average: 13.4%

Falls with major injury Info Percentage of SNF residents who experience falls with major injury during their stay. 0.0%
100% better than Missouri average

Missouri average: 0.8%

Ability to care for self at discharge Info Percentage of residents at or above expected ability to care for themselves at discharge. 64.5%
20% better than Missouri average

Missouri average: 53.7%

Successful return to home or community Info Rate of successful return to home or community from a skilled nursing facility. 57.4%
14% better than Missouri average

Missouri average: 50.6%

Penalties and fines

Federal penalties imposed by CMS for regulatory violations, including civil money penalties (fines) and denials of payment for new Medicare/Medicaid admissions.

Source: CMS Penalties Database (Data as of Jan 2026)

Total fines amount $14K
81% lower than Missouri average

Missouri average: $73K

Number of fines 1
59% fewer fines than Missouri average

Missouri average: 2.4

Payment Denials Info Serious action where Medicare and/or Medicaid temporarily stops payments for new residents until issues are fixed. 0
100% fewer payment denials than Missouri average

Missouri average: 0.7

Fines amount comparison
This facility $14K
Missouri average $73K
Penalty History

Penalties are imposed by CMS for violations of federal nursing home regulations.

1 penalty in the past 3 years

Feb 6, 2024 · $14K

Civil Money Penalty Info Fines imposed for noncompliance, which can be assessed per day or per instance of violation. Feb 6, 2024
$14K

Last updated: Jan 2026

Compare Assisted Living around Missouri The information below is reported by the Missouri Department of Health and Senior Services, Division of Regulation and Licensure.

Filter by care type
Benton House of Blue Springs
AL

Assisted Living A licensed, long-term care setting for seniors or individuals with disabilities who need help with daily activities — like bathing, dressing, and medication management — but not 24-hour skilled nursing. Offers housing, meals, and around-the-clock support while aiming to maximize resident independence.

MC

Memory Care Secured, specialized care for people living with Alzheimer's or dementia. Staff trained in cognitive impairment, with higher staff-to-resident ratios and an environment designed to reduce confusion and wandering risk.

Blue Springs95No 5 Studio / 1 BedCenterpoint Slp, Llc--
Foxwood Springs Senior Living
AL

Assisted Living A licensed, long-term care setting for seniors or individuals with disabilities who need help with daily activities — like bathing, dressing, and medication management — but not 24-hour skilled nursing. Offers housing, meals, and around-the-clock support while aiming to maximize resident independence.

NH

Nursing Home Licensed facility providing 24/7 skilled nursing care for residents with complex, ongoing medical needs. Staffed by RNs, LPNs, and CNAs. Inspected and star-rated annually by CMS. Accepts Medicare (short-term rehab) and Medicaid (long-term care).

IL

Independent Living Lifestyle-focused communities for older adults offering dining, activities, and transportation with minimal personal care. Best for active, independent seniors who want community without medical support.

Raymore62No 50 -Raymore Senior Care Llc--
Bristol Manor of Salisbury
AL

Assisted Living A licensed, long-term care setting for seniors or individuals with disabilities who need help with daily activities — like bathing, dressing, and medication management — but not 24-hour skilled nursing. Offers housing, meals, and around-the-clock support while aiming to maximize resident independence.

HC

Home Care Professional care delivered in the person's own home — from companionship and errands to skilled nursing and therapy. Allows seniors to age in place. Medicare covers skilled home health when medically necessary.

MC

Memory Care Secured, specialized care for people living with Alzheimer's or dementia. Staff trained in cognitive impairment, with higher staff-to-resident ratios and an environment designed to reduce confusion and wandering risk.

RC

Respite Care Short-term temporary care — days to weeks — to give family caregivers a break. Full care provided during the stay. Often used after hospitalization or to trial a facility before a permanent placement decision.

Salisbury12Yes 53 Studio / 1 BedBristol Care, Inc-A+
Anthology of Wildwood
AL

Assisted Living A licensed, long-term care setting for seniors or individuals with disabilities who need help with daily activities — like bathing, dressing, and medication management — but not 24-hour skilled nursing. Offers housing, meals, and around-the-clock support while aiming to maximize resident independence.

IL

Independent Living Lifestyle-focused communities for older adults offering dining, activities, and transportation with minimal personal care. Best for active, independent seniors who want community without medical support.

MC

Memory Care Secured, specialized care for people living with Alzheimer's or dementia. Staff trained in cognitive impairment, with higher staff-to-resident ratios and an environment designed to reduce confusion and wandering risk.

Wildwood (Grover)-Yes 55 --7A+
Aspen Valley Senior Homes
AL

Assisted Living A licensed, long-term care setting for seniors or individuals with disabilities who need help with daily activities — like bathing, dressing, and medication management — but not 24-hour skilled nursing. Offers housing, meals, and around-the-clock support while aiming to maximize resident independence.

MC

Memory Care Secured, specialized care for people living with Alzheimer's or dementia. Staff trained in cognitive impairment, with higher staff-to-resident ratios and an environment designed to reduce confusion and wandering risk.

- (St. Peters South)-No 33 ----

Guides for Better Senior Living

Care Cost Calculator: See Prices in Your Area

Nursing Home Data Explorer

Don’t Wait Too Long: 7 Red Flag Signs Your Parent Needs Assisted Living Now

The True Cost of Assisted Living in 2025 – And How Families Are Paying For It

Understanding Senior Living Costs: Pricing Models, Discounts & Financial Assistance

Frequently Asked Questions about Foxwood Springs Senior Living

What neighborhood is Foxwood Springs Senior Living in?

Foxwood Springs Senior Living is in the Raymore neighborhood of Raymore.

Who is the owner of Foxwood Springs Senior Living?

The legal owner and operator of Foxwood Springs Senior Living is Raymore Senior Care Llc.

Is Foxwood Springs Senior Living in a walkable area?

Foxwood Springs Senior Living has a walk score of 50. Moderately walkable. Some errands can be accomplished on foot, with a mix of nearby amenities.

Who is the administrator of Foxwood Springs Senior Living?

Derrick Minter is the administrator of Foxwood Springs Senior Living.

How many beds does Foxwood Springs Senior Living have?

Foxwood Springs Senior Living has 62 beds.

Are there photos of Foxwood Springs Senior Living?

Yes — there are 5 photos of Foxwood Springs Senior Living in the photo gallery on this page.

What is the phone number of Foxwood Springs Senior Living?

(816) 331-3111 will put you in contact with the team at Foxwood Springs Senior Living.

Explore Open Rooms
1 Contact details
2 What type of senior care service are you looking for?
3 What budget do you have in mind for senior care?
4 How soon do you need to find care?
5 Additional details

Thank you for your interest!

Our team will be in touch shortly to help with next steps.