


Total health inspections
4
Colorado average 4.8
Last Health inspection on May 2025
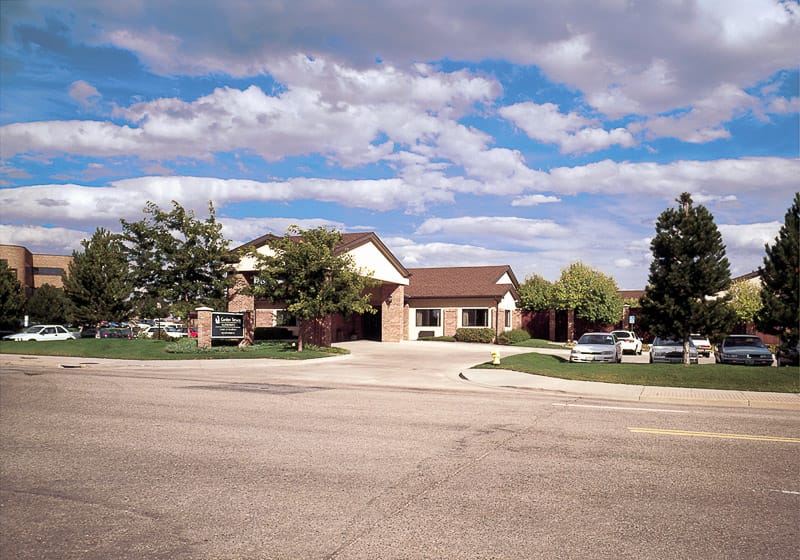
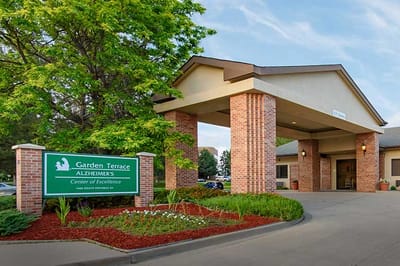
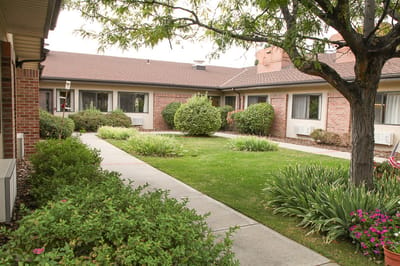

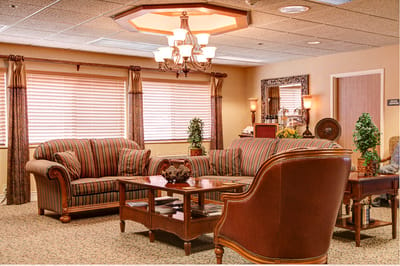
Experience the serene oasis of the Garden Terrace at Aurora, where compassion and expertise intersect to provide unparalleled skilled nursing and rehabilitation services. Ensconced in a welcoming suburban community, the facility offers a refreshing escape for memory care patients seeking top-notch care.
Whether one requires short-term rehabilitation or long-term care, their team of in-house therapists and nurses is dedicated to providing personalized care that helps residents flourish. Their homelike atmosphere creates a sense of comfort and ease, providing the perfect space for recovery, rest, and peace.
Staffing hours
![]() Daily nursing hours per resident by staff type, reported to CMS. Higher is generally better — compare this facility to state and national averages to see where staffing stands.
Daily nursing hours per resident by staff type, reported to CMS. Higher is generally better — compare this facility to state and national averages to see where staffing stands.
Hours per resident per day vs Colorado averages
Total nursing care
![]() This home is ranked 33rd out of 203 homes in Colorado for nurse hours. Total adjusted nursing hours per resident per day, combining RN, LPN, and aide time. CMS adjusts this for case-mix so facilities can be fairly compared.
This home is ranked 33rd out of 203 homes in Colorado for nurse hours. Total adjusted nursing hours per resident per day, combining RN, LPN, and aide time. CMS adjusts this for case-mix so facilities can be fairly compared.
4h 21m
13% above state avg3 of 6 metrics below state avg
In Colorado, the Department of Public Health and Environment, Health Facilities Division is the regulatory body that performs unannounced surveys and publishes facility inspection findings.
Deficiencies
| This Facility | CO Average | vs. CO Avg |
|---|---|---|---|
|
Total deficiencies
| 32 | 40 | This facility has 20% fewer total deficiencies than a typical Colorado nursing home (32 vs. CO avg 40).↓ 20% better |
|
Deficiencies per inspection
| 6.4 | 8 | This facility has 20% fewer deficiencies per inspection than a typical Colorado nursing home (6.4 vs. CO avg 8).↓ 20% better |
Inspections
| This Facility | CO Average | vs. CO Avg |
|---|---|---|---|
|
Total inspections
| 5 | 5 | This facility has total inspections in line with the Colorado average (5 vs. CO avg 5).— At avg |
Colorado average 4.8
Last Health inspection on May 2025
Colorado average 24.8
Colorado average 5.2
Health citations are formal notices following inspections when they fail to comply with safety and care standards.
9 of 11 citations resulted from standard inspections; 1 of 11 resulted from complaint investigations; and 1 of 11 came from combined inspections (standard and complaint).
Colorado average: 0.4
Colorado average: 2.1
Reporting period: October 1 – December 31, 2025 (Q4 2025). Source: CMS Payroll-Based Journal report.
Manages medical care and health needs.
Assists with medical care and medications.
Helps with daily care and mobility.
Total hours from contractors
78 contractor hours this quarter
| Certified Nursing Assistant | 58 | 0 | 58 | 19,007 | 92 | 100% | 7.8 |
| Licensed Practical Nurse | 22 | 0 | 22 | 8,557 | 92 | 100% | 8.7 |
| Registered Nurse | 16 | 0 | 16 | 4,261 | 92 | 100% | 9.3 |
| Other Dietary Services Staff | 8 | 0 | 8 | 3,265 | 92 | 100% | 7.5 |
| Clinical Nurse Specialist | 4 | 0 | 4 | 1,630 | 73 | 79% | 8.9 |
| Administrator | 1 | 0 | 1 | 528 | 66 | 72% | 8 |
| Nurse Practitioner | 1 | 0 | 1 | 508 | 64 | 70% | 7.9 |
| Dietitian | 1 | 0 | 1 | 473 | 65 | 71% | 7.3 |
| Occupational Therapy Aide | 1 | 0 | 1 | 463 | 62 | 67% | 7.5 |
| Mental Health Service Worker | 1 | 0 | 1 | 457 | 58 | 63% | 7.9 |
| Dental Services Staff | 1 | 0 | 1 | 453 | 56 | 61% | 8.1 |
| Qualified Social Worker | 1 | 0 | 1 | 375 | 62 | 67% | 6 |
| Speech Language Pathologist | 1 | 0 | 1 | 366 | 62 | 67% | 5.9 |
| Respiratory Therapy Technician | 2 | 0 | 2 | 353 | 58 | 63% | 5.9 |
| Physical Therapy Assistant | 1 | 0 | 1 | 275 | 54 | 59% | 5.1 |
| Nurse Aide in Training | 4 | 0 | 4 | 112 | 70 | 76% | 1.1 |
| Occupational Therapy Assistant | 0 | 3 | 3 | 44 | 6 | 7% | 7.3 |
| Medical Director | 0 | 1 | 1 | 35 | 3 | 3% | 11.5 |
Federal penalties imposed by CMS for regulatory violations, including civil money penalties (fines) and denials of payment for new Medicare/Medicaid admissions.
Source: CMS Penalties Database
No penalties in the past 3 years
No civil money penalties or payment denials were reported in the last 3 years.
These measures show how residents usually do over time at this home, based on health outcomes and preventive care.
Colorado average: 9.0
Colorado average: 18.8
Colorado average: 16.0%
Colorado average: 17.0%
Colorado average: 23.2%
Colorado average: 3.3%
Colorado average: 3.9%
Colorado average: 1.4%
Colorado average: 5.2%
Colorado average: 7.2%
Colorado average: 18.8%
Colorado average: 93.3%
Colorado average: 94.7%
Colorado average: 1.30
Colorado average: 1.67
Colorado average: 76.6%
Colorado average: 1.4%
Colorado average: 75.6%
Colorado average: 20.3%
Colorado average: 12.8%
Colorado average: 0.8%
Colorado average: 53.7%
Colorado average: 50.6%
Quality measures are calculated from Minimum Data Set (MDS) assessments. For most measures, lower percentages indicate better care quality.
17% of new residents, usually for short-term rehab.
42% of new residents, often for short stays.
40% of new residents, often for long-term daily care.
Source: CMS Long-Term Care Facility Characteristics (Data as of Jan 2026)
Residents meet regularly to discuss policies, care quality, and activities
Family members meet regularly to discuss policies, care quality, and activities
Organized group of family members that meets regularly to discuss facility policies, resident care, and activities.
Organized group of residents that meets regularly to discuss facility policies, quality of life, and activities.
Data sourced from CMS Long-Term Care Facility Characteristics quarterly report. Payer mix reflects the current resident census by primary payment source.
Historical financial and operational data for Garden Terrace at Aurora from 2012–2023, based on CMS SNF Cost Reports.
Key figures below are for fiscal year ending in 09/2023.
Based on CMS SNF Cost Report for fiscal year ending in 09/2023.
This home supports both short-term rehab and long-term care, with residents staying for a wide range of durations.
New residents most often arrive under private pay (42% of admissions), and a typical private pay stay runs around 2 - 3 months.
Coverage residents most often arrive under.
Coverage residents most often leave under.
![]() 3.4 miles from city center
3.4 miles from city center
![]() Estimated distance in miles from Aurora's city center to Garden Terrace at Aurora's address, calculated via Google Maps.
Estimated distance in miles from Aurora's city center to Garden Terrace at Aurora's address, calculated via Google Maps.
Add your location
Info below is compiled from CMS reports & the CO Dept. of Public Health & Environment (CDPHE), senior community websites & trusted data sources such as Walk Score & BBB.
Communities are listed from highest to lowest based on our ranking methodology.
| Garden Terrace at Aurora | NH MC SNF | Aurora (South Potomac Street) | 120
Facility
120
CO AVG
76
Rank
#77 / 526 |
79.6%
Facility
79.6%
CO AVG
70.5
Rank
#64 / 147 | +13% | 4.36
Facility
4.36
CO AVG
3.86
Rank
#33 / 203 | -10% | +13% | $0
Facility
$0
CO AVG
$39.2k
Rank
#1 / 209 | 11
Facility
11
CO AVG
24.8
Rank
#22 / 204 | 2.8
Facility
2.8
CO AVG
5.2
Rank
#29 / 204 | - | 96 | - |
46
Facility
46
CO AVG
51
Rank
#524 / 869 | Jerry Weeter | $10.7MFiscal year ending 09/2023
Facility
$10.7MFiscal year ending 09/2023
CO AVG
$11.2M
Rank
#85 / 207 | $7.9MFiscal year ending 09/2023
Facility
$7.9MFiscal year ending 09/2023
CO AVG
$4.9M
Rank
#53 / 207 | 73.3%Fiscal year ending 09/2023
Facility
73.3%Fiscal year ending 09/2023
CO AVG
46.6%
Rank
#28 / 207 | 65266 | ||||
| Cadence Aurora | NH SNF | Aurora (Utah Park) | 54
Facility
54
CO AVG
76
Rank
#338 / 526 |
93.1%
Facility
93.1%
CO AVG
70.5
Rank
#24 / 147 | +32% | 4.11
Facility
4.11
CO AVG
3.86
Rank
#55 / 203 | +84% | +6% | $0
Facility
$0
CO AVG
$39.2k
Rank
#1 / 209 | 6
Facility
6
CO AVG
24.8
Rank
#7 / 204 | 2.0
Facility
2.0
CO AVG
5.2
Rank
#6 / 204 | 1 | 50 | - |
44
Facility
44
CO AVG
51
Rank
#547 / 869 | Daniel Cortez | $10.8MFiscal year ending 12/2023
Facility
$10.8MFiscal year ending 12/2023
CO AVG
$11.2M
Rank
#54 / 207 | $6.1MFiscal year ending 12/2023
Facility
$6.1MFiscal year ending 12/2023
CO AVG
$4.9M
Rank
#103 / 207 | 56%Fiscal year ending 12/2023
Facility
56%Fiscal year ending 12/2023
CO AVG
46.6%
Rank
#180 / 207 | 65393 | ||||
| Life Care Center of Aurora | NH SNF | Aurora (Southeast Crossing) | 166
Facility
166
CO AVG
76
Rank
#27 / 526 |
31.9%
Facility
31.9%
CO AVG
70.5
Rank
#135 / 147 | -55% | 3.95
Facility
3.95
CO AVG
3.86
Rank
#63 / 203 | +17% | +2% | $33.2k
Facility
$33.2k
CO AVG
$39.2k
Rank
#152 / 209 | 28
Facility
28
CO AVG
24.8
Rank
#131 / 204 | 5.6
Facility
5.6
CO AVG
5.2
Rank
#126 / 204 | 2 | 53 | A+ |
41
Facility
41
CO AVG
51
Rank
#568 / 869 | David Strain | $14.6MFiscal year ending 08/2024
Facility
$14.6MFiscal year ending 08/2024
CO AVG
$11.2M
Rank
#38 / 207 | $10.6MFiscal year ending 08/2024
Facility
$10.6MFiscal year ending 08/2024
CO AVG
$4.9M
Rank
#17 / 207 | 72.4%Fiscal year ending 08/2024
Facility
72.4%Fiscal year ending 08/2024
CO AVG
46.6%
Rank
#57 / 207 | 65332 | ||||
| Summit Rehabilitation and Care Community | NH MC SNF | Aurora (Sunny Vale) | 110
Facility
110
CO AVG
76
Rank
#106 / 526 |
96.3%
Facility
96.3%
CO AVG
70.5
Rank
#7 / 147 | +37% | 2.98
Facility
2.98
CO AVG
3.86
Rank
#168 / 203 | +4% | -23% | $0
Facility
$0
CO AVG
$39.2k
Rank
#1 / 209 | 23
Facility
23
CO AVG
24.8
Rank
#107 / 204 | 3.3
Facility
3.3
CO AVG
5.2
Rank
#42 / 204 | 1 | 106 | - |
70
Facility
70
CO AVG
51
Rank
#226 / 869 | - | $12.3MFiscal year ending 12/2023
Facility
$12.3MFiscal year ending 12/2023
CO AVG
$11.2M
Rank
#40 / 207 | $6.8MFiscal year ending 12/2023
Facility
$6.8MFiscal year ending 12/2023
CO AVG
$4.9M
Rank
#73 / 207 | 55.4%Fiscal year ending 12/2023
Facility
55.4%Fiscal year ending 12/2023
CO AVG
46.6%
Rank
#161 / 207 | 65176 | ||||
| The Springs at St Andrew‘s Village | NH SNF | Aurora (Heather Gardens) | 58
Facility
58
CO AVG
76
Rank
#320 / 526 |
60.3%
Facility
60.3%
CO AVG
70.5
Rank
#106 / 147 | -14% | 3.50
Facility
3.50
CO AVG
3.86
Rank
#109 / 203 | +39% | -9% | $0
Facility
$0
CO AVG
$39.2k
Rank
#1 / 209 | 16
Facility
16
CO AVG
24.8
Rank
#45 / 204 | 5.3
Facility
5.3
CO AVG
5.2
Rank
#108 / 204 | 1 | 35 | - |
38
Facility
38
CO AVG
51
Rank
#596 / 869 | David Dunyon | $6.5MFiscal year ending 12/2023
Facility
$6.5MFiscal year ending 12/2023
CO AVG
$11.2M
Rank
#157 / 207 | $4.4MFiscal year ending 12/2023
Facility
$4.4MFiscal year ending 12/2023
CO AVG
$4.9M
Rank
#161 / 207 | 67.7%Fiscal year ending 12/2023
Facility
67.7%Fiscal year ending 12/2023
CO AVG
46.6%
Rank
#115 / 207 | 65388 |
Garden Terrace at Aurora is located in Aurora, Colorado.
Here are the financial assistance programs available to residents in Colorado.
Garden Terrace at Aurora is in the South Potomac Street neighborhood of Aurora.
Garden Terrace at Aurora has a walk score of 46. Somewhat walkable. A few nearby services may be reachable on foot, but most trips require transportation.
Garden Terrace at Aurora's occupancy is 77.5%.
Garden Terrace at Aurora has been operating for approximately 18 years, based on available licensing and registration records.
No, Garden Terrace at Aurora has a no-pet policy.
Garden Terrace at Aurora is registered as a for-profit in CO.
Garden Terrace at Aurora has had 32 reported deficiencies since 2022 according to records from Colorado Dept. of Public Health and Environment (CDPHE).
Care Cost Calculator: See Prices in Your Area
Nursing Home Data Explorer
Don’t Wait Too Long: 7 Red Flag Signs Your Parent Needs Assisted Living Now
The True Cost of Assisted Living in 2025 – And How Families Are Paying For It
Understanding Senior Living Costs: Pricing Models, Discounts & Financial Assistance


