
Glen Arden Inc
Nursing Home, Independent Living & Skilled Nursing · Goshen, NY
CMS overall rating Info CMS (the Centers for Medicare & Medicaid Services) is the federal agency that rates nursing home quality. Its Overall Rating runs from 1 to 5 stars, combining health inspections, staffing, and quality measures, with inspections weighted most heavily.

Glen Arden Inc

Nursing Home, Independent Living & Skilled Nursing · Goshen, NY
CMS overall rating Info CMS (the Centers for Medicare & Medicaid Services) is the federal agency that rates nursing home quality. Its Overall Rating runs from 1 to 5 stars, combining health inspections, staffing, and quality measures, with inspections weighted most heavily.
Calculator: See prices in your area
Glen Arden Inc accepts Medicare, Medicaid, and private pay.

Overview of Glen Arden

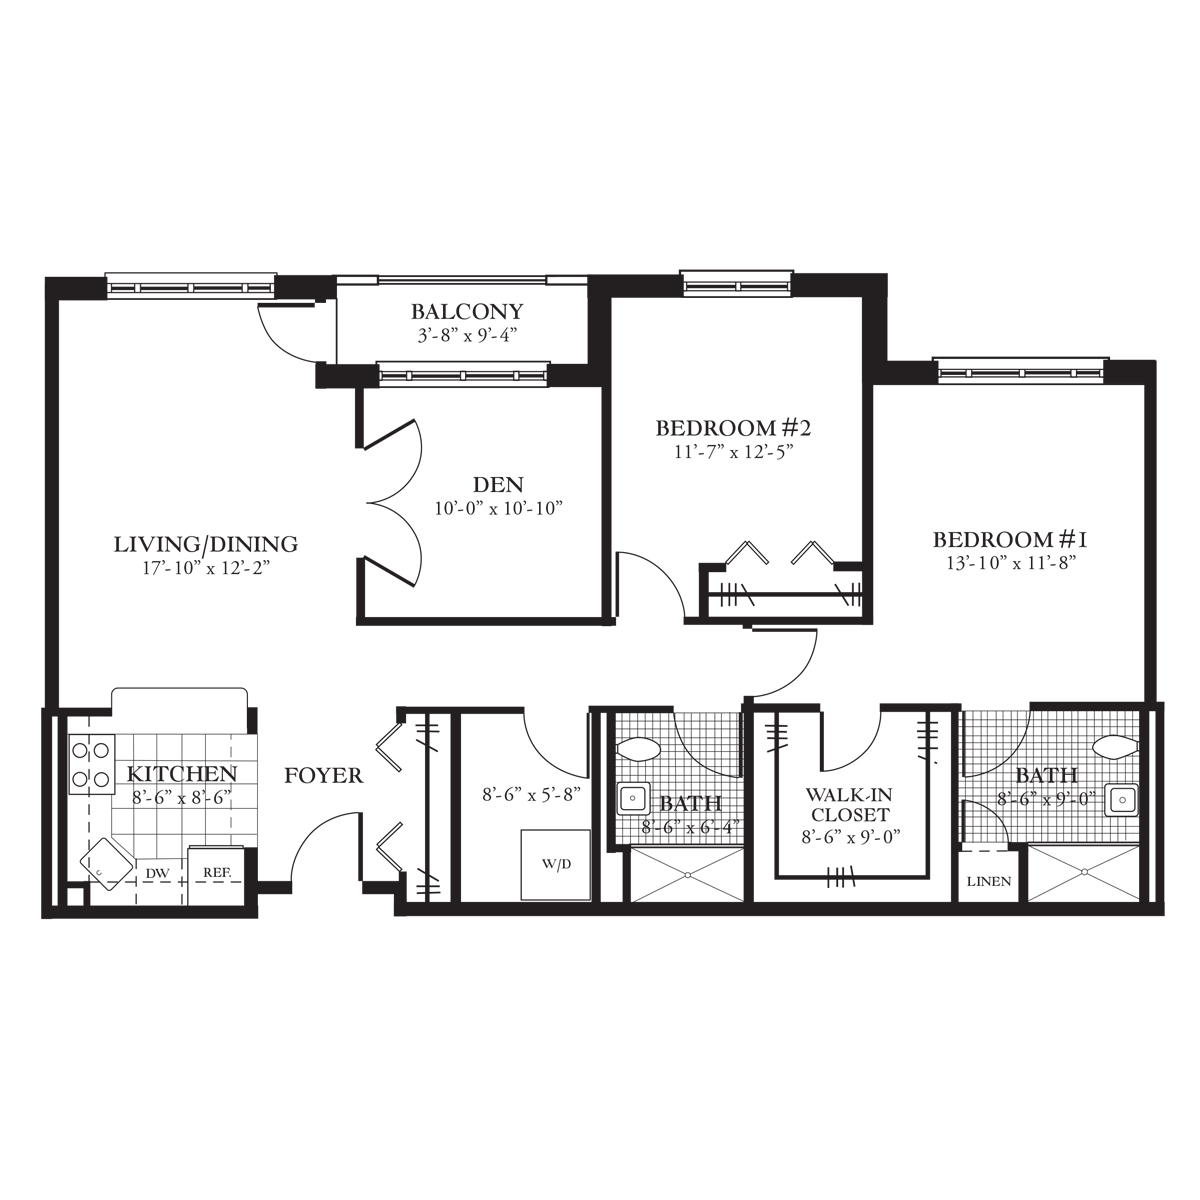
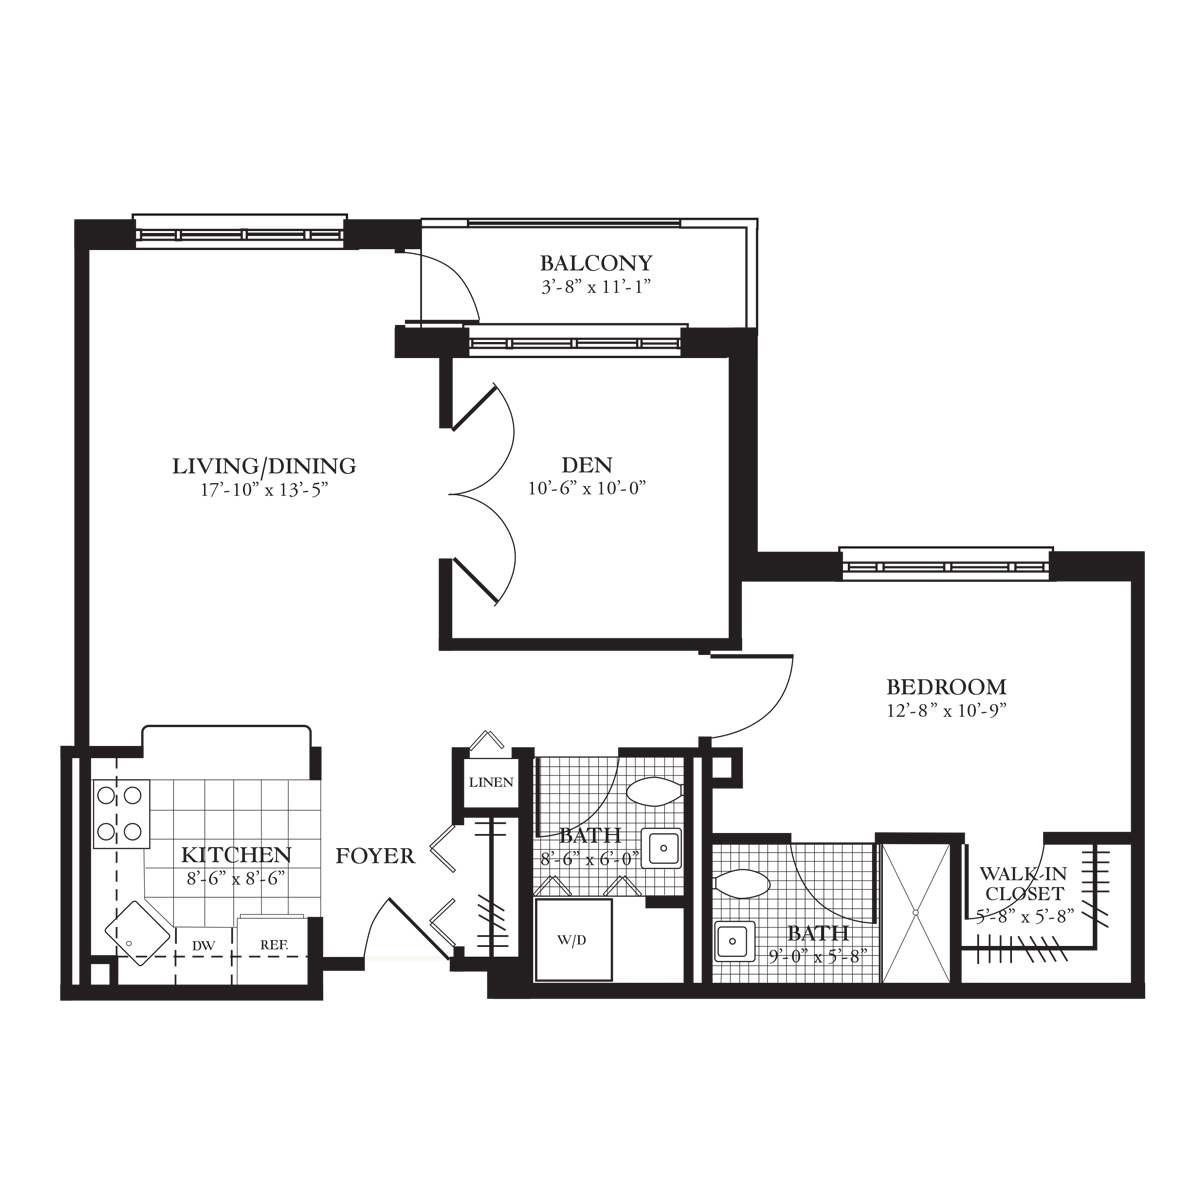
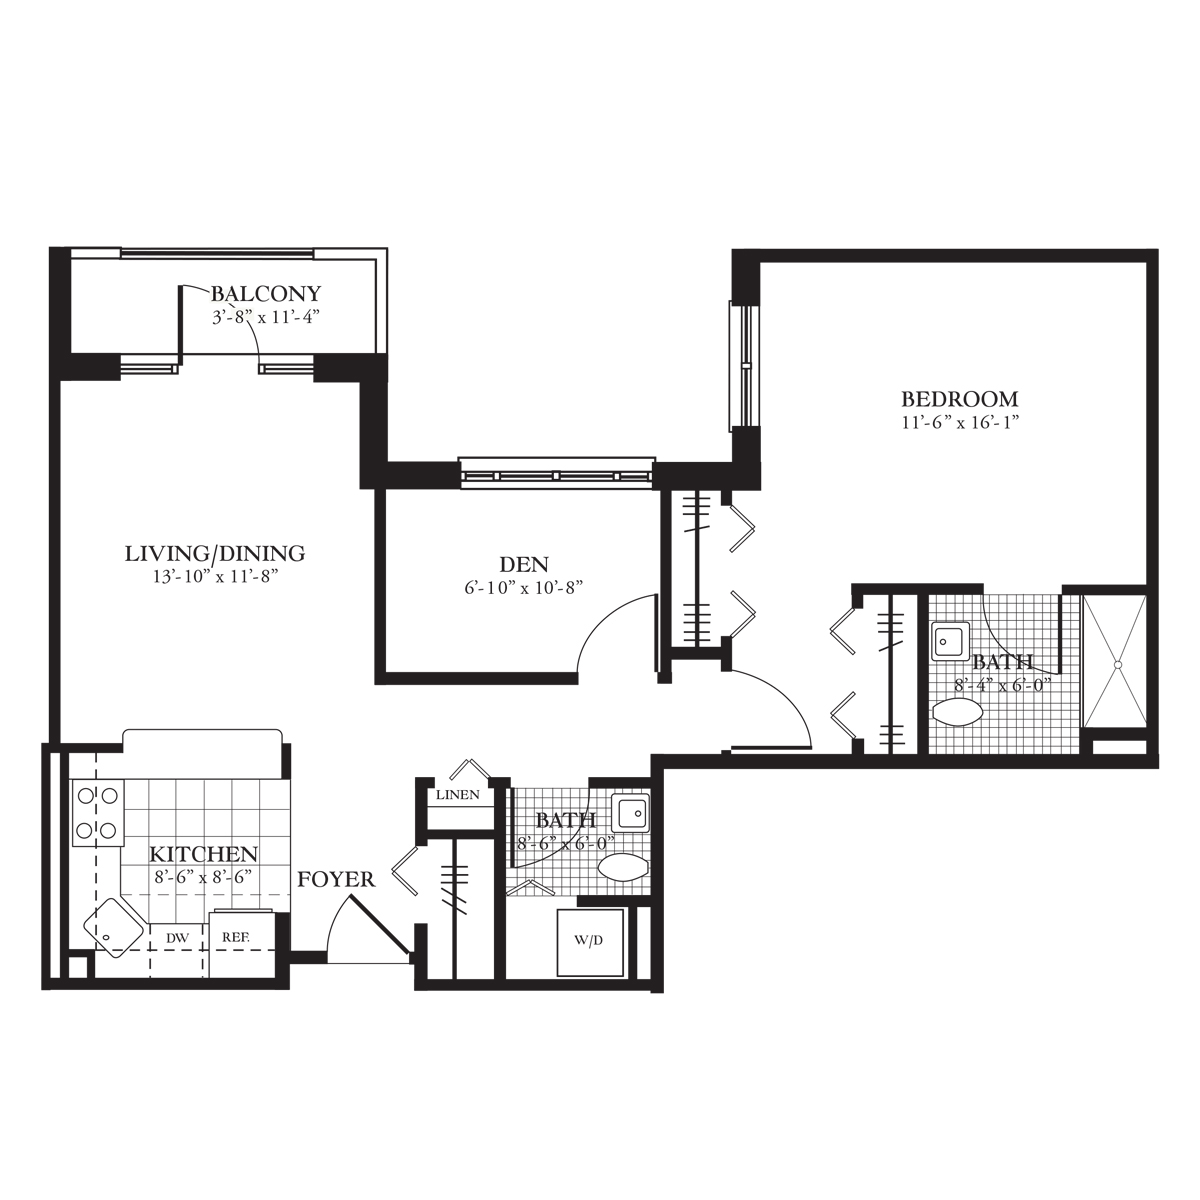
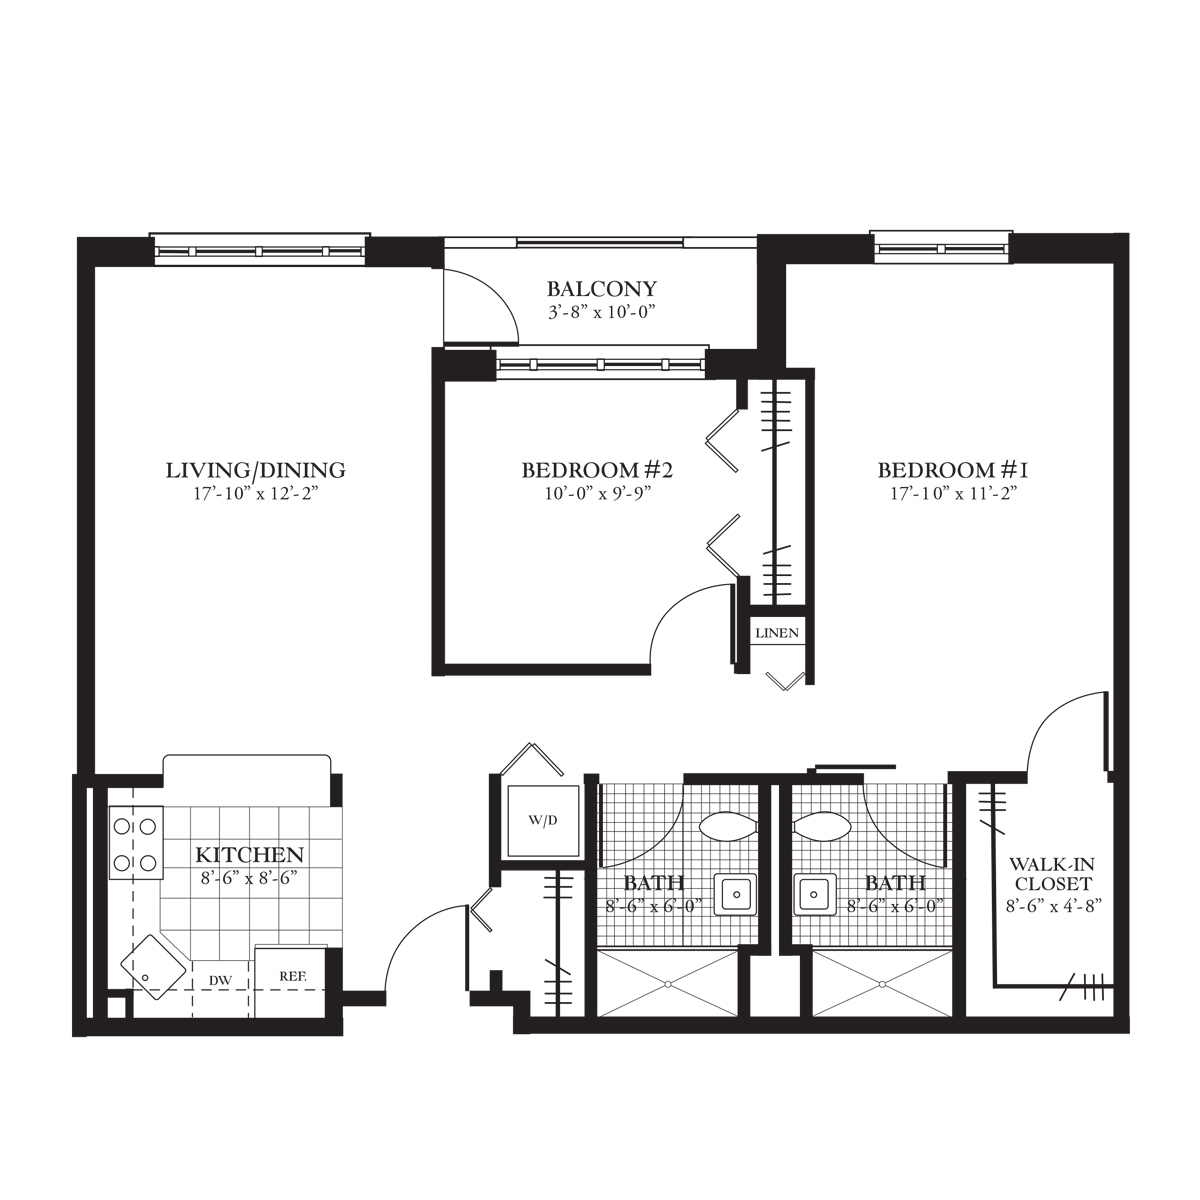
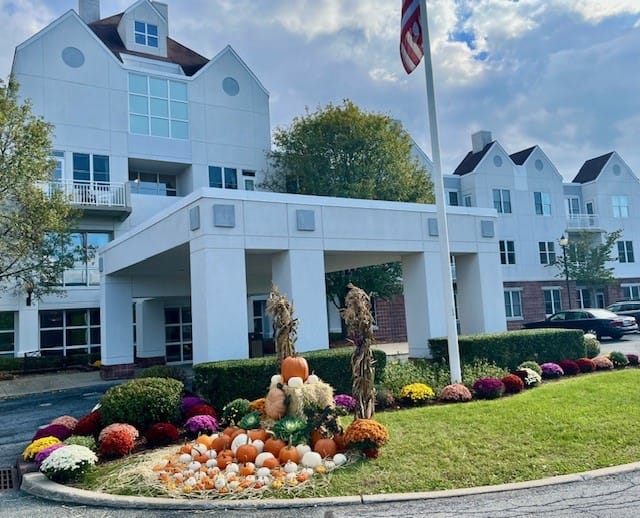
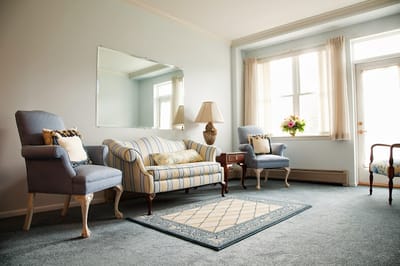
Glen Arden sits in Goshen and offers three types of care in one place: independent living, enriched housing, and skilled nursing. The building has three floors and 40 beds. Residents pick from a studio, a one-bedroom, or a two-bedroom home. This part of Goshen isn’t easy to walk around, so most people here get where they need to go by car.

31 of the 40 beds are full. That works out to 78% occupancy. Nursing staff spend about five hours and twenty-two minutes with each resident every day. Registered nurses handle a little over an hour of that time, nurse aides handle almost three hours, and LPNs cover the rest. Residents can also get rehab services without leaving the building.

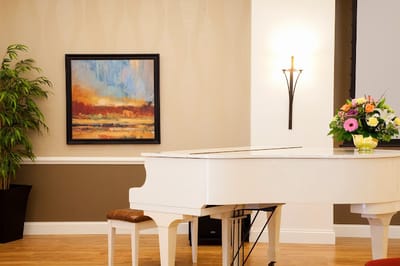
Daily comfort comes first here. Meals are served restaurant-style, linens get changed weekly, and housekeeping comes twice a month. There’s plenty to do, too. Residents who want to stay active can swim in the indoor heated pool, play tennis, or try bocce and shuffleboard. For quieter days, there’s a library, a billiards room, and an arts and crafts studio. A gift shop and a beauty and barber shop are on-site as well, and scheduled transportation means residents can still get out and about. Pets are allowed.

Glen Arden accepts Medicare, Medicaid, and private pay, so families have a few ways to cover costs. State inspectors usually focus on things like medication management, paperwork and care plans, and food service when they visit. That’s normal for nursing homes and doesn’t point to any problem unique to this facility. Glen Arden works well for residents who may need more support down the road, since the staff and services here are built to grow with them.

Quality ratings

Measured by Centers for Medicare & Medicaid Services (CMS)

Overall rating Info The Overall CMS Rating combines results from health inspections, staffing levels and quality measures. Health inspections carry the most weight. Staffing and quality scores can increase or decrease the final rating based on performance compared to state and national standards.
▼ 2.4% Below NY avg. ▼ 2.4% Below NY avg.NY average: 3.1Click the badge to see the full State ranking.Click here to see the full State ranking.
Health Inspection Info Based on the results of the facility's three most recent standard inspections and any complaint investigations. CMS reviews the number, scope, and severity of deficiencies, with more recent findings weighted more heavily.
▼ 29.3% Below NY avg. ▼ 29.3% Below NY avg.NY average: 2.8Click the badge to see the full State ranking.Click here to see the full State ranking.
Staffing Info Measures average nursing staff hours per resident per day, including Registered Nurses (RNs) and total nursing staff. Ratings are adjusted based on the level of care residents require and are compared to state and national benchmarks.
▲ 84.0% Above NY avg. ▲ 84.0% Above NY avg.NY average: 2.7Click the badge to see the full State ranking.Click here to see the full State ranking.
Quality Measures Info Based on clinical and physical health indicators reported to CMS, such as hospital readmissions, falls, pressure ulcers, and improvements in mobility. These measures reflect how well residents' health needs are being managed.
▼ 47.6% Below NY avg. ▼ 47.6% Below NY avg.NY average: 3.8Click the badge to see the full State ranking.Click here to see the full State ranking.

Staffing hours breakdown

Info Daily nursing hours per resident by staff type, reported to CMS. Higher is generally better — compare this facility to state and national averages to see where staffing stands.

Hours per resident per day — compared to New York state averages

Total nursing care / resident Info This home is ranked 10th out of 401 homes in New York for nurse hours. Total adjusted nursing hours per resident per day, combining RN, LPN, and aide time. CMS adjusts this for case-mix so facilities can be fairly compared.
5h 22m per day
Rank #10 / 401Nurse hours — State benchmarkedThis home is ranked 10th out of 401 homes in New York for Nurse Hours. Shows adjusted nurse hours per resident per day benchmarked to the New York average, with a ranking across 401 New York facilities. More hours mean more direct care. The national average is about 3.5 hrs; below 3.0 is a red flag.Facilities with the same value for a metric share the same rank. Rankings are based only on facilities in New York that report data for that category. Facilities without available data are excluded from the ranking.Click the rank badge to see the full State ranking.Click here to see the full State ranking.
This facility New York avg (3h 35m per day)
vs New York avg
+50%

1 of 6 metrics below state avg

Standout metric Physical Therapist is +127% above state avg
Staff typeHours / Day / Residentvs state avg
Registered Nurse (RN) Info RNs hold the highest nursing license and can assess residents, interpret test results, and direct care plans. More RN hours per day often signals stronger clinical oversight and faster response to health changes. 1h 14m per day ▲ 77% State avg: 42m per day · National avg: 41m per day
LPN / LVN Info Licensed Practical Nurses (LPNs) or Licensed Vocational Nurses (LVNs) deliver routine hands-on care — medication administration, wound dressing, and monitoring vital signs. They work under RN supervision and make up a large share of daily bedside care. 39m per day ▼ 14% State avg: 46m per day · National avg: 52m per day
Nurse Aide Info Certified Nurse Aides (CNAs) provide the most direct day-to-day assistance: bathing, dressing, feeding, and mobility. Nurse aide hours are typically the largest staffing category and directly affect residents' quality of life. 2h 55m per day ▲ 33% State avg: 2h 11m per day · National avg: 2h 20m per day
Weekend Total Nursing Info Combined nursing hours (RN + LPN + Nurse Aide) per resident per day on weekends. Staffing often drops on weekends — this figure reveals whether the facility maintains adequate coverage outside of weekday hours. 4h 19m per day ▲ 36% State avg: 3h 10m per day · National avg: 3h 26m per day
Physical Therapist Info Hours per resident per day provided by licensed Physical Therapists (PTs) or PT Assistants. PT services help residents recover mobility after injury or illness and are especially important for post-acute (short-stay) rehabilitation. 16m per day ▲ 127% State avg: 7m per day · National avg: 4m per day
Weekend RN Info Registered nurse hours specifically on weekends. Facilities sometimes reduce RN presence on Saturdays and Sundays — a low weekend RN figure compared to weekday hours can indicate reduced clinical oversight when most administrative staff are absent. 1h 1m per day ▲ 119% State avg: 28m per day · National avg: 28m per day

Capacity and availability

Avg. Length of Stay Info Average number of days residents stay at this facility, based on CMS cost report data. Shorter stays often reflect post-acute or rehab care; longer stays reflect long-term care.
111 days
Bed community size
40-bed community Rank #698 / 742Bed count — State benchmarkedThis home is ranked 698th out of 742 homes in New York for Bed Count. Shows this facility's certified or reported bed count compared to other New York facilities. Larger communities may offer more amenities, programs, and on-site services for residents and families.Facilities with the same value for a metric share the same rank. Rankings are based only on facilities in New York that report data for that category. Facilities without available data are excluded from the ranking.Click the rank badge to see the full State ranking.Click here to see the full State ranking.
A moderately sized community that may balance personal attention with shared amenities and social activities.
Walk Score
Walk Score: 2 / 100 Rank #1140 / 1169Walk Score — State benchmarkedThis home is ranked 1140th out of 1169 homes in New York for Walk Score. Shows how walkable this facility's neighborhood is compared to the average Walk Score across New York facilities. Higher scores benefit residents, families, and staff.Facilities with the same value for a metric share the same rank. Rankings are based only on facilities in New York that report data for that category. Facilities without available data are excluded from the ranking.Click the rank badge to see the full State ranking.Click here to see the full State ranking.
Car-dependent. Most errands require a car, with limited nearby walkable options.

About this community

Occupancy

Occupancy rate
78%
Rank #365 / 413Occupancy rate — State benchmarkedThis home is ranked 365th out of 413 homes in New York for Occupancy. Shows this facility's occupancy rate versus the New York average, with its Statewide rank out of 413. Higher occupancy signals strong local demand and financial stability.Facilities with the same value for a metric share the same rank. Rankings are based only on facilities in New York that report data for that category. Facilities without available data are excluded from the ranking.Click the rank badge to see the full State ranking.Click here to see the full State ranking.
Lower than the New York average: 88.3%
Occupied beds
31 / 40
Average occupied beds in New York homes 166 beds

License Details

Facility TypeEnriched Housing Program
CountyOrange
CMS Certification Number335802

Ownership & Operating Entity

Glen Arden Inc is legally operated by Glen Arden, Inc.

Therapy & Rehabilitation

1 service
Rehabilitation Services

Additional Services

1 service
Enriched Housing

Additional Policies & Features

Minimum Age62
HousekeepingYes
Linen ServiceYes

Amenities & Lifestyle

Biweekly Housekeeping
Weekly Linen Service
On-Site Beauty/Barber Service
Restaurant-Style Dining
Scheduled Transportation
Gift Shop
Salon/Barber Shop
Well-Stocked Libraries
Business Center
On-Site Bank
Billiards Room
Arts And Crafts Studio
Tennis
Bocce Ball
Shuffleboard
On-Site Curves® Fitness Center
Indoor Heated Pool
Scenic Walking Path
Pet Friendly

Contact Glen Arden Inc

Inspection History

In New York, the Department of Health, Office of Aging and Long Term Care performs unannounced onsite inspections to monitor compliance with state and federal healthcare regulations.

Since 2023 · 3 years of data 2 enforcement actions 14 violations 7 inspections
Inspection Score Info A composite 0–100 score combining this facility's inspections, violations, complaints, and enforcement actions relative to the New York state average. The score below shows how many points this facility sits above or below the typical New York assisted living residence score (the benchmark); higher is better.This is a proprietary Assisted Living Magazine score.

8 points below the New York average for assisted living residences (83/100)

Rank #435 / 591 in New York Inspection Score — State benchmarked This home is ranked 435th out of 591 homes in New York for Inspection Score. Shows this facility's inspection score compared to the New York average among 591 comparable communities in the ranking pool. Facilities with the same value for a metric share the same rank. Rankings are based only on facilities in New York that report data for that category. Facilities without available data are excluded from the ranking. This is a proprietary Assisted Living Magazine score. Inspection score: 75 out of 100. Letter grade C. 8 points below the New York average for assisted living residences (83/100)

Enforcement Actions Info Enforcement actions are formal penalties or interventions imposed by New York regulators when an assisted living residence fails to meet state care, safety, or regulatory standards. They may include stipulations and orders, civil monetary penalties, operational restrictions, or appointment of temporary management.

Since 2023
2 enforcement actions

This facility has 2 enforcement actions. 77% of New York assisted living residences have zero, and the statewide average is 0.6.

  • February 9, 2023 #ACF-23-006
  • February 9, 2023 #ACF-23-007

Inspection Scorecard Info This scorecard compares key inspection, violation, and complaint metrics at this facility against the New York state average. Metrics rated ≥15% worse than average are highlighted in red; those ≥15% better are highlighted in green.

Since 2024 vs. New York state average
Overall vs. NY average 3 Worse Metrics worse than New York average:
• Violations per inspection (25% above)
• Inspections with violations (25% above)
• Inspection violation rate (61% above)
3 Better Metrics better than New York average:
• Total violations (3% below)
• Violations per year (4% below)
• Complaint visits (67% below)

Inspections Info State inspections evaluate whether the facility meets health and safety standards.

This FacilityNY Averagevs. NY Avg
Total inspections Info Combined count of all routine and focused inspections. Excludes complaint investigations. 79 This facility has had 22% fewer total inspections than the New York average (7 vs. NY avg 9). More inspections can mean more regulatory scrutiny rather than worse care.↓ 22% fewer
Inspections with violations Info Inspections that uncovered at least one regulatory violation. 54 This facility has 25% more inspections with violations than a typical New York assisted living residence (5 vs. NY avg 4).↑ 25% worse
Inspection violation rate Info Percentage of inspections that resulted in at least one violation. 71%44% This facility has 27 percentage points higher inspection violation rate than a typical New York assisted living residence (71% vs. NY avg 44%).↑ 27% worse Rank #255 / 321 Inspection violation rate — State benchmarked This home is ranked 255th out of 321 homes in New York for % of Inspections With Violations. Shows this facility's % of inspections with violations compared to the New York average among 321 comparable communities in the ranking pool. Facilities with the same value for a metric share the same rank. Rankings are based only on facilities in New York that report data for that category. Facilities without available data are excluded from the ranking.
Complaint visits Info On-site visits triggered by formal complaints filed by residents, families, or staff. 26 This facility has 67% fewer complaint visits than a typical New York assisted living residence (2 vs. NY avg 6).↓ 67% better Rank #98 / 321 Complaint visits — State benchmarked This home is ranked 98th out of 321 homes in New York for Complaint-related visits. Shows this facility's complaint-related visits compared to the New York average among 321 comparable communities in the ranking pool. Facilities with the same value for a metric share the same rank. Rankings are based only on facilities in New York that report data for that category. Facilities without available data are excluded from the ranking.

Violations Info Violations are formal regulatory issues recorded during state inspections.

This FacilityNY Averagevs. NY Avg
Total violations Info Formal regulatory issues recorded by inspectors across all inspection types. 1414.5 This facility has 3% fewer total violations than a typical New York assisted living residence (14 vs. NY avg 14.5).↓ 3% better Rank #257 / 321 Total violations — State benchmarked This home is ranked 257th out of 321 homes in New York for Violations. Shows this facility's violations compared to the New York average among 321 comparable communities in the ranking pool. Facilities with the same value for a metric share the same rank. Rankings are based only on facilities in New York that report data for that category. Facilities without available data are excluded from the ranking.
Violations per year Info Average violations per year since 2024. 77.3 This facility has 4% fewer violations per year than a typical New York assisted living residence (7 vs. NY avg 7.3).↓ 4% better
Violations per inspection Info Average violations per inspection. 21.6 This facility has 25% more violations per inspection than a typical New York assisted living residence (2 vs. NY avg 1.6).↑ 25% worse Rank #270 / 321 Violations per inspection — State benchmarked This home is ranked 270th out of 321 homes in New York for Violations per inspection. Shows this facility's violations per inspection compared to the New York average among 321 comparable communities in the ranking pool. Facilities with the same value for a metric share the same rank. Rankings are based only on facilities in New York that report data for that category. Facilities without available data are excluded from the ranking.

Inspection Reports Summary Info An editor-reviewed summary of the themes and findings across this facility's recent inspection reports.

  • April 3, 2024 inspection found 12 deficiencies, all related to records, resident services, environmental standards, and food service, with plans of correction approved for all.
  • Two inspections had no violations, but most deficiencies involved incomplete or missing documentation and program reporting errors.
  • Deficiencies consistently involved failure to maintain required contracts, medication records, dietary consultant services, emergency procedures, and building code compliance across multiple inspections.

Lawsuit overview for Glen Arden Inc

Summary of court-record activity tied to this facility, compiled from publicly available case dockets.

Source: State court e-filing records

Total Cases Info Every lawsuit on record involving this facility since the earliest filing. Long-term volume signals overall legal exposure. 26
Active Cases Info Lawsuits still moving through the courts. Active claims can affect day-to-day operations, settlement risk, and insurance posture. 0
Closed Info Cases that have been disposed of — dismissed, settled, or decided. Shows how the facility has historically resolved disputes. 26
Since Info Year of the earliest case on record. A long history with steady filings suggests persistent issues; a recent first filing means newer exposure. 1997
Most Recent Info Most recent filing on record. Recent activity means legal disputes are still being raised against this facility. 2024

Penalties and fines

Federal penalties imposed by CMS for regulatory violations, including civil money penalties (fines) and denials of payment for new Medicare/Medicaid admissions.

Source: CMS Penalties Database

No penalties in the past 3 years

No civil money penalties or payment denials were reported in the last 3 years.

Quality of care over time

These measures show how residents usually do over time at this home, based on health outcomes and preventive care.

Long-stay resident measures
Significantly below average New York avg: 4.0 Info CMS star rating based on long-stay quality measure performance. 5 stars = significantly above average, 1 star = significantly below average.
Hospitalizations per 1,000 days Info Number of hospitalizations per 1,000 long-stay resident days. 3.03
77% worse than New York average

New York average: 1.71

ED visits per 1,000 days Info Number of outpatient emergency department visits per 1,000 long-stay resident days. 1.48
10% worse than New York average

New York average: 1.35

Short-stay resident measures
Above average New York avg: 3.5 Info CMS star rating based on short-stay quality measure performance. 5 stars = much above average, 1 star = much below average.
Re-hospitalized after SNF stay Info Percentage of short-stay residents who were re-hospitalized after their nursing home admission. 16.3%
21% better than New York average

New York average: 20.6%

Emergency department visits Info Percentage of short-stay residents who had an outpatient emergency department visit. 8.5%
12% better than New York average

New York average: 9.7%

Falls with major injury Info Percentage of SNF residents who experience falls with major injury during their stay. 0.0%
100% better than New York average

New York average: 0.8%

Ability to care for self at discharge Info Percentage of residents at or above expected ability to care for themselves at discharge. 48.1%
10% worse than New York average

New York average: 53.7%

Successful return to home or community Info Rate of successful return to home or community from a skilled nursing facility. 48.5%
In line with New York average

New York average: 50.6%

Breakdown by payment type

Medicare

53% of new residents, usually for short-term rehab.

Typical stay 1 - 2 months

Private pay

20% of new residents, often for short stays.

Typical stay 10 - 11 months

Medicaid

27% of new residents, often for long-term daily care.

Typical stay 1 - 2 months

Finances and operations

Based on CMS SNF Cost Report for fiscal year ending in 12/2023.

Nonprofit
Nonprofit Corporation
Net patient revenue Info Net patient revenue — what the home actually collects for resident care, after contractual allowances, bad debt and discounts are subtracted from its gross charges (CMS cost report, Worksheet G-3). It covers resident care only; money the home earns from other sources is shown separately as "Other income."
$7.1M
Net patient income Info Net patient income: net patient revenue minus the home's total operating expenses. A positive figure means it earns more from resident care than it spends to deliver it; a negative figure means the opposite. It excludes non-operating "other income."
-$5.2M
Nonprofit Nonprofit Corporation
Net patient revenue Info Net patient revenue — what the home actually collects for resident care, after contractual allowances, bad debt and discounts are subtracted from its gross charges (CMS cost report, Worksheet G-3). It covers resident care only; money the home earns from other sources is shown separately as "Other income."
$7.1M Rank #364 / 396Revenue — State benchmarkedThis home is ranked 364th out of 396 homes in New York for Revenue. Shows this facility's annual revenue compared to the New York average. Higher revenue generally means more resources for staffing and capital — read alongside Payroll %.Facilities with the same value for a metric share the same rank. Rankings are based only on facilities in New York that report data for that category. Facilities without available data are excluded from the ranking.Click the rank badge to see the full State ranking.Click here to see the full State ranking.
Net patient income Info Net patient income: net patient revenue minus the home's total operating expenses. A positive figure means it earns more from resident care than it spends to deliver it; a negative figure means the opposite. It excludes non-operating "other income."
-$5.2M
Other income Info Money the home earns outside of resident care — such as investments, grants, rentals and other non-operating sources (CMS cost report, Worksheet G-3). It is tracked separately from net patient revenue: it is not part of that figure, and it is not included in net patient income.
$3.1M
Payroll costs Info Staff salaries plus wage-related costs — benefits such as payroll taxes, health insurance and retirement — from the home's own accounting records (CMS cost report, Worksheet A). Contract or agency labor is counted separately, under other operating costs. Rank #388 / 396Payroll — State benchmarkedThis home is ranked 388th out of 396 homes in New York for Payroll. Shows total annual staff payroll benchmarked to the New York average. Higher payroll investment relative to peers often signals better staffing and less reliance on cheaper contract labor.Facilities with the same value for a metric share the same rank. Rankings are based only on facilities in New York that report data for that category. Facilities without available data are excluded from the ranking.Click the rank badge to see the full State ranking.Click here to see the full State ranking.
$4.0M 55.3% of net patient revenue Info Payroll as a share of revenue: staff salaries and wage-related benefits divided by net patient revenue. A higher figure means more of each revenue dollar goes to staff pay. Rank #380 / 396Payroll % — State benchmarkedThis home is ranked 380th out of 396 homes in New York for Payroll %. Shows payroll as a percentage of revenue versus the New York average. Well-run New York facilities typically land around 53–65% — the top third Statewide. Below 25% may signal understaffing or heavy agency use — read with Staffing ratings.Facilities with the same value for a metric share the same rank. Rankings are based only on facilities in New York that report data for that category. Facilities without available data are excluded from the ranking.Click the rank badge to see the full State ranking.Click here to see the full State ranking.
Other operating costs Info Everything it costs to run the home apart from payroll — food, utilities, supplies, maintenance, contract labor and administration. Calculated as total operating expense minus payroll (staff salaries and wage-related benefits).
$8.4M
Total costs Info The home's total operating expense for the year — all the costs of running it, salaries included (CMS cost report, Worksheet G-3).
$12.3M

What does this home offer?

Pets allowed icon
Pets allowed icon

Pets Allowed

Room sizes icon
Room sizes icon

Room Sizes: 500 / 700 / 860 / 1000 / 1240 sq. ft

Housing options icon

Housing Options: Studio / 1 Bed / 2 Bed

Building type icon
Building type icon

Building Type: 3-story

Transportation services icon

Transportation Services

Fitness and recreation icon

Fitness and Recreation

Who this home usually serves

TYPE OF STAY

Mostly short-term rehab stays

Most residents typically stay for a few weeks or months before returning home or moving on.

Most new residents arrive under Medicare (53% of admissions), and a typical Medicare stay runs around 1 - 2 months.

Admissions
102 total

Coverage residents most often arrive under.

Medicare 53%
Private pay 20%
Medicaid 27%
Discharges
94 total

Coverage residents most often leave under.

Medicare 60%
Private pay 19%
Medicaid 21%

Living Spaces & Floor Plans for Glen Arden Inc

Places of interest near Glen Arden Inc

Address 1.7 miles from city center Info Estimated distance in miles from Goshen's city center to Glen Arden Inc's address, calculated via Google Maps.

Calculate Travel Distance to Glen Arden Inc

Add your location

Address

Compare Nursing Homes around Orange County

The information below is reported by the New York State Department of Health.

CMS & NY Dept. of Health data

Sapphire Nursing and Rehab at Goshen
NH
ADC
Goshen
120
Facility 120
NY AVG 160
Rank #409 / 742
91.7%
Facility 91.7%
NY AVG 87.2
Rank #258 / 413
+5%
3.01
Facility 3.01
NY AVG 3.58
Rank #267 / 401
+3%-16%
$0
Facility $0
NY AVG $67.6k
Rank #1 / 409
92
Facility 92
NY AVG 83
Rank #120 / 591
17
Facility 17
NY AVG 18.5
Rank #203 / 408
4.3
Facility 4.3
NY AVG 5.1
Rank #154 / 408
-110-
80
Facility 80
NY AVG 63
Rank #454 / 1169
Goshen Operations LLC
$20.0MFiscal year ending 12/2023
Facility $20.0MFiscal year ending 12/2023
NY AVG $32.0M
Rank #228 / 396
$10.1MFiscal year ending 12/2023
Facility $10.1MFiscal year ending 12/2023
NY AVG $10.7M
Rank #230 / 396
50.6%Fiscal year ending 12/2023
Facility 50.6%Fiscal year ending 12/2023
NY AVG 37%
Rank #243 / 396
335684
Middletown Park Rehabilitation & Health Care Center
NH
MC
PC
SNF
Middletown
230
Facility 230
NY AVG 160
Rank #136 / 742
97.0%
Facility 97.0%
NY AVG 87.2
Rank #95 / 413
+11%
2.93
Facility 2.93
NY AVG 3.58
Rank #292 / 401
+24%-18%
$0
Facility $0
NY AVG $67.6k
Rank #1 / 409
94
Facility 94
NY AVG 83
Rank #81 / 591
14
Facility 14
NY AVG 18.5
Rank #149 / 408
3.5
Facility 3.5
NY AVG 5.1
Rank #99 / 408
-223A+
90
Facility 90
NY AVG 63
Rank #260 / 1169
Park Manor Acquisition II, LLC (For Profit)
$35.9MFiscal year ending 12/2023
Facility $35.9MFiscal year ending 12/2023
NY AVG $32.0M
Rank #125 / 396
$18.3MFiscal year ending 12/2023
Facility $18.3MFiscal year ending 12/2023
NY AVG $10.7M
Rank #143 / 396
50.9%Fiscal year ending 12/2023
Facility 50.9%Fiscal year ending 12/2023
NY AVG 37%
Rank #235 / 396
335655
Highland Rehabilitation and Nursing Center
NH
SNF
Middletown
98
Facility 98
NY AVG 160
Rank #514 / 742
87.8%
Facility 87.8%
NY AVG 87.2
Rank #321 / 413
+1%
3.38
Facility 3.38
NY AVG 3.58
Rank #172 / 401
+3%-6%
$0
Facility $0
NY AVG $67.6k
Rank #1 / 409
92
Facility 92
NY AVG 83
Rank #120 / 591
36
Facility 36
NY AVG 18.5
Rank #373 / 408
12.0
Facility 12.0
NY AVG 5.1
Rank #403 / 408
-86A+
90
Facility 90
NY AVG 63
Rank #260 / 1169
Alec Shneider
$15.1MFiscal year ending 12/2023
Facility $15.1MFiscal year ending 12/2023
NY AVG $32.0M
Rank #282 / 396
$7.0MFiscal year ending 12/2023
Facility $7.0MFiscal year ending 12/2023
NY AVG $10.7M
Rank #338 / 396
46.3%Fiscal year ending 12/2023
Facility 46.3%Fiscal year ending 12/2023
NY AVG 37%
Rank #367 / 396
335526

Financial Assistance for
Nursing Home in New York

Glen Arden Inc is located in Goshen, New York State.
Here are the financial assistance programs available to residents in New York State.

Get Financial aid guidance

Community First Choice Option

NY Medicaid CFCO

Age 65+ or disabled
General New York resident, Medicaid- eligible, care need (not necessarily nursing home level).
Income Limits (2025) ~$2,829/month 300% FBR, individual
Asset Limits $30,182 individual, higher due to NY Medicaid expansion
NY

Higher asset limit; urban density increases demand.

Benefits
Personal care (5-7 hours/day) Respite care (240 hours/year) Home modifications ($1,500 avg.) Assistive technology ($500 avg.)

Expanded In-Home Services for the Elderly Program (EISEP)

NY EISEP

Age 60+
General New York resident, at risk of decline but not nursing home level.
Income Limits ~$2,500/month individual, varies
Asset Limits $15,000 individual
NY

Cost-sharing required above certain income; urban/rural balance.

Benefits
In-home care (3-5 hours/week) Respite (up to 10 days/year) Case management Transportation (~5 trips/month)

Frequently Asked Questions about Glen Arden Inc

What neighborhood is Glen Arden Inc in?

Glen Arden Inc is in the Village of Goshen neighborhood of Goshen.

Is Glen Arden Inc in a walkable area?

Glen Arden Inc has a walk score of 2. Car-dependent. Most errands require a car, with limited nearby walkable options.

What is the occupancy rate at Glen Arden Inc?

Glen Arden Inc's occupancy is 78%.

Does Glen Arden Inc have different floorplan options?

Yes — see the floorplan options available at Glen Arden Inc on this page.

Are pets allowed at Glen Arden Inc?

Yes, Glen Arden Inc allows residents to bring their pets.

Does Glen Arden Inc operate as a for-profit or non-profit?

Glen Arden Inc is registered as a non-profit in NY.

How many beds does Glen Arden Inc have?

Glen Arden Inc has 40 beds.

Guides for Better Senior Living

Care Cost Calculator: See Prices in Your Area

Nursing Home Data Explorer

Don’t Wait Too Long: 7 Red Flag Signs Your Parent Needs Assisted Living Now

The True Cost of Assisted Living in 2025 – And How Families Are Paying For It

Understanding Senior Living Costs: Pricing Models, Discounts & Financial Assistance