

Facility type
Nursing Home
Status
Regular

We arrange tours, appointments, and even moving support so you don’t have to

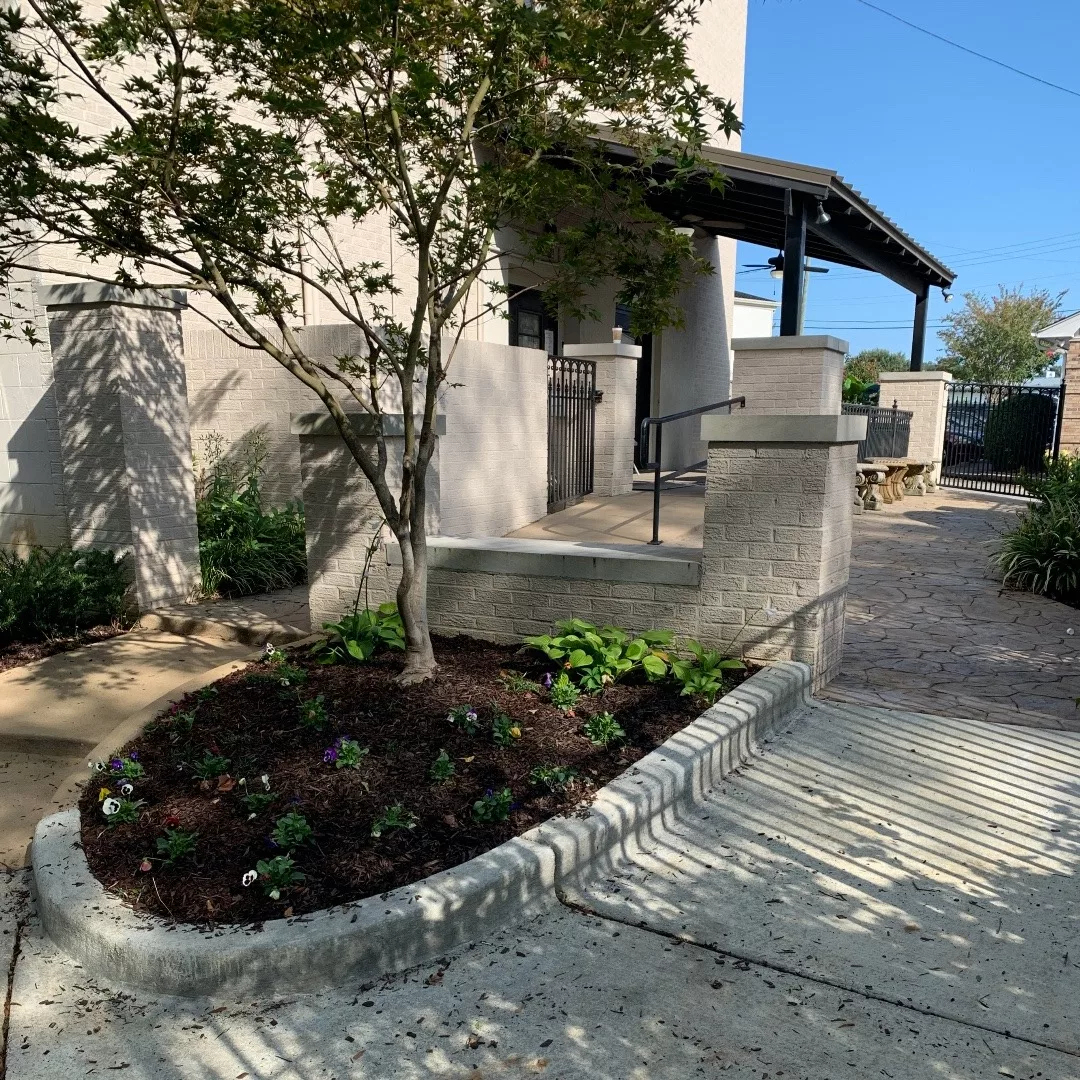
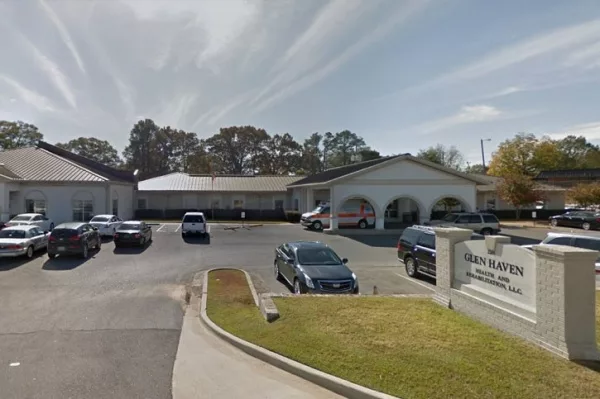
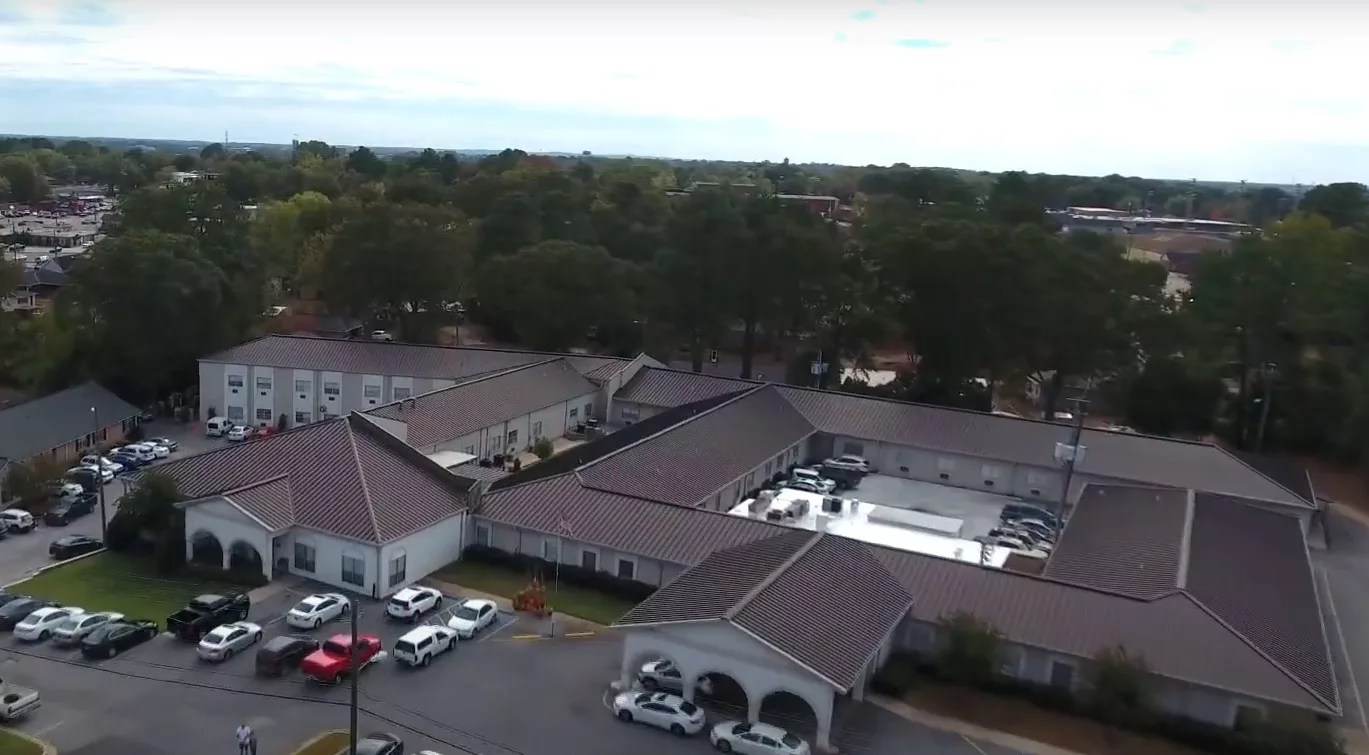
Welcome to Glen Haven Health and Rehabilitation, LLC, a senior living community located in Northport, Alabama, serving Tuscaloosa County and the Western Alabama Region. This community offers nursing homes, providing a wonderful alternative to traditional long-term care and rehabilitation facilities.
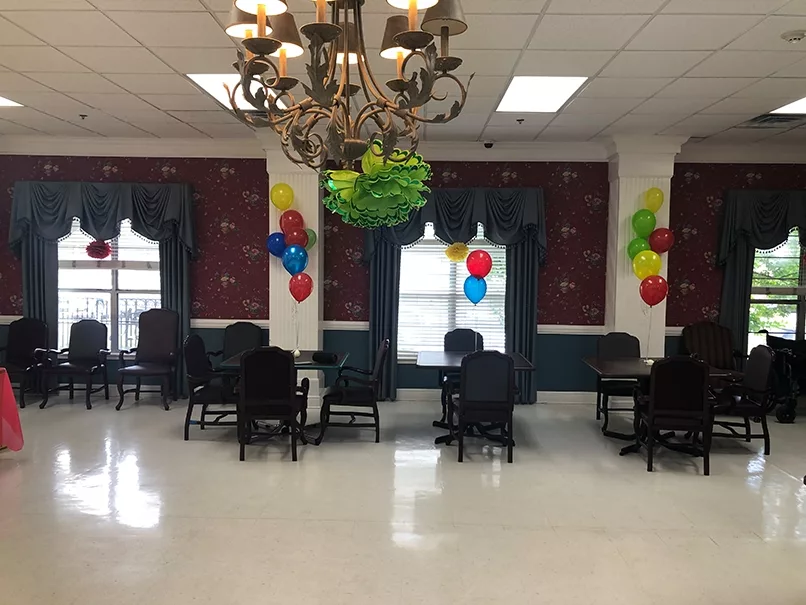
Their commitment to quality and compassionate care is evident in the professional and caring staff, who are dedicated to creating a warm and welcoming environment for residents. With beautifully decorated common areas and serene outdoor courtyards, the facility offers a relaxing and engaging atmosphere, where residents can participate in daily activities that promote an active and fulfilling lifestyle.
 Official CMS rating based on health inspections, staffing and quality measures.
Official CMS rating based on deficiencies found during state health inspections.
Official CMS rating based on nurse staffing hours per resident per day.
Official CMS rating based on clinical outcomes for residents.
Average daily nursing hours per resident (adjusted for acuity). Higher values indicate more nursing time per resident.
Hours of care per resident per day, broken down by staff type. Data from CMS Medicare.
Registered nurse hours per resident per day.
Official CMS rating based on health inspections, staffing and quality measures.
Official CMS rating based on deficiencies found during state health inspections.
Official CMS rating based on nurse staffing hours per resident per day.
Official CMS rating based on clinical outcomes for residents.
Average daily nursing hours per resident (adjusted for acuity). Higher values indicate more nursing time per resident.
Hours of care per resident per day, broken down by staff type. Data from CMS Medicare.
Registered nurse hours per resident per day.
May provide extensive amenities, services and programs.
Occupancy is moderate, suggesting balanced demand.
This home supports both short-term rehab and long-term care, with residents staying for a wide range of durations.
25% of new residents, usually for short-term rehab.
49% of new residents, often for short stays.
26% of new residents, often for long-term daily care.
The portion of the home's budget spent on staff, including nurses, caregivers, and other employees who support care and operations.
All remaining costs needed to run the home, such as food, utilities, building maintenance, supplies and administrative expenses.
Glen Haven Health And Rehabilitation LLC is administrated by Webster Shaw.
Alabama average 2.9
Last Health inspection on Jul 2023
Health citations are formal notices following inspections when they fail to comply with safety and care standards.
5 of 11 citations resulted from standard inspections; 2 of 11 resulted from complaint investigations; and 4 of 11 came from combined inspections (standard and complaint).
Alabama average: 0.7
Alabama average: 0.2
Data sourced from CMS Health Deficiencies reports. Citation severity codes range from A (least serious) to L (most serious). Immediate Jeopardy (J-L) citations indicate situations where the facility's noncompliance has placed residents at risk of death or serious harm.
Assisted Living For seniors needing help with daily tasks but not full-time nursing.
Nursing Homes 24/7 care needed
Assisted Living For seniors needing help with daily tasks but not full-time nursing.
Memory Care Specialized care for those with Memory Loss, Alzheimer's, or dementia, ensuring safety and support.
Nursing Homes 24/7 care needed
Assisted Living For seniors needing help with daily tasks but not full-time nursing.
Nursing Homes 24/7 care needed
Assisted Living For seniors needing help with daily tasks but not full-time nursing.
Nursing Homes 24/7 care needed
Assisted Living For seniors needing help with daily tasks but not full-time nursing.
Nursing Homes 24/7 care needed
 Aspire Physical Recovery Center Of West Alabama
  Heritage Health Care & Rehab Inc
 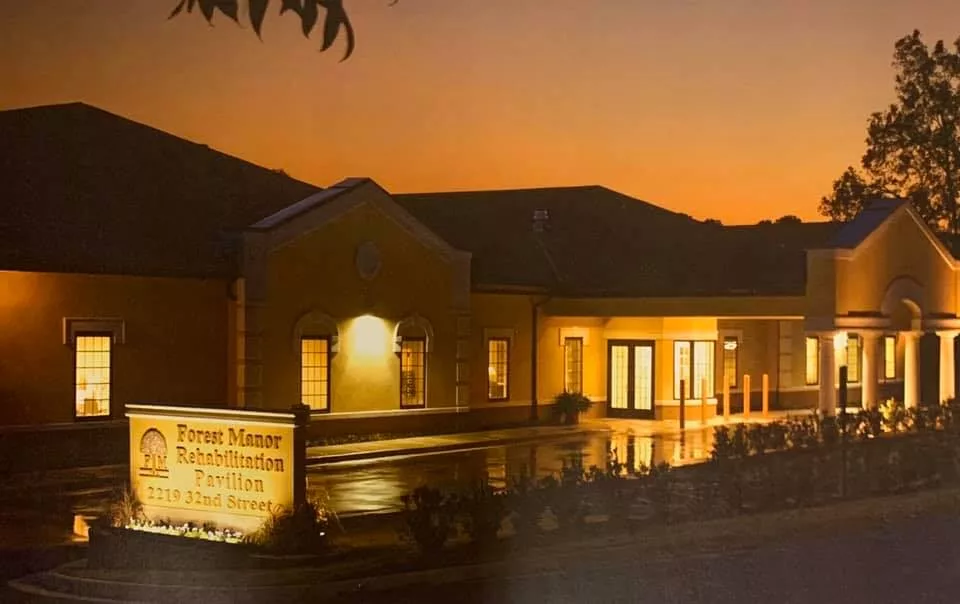 Forest Manor Health and Rehab
 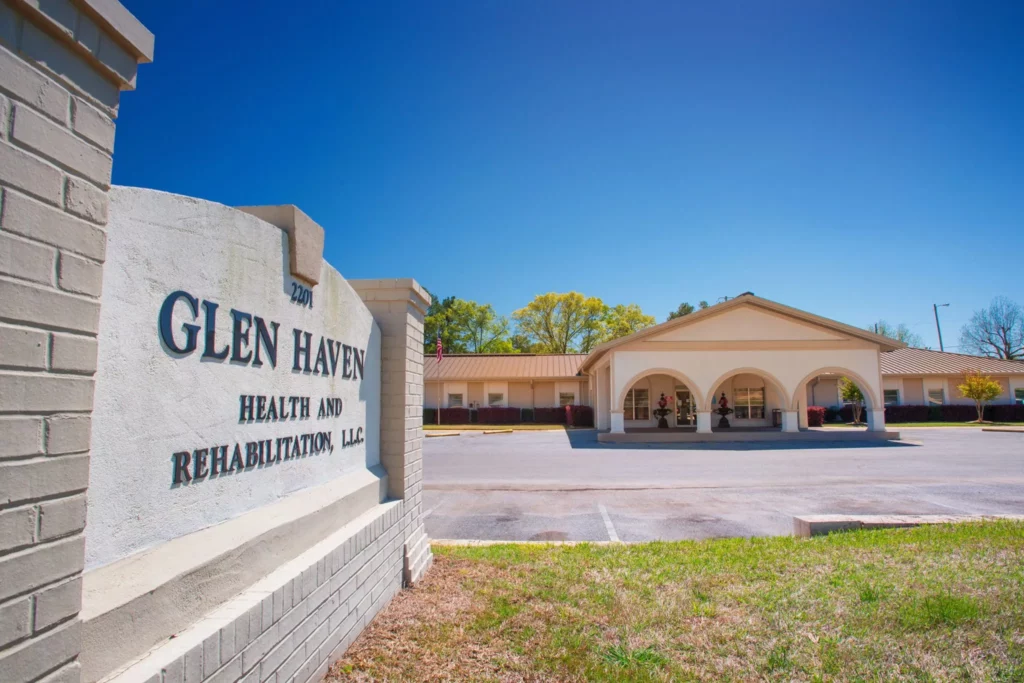 Glen Haven Health And Rehabilitation LLC
![]() 0.6 miles from city center — 0.5 miles to nearest hospital (Select Medical)
0.6 miles from city center — 0.5 miles to nearest hospital (Select Medical)
![]() 2201 32nd St, Northport, AL 35476
2201 32nd St, Northport, AL 35476
Add your location
Source: CMS Payroll-Based Journal (Q2 2025)
| Role ⓘ | Count ⓘ | Avg Shift (hrs) ⓘ | Uses Contractors? ⓘ |
|---|---|---|---|
| Registered Nurse | 17 | 8.3 | No |
| Licensed Practical Nurse | 24 | 8.5 | No |
| Certified Nursing Assistant | 96 | 7.6 | No |
| Role ⓘ | Employees ⓘ | Contractors ⓘ | Total Staff ⓘ | Total Hours ⓘ | Days Worked ⓘ | % of Days ⓘ | Avg Shift (hrs) ⓘ |
|---|---|---|---|---|---|---|---|
| Certified Nursing Assistant | 96 | 0 | 96 | 37,396 | 91 | 100% | 7.6 |
| Licensed Practical Nurse | 24 | 0 | 24 | 9,192 | 91 | 100% | 8.5 |
| Registered Nurse | 17 | 0 | 17 | 7,459 | 91 | 100% | 8.3 |
| Nurse Aide in Training | 27 | 0 | 27 | 5,687 | 91 | 100% | 7.9 |
| Medication Aide/Technician | 13 | 0 | 13 | 3,687 | 90 | 99% | 8.3 |
| RN Director of Nursing | 7 | 0 | 7 | 2,880 | 69 | 76% | 8.2 |
| Clinical Nurse Specialist | 3 | 0 | 3 | 1,384 | 65 | 71% | 8 |
| Qualified Social Worker | 0 | 11 | 11 | 1,245 | 84 | 92% | 5.8 |
| Other Dietary Services Staff | 2 | 0 | 2 | 1,005 | 66 | 73% | 7.9 |
| Mental Health Service Worker | 2 | 0 | 2 | 1,001 | 65 | 71% | 7.9 |
| Speech Language Pathologist | 0 | 7 | 7 | 764 | 74 | 81% | 6.4 |
| Physical Therapy Assistant | 0 | 6 | 6 | 637 | 77 | 85% | 6 |
| Administrator | 1 | 0 | 1 | 504 | 63 | 69% | 8 |
| Dental Services Staff | 1 | 0 | 1 | 501 | 64 | 70% | 7.8 |
| Physical Therapy Aide | 0 | 4 | 4 | 485 | 60 | 66% | 6.9 |
| Nurse Practitioner | 1 | 0 | 1 | 448 | 55 | 60% | 8.1 |
| Dietitian | 1 | 0 | 1 | 440 | 55 | 60% | 8 |
| Respiratory Therapy Technician | 0 | 4 | 4 | 428 | 66 | 73% | 6 |
| Occupational Therapy Aide | 1 | 0 | 1 | 256 | 31 | 34% | 8.3 |
| Medical Director | 0 | 2 | 2 | 12 | 5 | 5% | 2 |
Source: CMS Long-Term Care Facility Characteristics (Data as of Jan 2026)
Residents meet regularly to discuss policies, care quality, and activities
State-approved Nurse Aide Training and Competency Evaluation Program on-site
Organized group of residents that meets regularly to discuss facility policies, quality of life, and activities.
Data sourced from CMS Long-Term Care Facility Characteristics quarterly report. Payer mix reflects the current resident census by primary payment source.
These measures show how residents usually do over time at this home, based on health outcomes and preventive care.
Alabama average: 8.9
Alabama average: 14.5
Alabama average: 13.9%
Alabama average: 16.1%
Alabama average: 13.6%
Alabama average: 3.4%
Alabama average: 5.9%
Alabama average: 2.7%
Alabama average: 5.4%
Alabama average: 1.2%
Alabama average: 20.7%
Alabama average: 91.5%
Alabama average: 94.8%
Alabama average: 2.00
Alabama average: 1.79
Alabama average: 83.7%
Alabama average: 2.1%
Alabama average: 80.3%
Alabama average: 24.5%
Alabama average: 11.5%
Alabama average: 0.8%
Alabama average: 53.7%
Alabama average: 50.6%
Quality measures are calculated from Minimum Data Set (MDS) assessments. For most measures, lower percentages indicate better care quality.
Federal penalties imposed by CMS for regulatory violations, including civil money penalties (fines) and denials of payment for new Medicare/Medicaid admissions.
Source: CMS Penalties Database (Data as of Jan 2026)
Alabama average: $65K
Alabama average: 2.4
Alabama average: 0.3
Penalties are imposed by CMS for violations of federal nursing home regulations.
Last updated: Jan 2026
Historical financial and operational data for Glen Haven Health And Rehabilitation LLC based on CMS SNF Cost Reports.
Loading trend charts...
Care Cost Calculator: See Prices in Your Area
Nursing Home Data Explorer
Don’t Wait Too Long: 7 Red Flag Signs Your Parent Needs Assisted Living Now
The True Cost of Assisted Living in 2025 – And How Families Are Paying For It
Understanding Senior Living Costs: Pricing Models, Discounts & Financial Assistance

Touring a community? Use this expert-backed checklist to stay organized, ask the right questions, and find the perfect fit.
We'll send you a PDF version of the touring checklist.


