Goldwater Care Peoria Heights
Nursing Home · Peoria, IL

Goldwater Care Peoria Heights

Nursing Home · Peoria, IL
Calculator: See prices in your area
Goldwater Care Peoria Heights accepts Medicare, Medicaid, and private pay.

Overview of Goldwater Care Peoria Heights

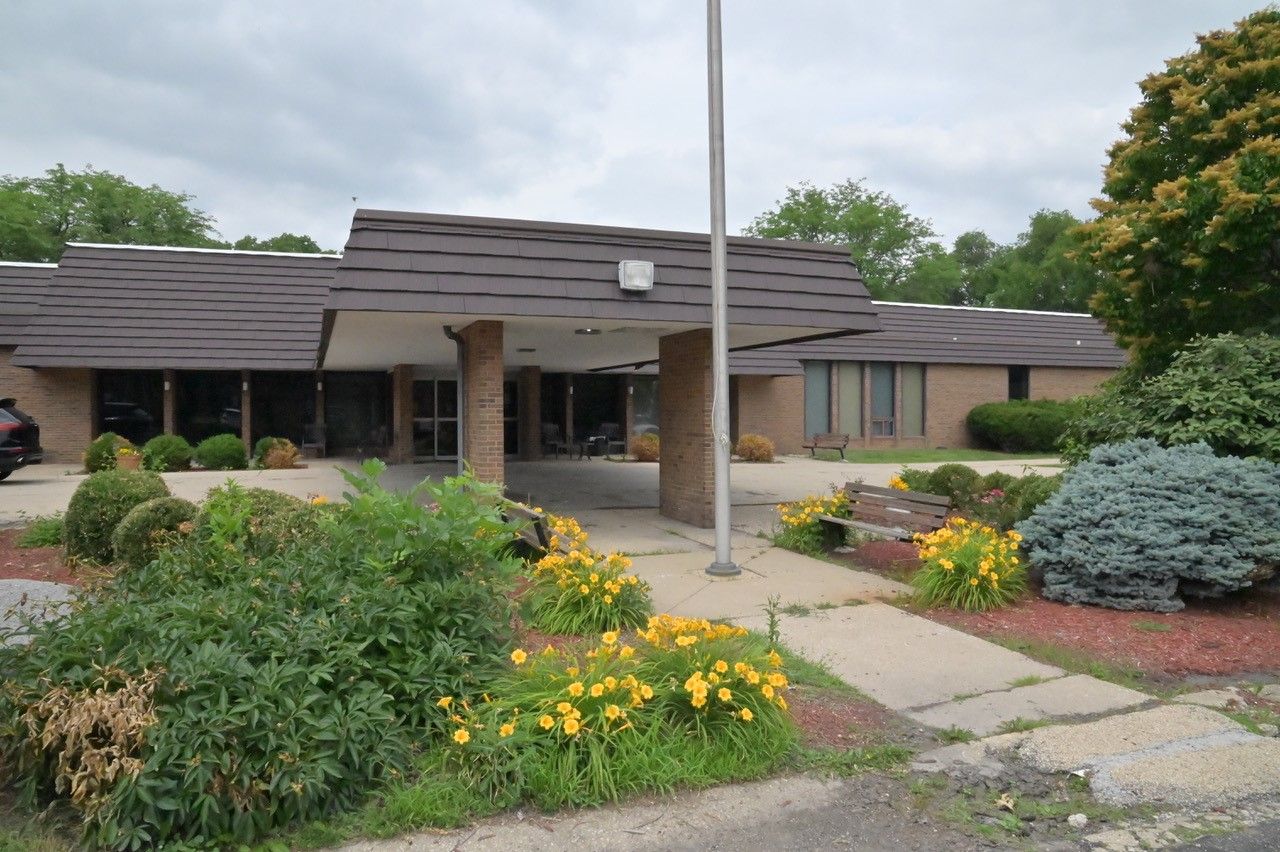
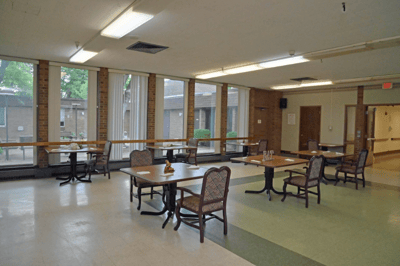
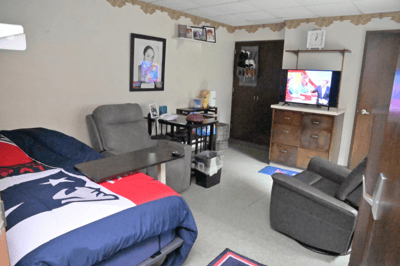
Goldwater Care Peoria Heights is a nursing home in Peoria, IL, offering a wide range of rehabilitation and skilled nursing services. With a compassionate and supportive environment, the community ensures older adults are treated well. Residents also experience a worry-free lifestyle with 24-hour care, nutritious meals, and transportation. Combining professional excellence and genuine care through personalized care plans, the community goes above and beyond to help residents recover and return to their routines with ease.

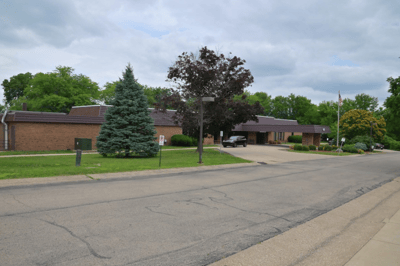
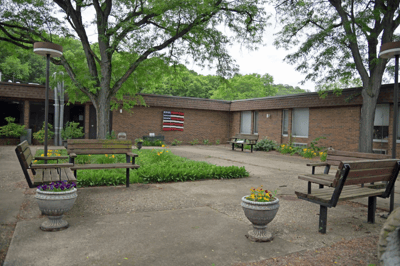
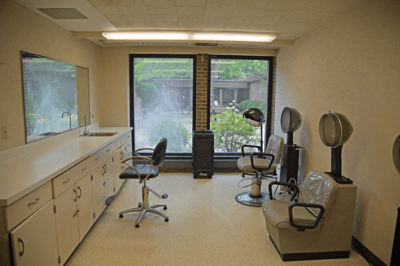
Family events, fishing trips, and various recreational activities ensure residents can stay active and maintain their holistic wellness. A beauty/ barber shop and three beautiful courtyards are also available for residents’ relaxation. Located near bus stops, the Pimiteoui Trail, and parks in the quiet neighborhood of Peoria, the community guarantees a stress-free retirement. This nursing home is dedicated to older adults’ welfare, making it one of the trusted options for senior living in Illinois.

Staffing hours breakdown

Info Daily nursing hours per resident by staff type, reported to CMS. Higher is generally better — compare this facility to state and national averages to see where staffing stands.

Hours per resident per day — compared to Illinois state averages

Total nursing care / resident Info This home is ranked 154th out of 167 homes in Illinois. Total adjusted nursing hours per resident per day, combining RN, LPN, and aide time. CMS adjusts this for case-mix so facilities can be fairly compared.
1h 59m per day
Rank #154 / 167Nurse hours — State benchmarkedThis home is ranked 154th out of 167 homes in Illinois. Shows adjusted nurse hours per resident per day benchmarked to the Illinois average, with a ranking across 167 Illinois SNFs. More hours mean more direct care. The national average is about 3.5 hrs; below 3.0 is a red flag.Click the rank badge to see the full State ranking.Click here to see the full State ranking.
This facility Illinois avg (3h 6m per day)
vs Illinois avg
-36%

1 of 1 metrics below state avg

Staff typeHours / Day / Residentvs state avg
Weekend Total Nursing Info Combined nursing hours (RN + LPN + Nurse Aide) per resident per day on weekends. Staffing often drops on weekends — this figure reveals whether the facility maintains adequate coverage outside of weekday hours. 2h 37m per day ▼ 15% State avg: 3h 5m per day · National avg: 3h 25m per day

Types of Care at Goldwater Care Peoria Heights

Nursing Home

Capacity and availability

This home usually has availability

Higher occupancy than the Illinois average: 69.3%
Occupancy rate
74.9% Rank #102 / 199Occupancy rate — State benchmarkedThis home is ranked 102nd out of 199 homes in Illinois. Shows this facility's occupancy rate versus the Illinois average, with its Statewide rank out of 199. Higher occupancy signals strong local demand and financial stability.Click the rank badge to see the full State ranking.Click here to see the full State ranking.
Avg. Length of Stay
120 days
Walk Score
Walk Score: 11 / 100 Rank #591 / 648Walk Score — State benchmarkedThis home is ranked 591st out of 648 homes in Illinois. Shows how walkable this facility's neighborhood is compared to the average Walk Score across Illinois SNFs. Higher scores benefit residents, families, and staff.Click the rank badge to see the full State ranking.Click here to see the full State ranking.
Car-dependent. Most errands require a car, with limited nearby walkable options.

Contact Goldwater Care Peoria Heights

Staffing Data

Reporting period: October 1 – December 31, 2025 (Q4 2025). Source: CMS Payroll-Based Journal report.

Total staff 146
Employees 98
Contractors 48
Staff to resident ratio 1.72:1
0% compared with Illinois average
Illinois average ratio: 1.80:1 Illinois average ratio: 1.80:1See full Illinois ranking
Avg staff/day 41
Average shift 7.9 hours
0% compared with Illinois average
Illinois average: 7.6 hours Illinois average shift: 7.6 hoursSee full Illinois ranking
Total staff hours (quarter) 29,783

Nursing staff breakdown

Q4 2025 · Oct 1 – Dec 31 More info This data comes from the CMS Payroll-Based Journal report covering October 1 – December 31, 2025.
Registered Nurse

Manages medical care and health needs.

RN Staff Info 10 total: 9 full-time employees and 1 contractor. 10
Average shift length Info Average shift length. Calculated as total hours divided by days worked and average staff per day. 8.3 hours
Licensed Practical Nurse

Assists with medical care and medications.

LPN Staff Info 43 total: 19 full-time employees and 24 contractors. 43
Average shift length Info Average shift length. Calculated as total hours divided by days worked and average staff per day. 9.5 hours
Certified Nursing Assistant

Helps with daily care and mobility.

CNA Staff Info All 53 CNA Staff are full-time employees. No contractors work on this role. 53
Average shift length Info Average shift length. Calculated as total hours divided by days worked and average staff per day. 7.9 hours

Contractor staffing

Q4 2025 · Oct 1 – Dec 31 More info This data comes from the CMS Payroll-Based Journal report covering October 1 – December 31, 2025.

Total hours from contractors

6.7%

1,994 contractor hours this quarter

Licensed Practical Nurse: 24 Occupational Therapy Aide: 4 Respiratory Therapy Technician: 3 Physical Therapy Assistant: 3 Clinical Nurse Specialist: 2 RN Director of Nursing: 2 Occupational Therapy Assistant: 2 Speech Language Pathologist: 1 Physical Therapy Aide: 1 Registered Nurse: 1 Administrator: 1 Feeding Assistant: 1 Qualified Social Worker: 1 Mental Health Service Worker: 1 Medical Director: 1

Staff by category

Q4 2025 · Oct 1 – Dec 31 More info This data comes from the CMS Payroll-Based Journal report covering October 1 – December 31, 2025.
Certified Nursing Assistant5305316,88392100%7.9
Licensed Practical Nurse1924435,79392100%9.5
Other Dietary Services Staff7071,77392100%7.6
Registered Nurse91101,5398795%8.3
Diagnostic X-ray Services Staff2025545964%7.5
RN Director of Nursing2245066166%6.6
Speech Language Pathologist0115056470%7.9
Nurse Practitioner2024586065%7.6
Dietitian2024565964%7.4
Administrator2133984953%7.5
Occupational Therapy Aide0443714852%6.3
Physical Therapy Aide0111865964%3.2
Mental Health Service Worker011831516%5.5
Occupational Therapy Assistant022532527%2
Respiratory Therapy Technician033522426%2.2
Qualified Social Worker011472426%2
Clinical Nurse Specialist0224489%5.5
Feeding Assistant0114267%6.9
Physical Therapy Assistant033411820%2.3
Medical Director011333%1
53 Certified Nursing Assistant
% of Days 100%
43 Licensed Practical Nurse
% of Days 100%
7 Other Dietary Services Staff
% of Days 100%
10 Registered Nurse
% of Days 95%
2 Diagnostic X-ray Services Staff
% of Days 64%
4 RN Director of Nursing
% of Days 66%
1 Speech Language Pathologist
% of Days 70%
2 Nurse Practitioner
% of Days 65%
2 Dietitian
% of Days 64%
3 Administrator
% of Days 53%
4 Occupational Therapy Aide
% of Days 52%
1 Physical Therapy Aide
% of Days 64%
1 Mental Health Service Worker
% of Days 16%
2 Occupational Therapy Assistant
% of Days 27%
3 Respiratory Therapy Technician
% of Days 26%
1 Qualified Social Worker
% of Days 26%
2 Clinical Nurse Specialist
% of Days 9%
1 Feeding Assistant
% of Days 7%
3 Physical Therapy Assistant
% of Days 20%
1 Medical Director
% of Days 3%

Penalties and fines

Includes penalties issued in 2023-2024

Federal penalties imposed by CMS for regulatory violations, including civil money penalties (fines) and denials of payment for new Medicare/Medicaid admissions.

Source: CMS Penalties Database (Data as of Jan 2026)

Total fines amount $260K Rank #157 / 168Federal fines — State benchmarkedThis home is ranked 157th out of 168 homes in Illinois. Shows this facility's cumulative CMS federal fine dollars versus the Illinois average among facilities with fines, and where it ranks among 168 skilled nursing facilities in the pool. Lower total dollars mean a better rank.Click the rank badge to see the full State ranking.Click here to see the full State ranking.
82% higher than Illinois average

Illinois average: $143K

Number of fines 3
In line with Illinois average

Illinois average: 3.0

Payment Denials Info Serious action where Medicare and/or Medicaid temporarily stops payments for new residents until issues are fixed. 2
89% more payment denials than Illinois average

Illinois average: 1.1

Fines amount comparison
This facility $260K
Illinois average $143K
Penalty History

Penalties are imposed by CMS for violations of federal nursing home regulations.

4 penalties in the past 3 years

Multiple penalties were reported in the last 3 years.

Civil Money Penalty Info Fines imposed for noncompliance, which can be assessed per day or per instance of violation. Jan 2, 2024
$162K
Payment Denial Info Serious action where Medicare and/or Medicaid temporarily stops payments for new residents until issues are fixed. Jan 2, 2024
14 days
Civil Money Penalty Info Fines imposed for noncompliance, which can be assessed per day or per instance of violation. Oct 11, 2023
$52K
Civil Money Penalty Info Fines imposed for noncompliance, which can be assessed per day or per instance of violation. Aug 13, 2023
$46K

Last updated: Jan 2026

Quality of care over time

These measures show how residents usually do over time at this home, based on health outcomes and preventive care.

High-risk clinical events score Info A composite score based on pressure ulcers, falls with injury, weight loss, walking ability decline, and activities of daily living decline. 5.6
42% better than Illinois average

Illinois average: 9.7

Functional decline score Info A composite score based on activities of daily living decline, walking ability decline, and incontinence. 11.0
41% better than Illinois average

Illinois average: 18.6

Long-stay resident measures
Need for Help with Daily Activities Increased Info Percent of long-stay residents whose need for help with daily activities has increased 6.2%
60% better than Illinois average

Illinois average: 15.5%

Walking Ability Worsened Info Percent of long-stay residents whose ability to move independently worsened 10.0%
46% better than Illinois average

Illinois average: 18.4%

Low Risk Residents with Bowel/Bladder Incontinence Info Percent of low risk long-stay residents who lose control of their bowels or bladder 16.9%
22% better than Illinois average

Illinois average: 21.6%

Falls with Major Injury Info Percent of long-stay residents experiencing one or more falls with major injury 2.6%
22% better than Illinois average

Illinois average: 3.4%

High Risk Residents with Pressure Ulcers Info Percent of long-stay high risk residents with pressure ulcers 2.8%
47% better than Illinois average

Illinois average: 5.3%

Urinary Tract Infection Info Percent of long-stay residents with a urinary tract infection 0.9%
51% better than Illinois average

Illinois average: 1.8%

Lost Too Much Weight Info Percent of long-stay residents who lose too much weight 6.4%
In line with Illinois average

Illinois average: 6.5%

Depressive Symptoms Info Percent of long-stay residents who have depressive symptoms 77.0%
60% worse than Illinois average

Illinois average: 48.1%

Antipsychotic Use Info Percent of long-stay residents who received an antipsychotic medication 28.4%
41% worse than Illinois average

Illinois average: 20.2%

Pneumococcal Vaccine Info Percent of long-stay residents assessed and appropriately given the pneumococcal vaccine 93.9%
5% better than Illinois average

Illinois average: 89.2%

Influenza Vaccine Info Percent of long-stay residents assessed and appropriately given the seasonal influenza vaccine 95.7%
In line with Illinois average

Illinois average: 91.6%

Short-stay resident measures
Pneumococcal Vaccine Info Percent of short-stay residents assessed and appropriately given the pneumococcal vaccine 83.2%
22% better than Illinois average

Illinois average: 68.3%

Antipsychotic medication increase Info Percent of short-stay residents who newly received an antipsychotic medication 0.0%
100% better than Illinois average

Illinois average: 2.3%

Influenza Vaccine Info Percent of short-stay residents assessed and appropriately given the seasonal influenza vaccine 100.0%
59% better than Illinois average

Illinois average: 63.0%

Breakdown by payment type

Medicare

14% of new residents, usually for short-term rehab.

Typical stay 1 - 2 months

Private pay

67% of new residents, often for short stays.

Typical stay 5 - 6 months

Medicaid

19% of new residents, often for long-term daily care.

Typical stay 3 - 4 months

Facility Characteristics

Source: CMS Long-Term Care Facility Characteristics (Data as of Jan 2026)

Total residents 85
Medicare
4
4.7% of residents
Medicaid
81
95.3% of residents
Programs & Services
Residents Group

Residents meet regularly to discuss policies, care quality, and activities

Active Resident Council

Organized group of residents that meets regularly to discuss facility policies, quality of life, and activities.

Finances and operations

Privately-owned community
Operated by a business corporation.
Home revenue
$12.1M
Profit
$15.5K
Privately-owned community Operated by a business corporation.
Home revenue
$12.1M Rank #105 / 166Revenue — State benchmarkedThis home is ranked 105th out of 166 homes in Illinois. Shows this facility's annual revenue compared to the Illinois SNF average. Higher revenue generally means more resources for staffing and capital — read alongside Payroll %.Click the rank badge to see the full State ranking.Click here to see the full State ranking.
Profit
$15.5K
Payroll costs Info The portion of the home's budget spent on staff, including nurses, caregivers, and other employees who support care and operations. Rank #137 / 166Payroll — State benchmarkedThis home is ranked 137th out of 166 homes in Illinois. Shows total annual staff payroll benchmarked to the Illinois average. Higher payroll investment relative to peers often signals better staffing and less reliance on cheaper contract labor.Click the rank badge to see the full State ranking.Click here to see the full State ranking.
$4.8M
40.1% of revenue Rank #116 / 166Payroll % — State benchmarkedThis home is ranked 116th out of 166 homes in Illinois. Shows payroll as a percentage of revenue versus the Illinois average. Well-run Illinois SNFs typically land around 54–67% — the top third Statewide. Below 25% may signal understaffing or heavy agency use — read with Staffing ratings.Click the rank badge to see the full State ranking.Click here to see the full State ranking.
Other operating costs Info All remaining costs needed to run the home, such as food, utilities, building maintenance, supplies and administrative expenses.
$7.2M
Total costs $12.0M

What does this home offer?

Building type icon
Building type icon

Building Type: Single-story

On-site medical care and health services icon

On-site Medical Care and Health Services

Rehabilitative support icon

Rehabilitative Support

Beauty services icon

Beauty Services

Social and recreational activities icon

Social and Recreational Activities

Transportation services icon

Transportation Services

Who this home usually serves

TYPE OF STAY

Primarily long-term care, limited rehab

Most residents stay long-term, while a smaller portion are admitted for short-term rehab.

Places of interest near Goldwater Care Peoria Heights

Address 2.2 miles from city center Info Estimated distance in miles from Peoria Heights's city center to Goldwater Care Peoria Heights's address, calculated via Google Maps.

Calculate Travel Distance to Goldwater Care Peoria Heights

Add your location

Address

Financial Assistance for
Nursing Home in Illinois

Goldwater Care Peoria Heights is located in Peoria Heights, Illinois.
Here are the financial assistance programs available to residents in Illinois.

Get Financial aid guidance

Community Care Program

Illinois CCP

Age 60+
General Illinois resident, at risk of nursing home placement.
Income Limits (2025) ~$1,215/month individual
Asset Limits $17,500 individual, excludes home, car
IL

High demand in urban areas; waitlists possible.

Benefits
In-home care (3-5 hours/day) Adult day services ($65/day) Emergency home response systems ($30/month)

Illinois Respite Program

IL Respite (via NFCSP)

Age Caregiver of someone 60+ (or with dementia)
General Illinois resident.
Income Limits No strict limit; prioritizes low-income.
Asset Limits Not applicable.
IL

Limited slots; urban/rural balance.

Benefits
In-home respite (4-6 hours/day) Adult day care (~$65/day) Short-term facility care (up to 5 days)

Supportive Living Program (SLP)

Illinois Medicaid Supportive Living Program

Age 65+ or 22-64 with disability
General Illinois resident, Medicaid-eligible, needs moderate assistance (not nursing home-level).
Income Limits (2025) ~$2,829/month (300% FBR, individual); QIT allowed.
Asset Limits $2,000 (individual), $3,000 (couple) (excludes home, car).
IL

~200 SLP sites statewide; room/board not covered.

Benefits
Personal care (5-7 hours/day, e.g., bathing, mobility) Meals Housekeeping Medication management Respite (~240 hours/year)

Persons Who Are Elderly Waiver

Illinois Medicaid Elderly Waiver

Age 65+
General Illinois resident, Medicaid-eligible, nursing home-level care need.
Income Limits (2025) ~$2,829/month 300% FBR, individual
Asset Limits $2,000 (individual), $3,000 (couple).
IL

Part of HealthChoice Illinois; consumer-directed options available.

Benefits
Personal care (5-7 hours/day, e.g., dressing, eating) Homemaker Adult day care (~$60/day) Respite (240 hours/year) Home mods ($1,000 avg.)

Medicare Savings Program (MSP)

Illinois Medicare Savings Program

Age 65+ or disabled
General Illinois resident, Medicare Part A/B.
Income Limits (2025) ~$2,510/month (QMB), ~$3,380/month (SLMB), ~$3,598/month (QI)—individual.
Asset Limits $9,430 (individual), $14,130 (couple).
IL

Three tiers; no waitlist.

Benefits
Covers Part B premiums ($174.70/month) Deductibles ($240/year) Copays (~20%)

Optional State Supplementation (OSS)

Illinois Optional State Supplementation

Age 65+ or disabled
General Illinois resident, in approved facility, SSI recipient or low-income.
Income Limits (2025) ~$1,004/month including SSI
Asset Limits $2,000 (individual), $3,000 (couple).
IL

~$50-$500/month based on facility type.

Benefits
Cash (~$50-$500/month) for room/board in personal care homes or SLFs

VA Aid and Attendance (A&A) and Housebound Benefits

Illinois VA Aid and Attendance/Housebound

Age 65+ or disabled veteran/spouse
General Illinois resident, wartime service, need for ADL help (A&A) or homebound.
Income Limits (2025) Net income < ~$1,984/month (veteran with dependent, A&A); pension offsets income.
Asset Limits ~$155,356 net worth limit
IL

High veteran demand in urban/rural areas.

Benefits
Cash (~$1,433-$2,642/month veteran, ~$951-$1,318 spouse) for care costs (e.g., in-home, assisted living)

Compare Nursing Home around Peoria

The information below is reported by the Illinois Department of Public Health, Office of Health Care Regulation.

3 facilities compared · CMS & IL Dept. of Health data

Filter by care type
Accolade Healthcare of Peoria
NH

Nursing Home Licensed facility providing 24/7 skilled nursing care for residents with complex, ongoing medical needs. Staffed by RNs, LPNs, and CNAs. Inspected and star-rated annually by CMS. Accepts Medicare (short-term rehab) and Medicaid (long-term care).

HC

Home Care Professional care delivered in the person's own home — from companionship and errands to skilled nursing and therapy. Allows seniors to age in place. Medicare covers skilled home health when medically necessary.

MC

Memory Care Secured, specialized care for people living with Alzheimer's or dementia. Staff trained in cognitive impairment, with higher staff-to-resident ratios and an environment designed to reduce confusion and wandering risk.

RC

Respite Care Short-term temporary care — days to weeks — to give family caregivers a break. Full care provided during the stay. Often used after hospitalization or to trial a facility before a permanent placement decision.

Peoria144 76.3% +10%2.72 -37%-12%$0343.82127 42 Moshe Freedman$17.1M$6.6M38.8%145039
The Loft of Peoria
NH

Nursing Home Licensed facility providing 24/7 skilled nursing care for residents with complex, ongoing medical needs. Staffed by RNs, LPNs, and CNAs. Inspected and star-rated annually by CMS. Accepts Medicare (short-term rehab) and Medicaid (long-term care).

MC

Memory Care Secured, specialized care for people living with Alzheimer's or dementia. Staff trained in cognitive impairment, with higher staff-to-resident ratios and an environment designed to reduce confusion and wandering risk.

RC

Respite Care Short-term temporary care — days to weeks — to give family caregivers a break. Full care provided during the stay. Often used after hospitalization or to trial a facility before a permanent placement decision.

Peoria120--3.12 -41%+1%$262.4k844.4591 13 Loft Peoria Holdings LLC$9.0M$6.1M68.4%145647
Goldwater Care Peoria Heights -
NH

Nursing Home Licensed facility providing 24/7 skilled nursing care for residents with complex, ongoing medical needs. Staffed by RNs, LPNs, and CNAs. Inspected and star-rated annually by CMS. Accepts Medicare (short-term rehab) and Medicaid (long-term care).

Peoria Heights110--1.99----52%-36%$260.0k763.8690 11 -$12.1M$4.8M40.1%145811

Frequently Asked Questions about Goldwater Care Peoria Heights

Is Goldwater Care Peoria Heights in a walkable area?

Goldwater Care Peoria Heights has a walk score of 11. Car-dependent. Most errands require a car, with limited nearby walkable options.

What is the best email address for Goldwater Care Peoria Heights?

The team at Goldwater Care Peoria Heights can be reached at [email protected].

Are there photos of Goldwater Care Peoria Heights?

Yes — there are 5 photos of Goldwater Care Peoria Heights in the photo gallery on this page.

What is the address of Goldwater Care Peoria Heights?

Goldwater Care Peoria Heights is located at 5533 N Galena Rd, Peoria Heights, IL 61616.

What is the phone number of Goldwater Care Peoria Heights?

(309) 682-5428 will put you in contact with the team at Goldwater Care Peoria Heights.

Is Goldwater Care Peoria Heights Medicare or Medicaid certified?

Yes — Goldwater Care Peoria Heights is a CMS-certified provider of Medicare and Medicaid.

Guides for Better Senior Living

Care Cost Calculator: See Prices in Your Area

Nursing Home Data Explorer

Don’t Wait Too Long: 7 Red Flag Signs Your Parent Needs Assisted Living Now

The True Cost of Assisted Living in 2025 – And How Families Are Paying For It

Understanding Senior Living Costs: Pricing Models, Discounts & Financial Assistance

Explore Open Rooms
1 Contact details
2 What type of senior care service are you looking for?
3 What budget do you have in mind for senior care?
4 How soon do you need to find care?
5 Additional details

Thank you for your interest!

Our team will be in touch shortly to help with next steps.