Grand Prairie of Macomb
Nursing Home & Assisted Living · Macomb, IL
CMS overall rating Info The Overall CMS Rating is scored from 1 to 5 stars and combines results from health inspections, staffing levels, and quality measures. Health inspections carry the most weight. Staffing and quality scores can increase or decrease the final rating based on performance compared to state and national standards.

Grand Prairie of Macomb

Nursing Home & Assisted Living · Macomb, IL
CMS overall rating Info The Overall CMS Rating is scored from 1 to 5 stars and combines results from health inspections, staffing levels, and quality measures. Health inspections carry the most weight. Staffing and quality scores can increase or decrease the final rating based on performance compared to state and national standards.
Calculator: See prices in your area
Grand Prairie of Macomb accepts Medicare, Medicaid, and private pay.

Overview of Grand Prairie of Macomb

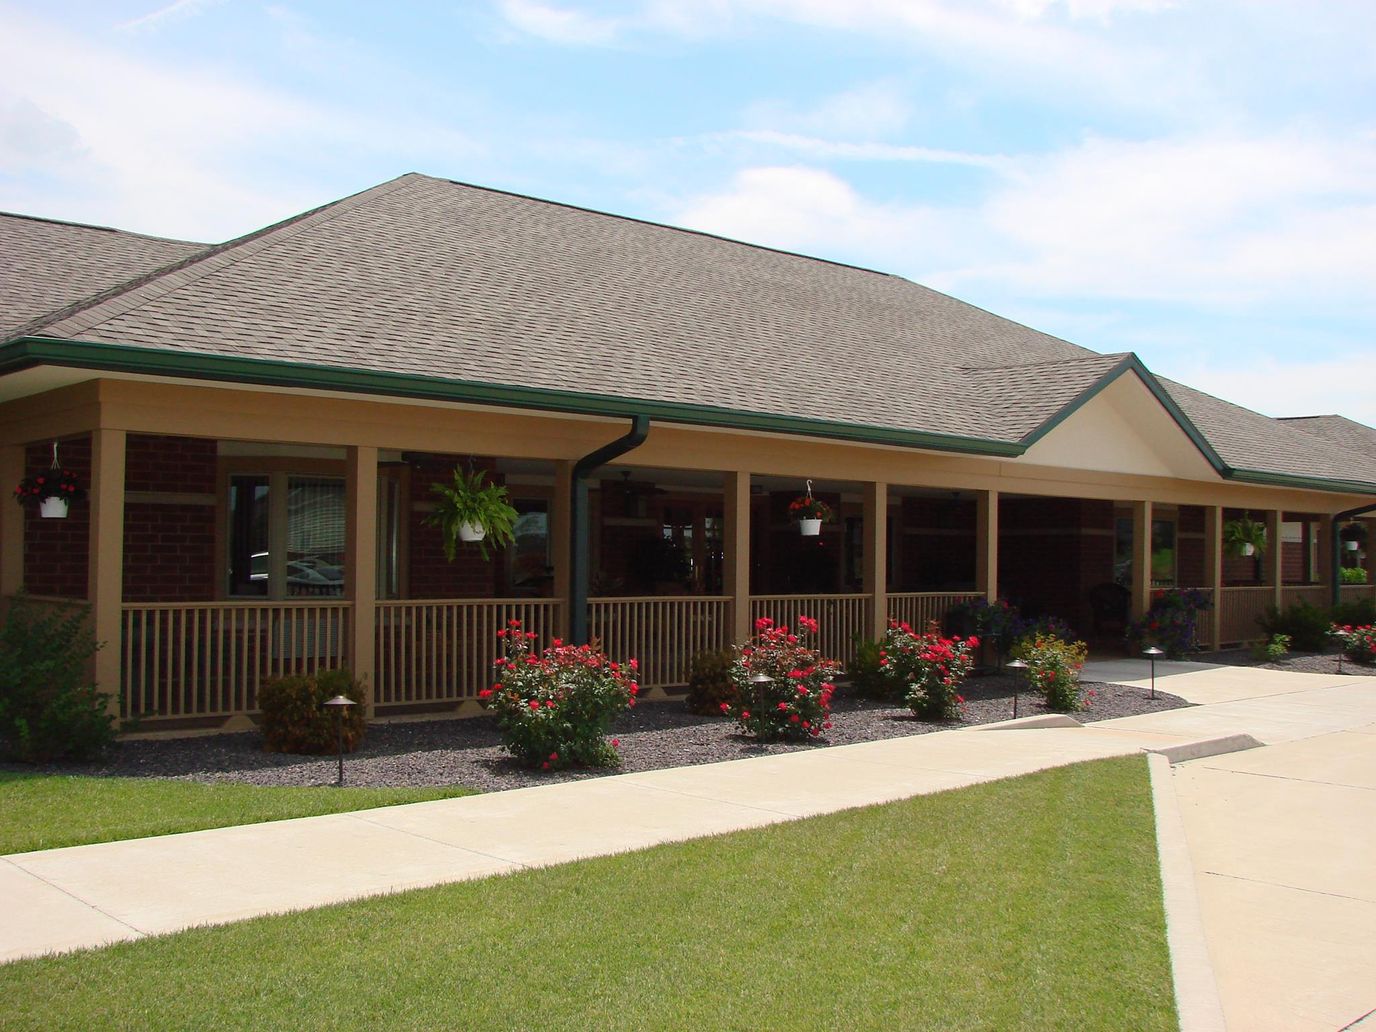
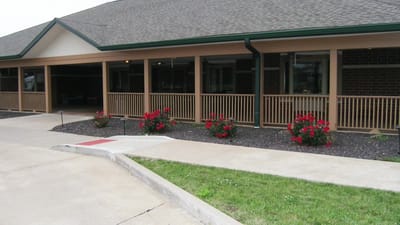
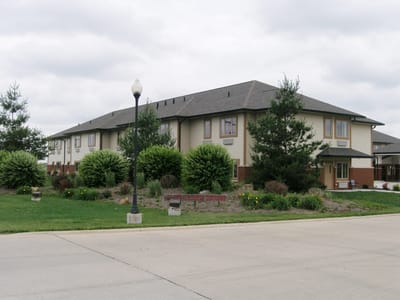
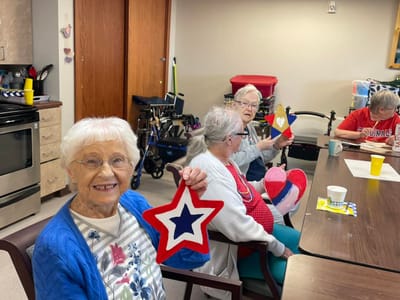
Discover a warm and affordable assisted living community at Grand Prairie of Macomb, where seniors experience a lifestyle enriched with compassion, dignity, and care. Situated in the heart of Macomb, IL, the community offers an inviting environment tailored to support seniors who need assisted living services. Residents can select from studio and one-bedroom apartments, each thoughtfully designed with a kitchenette, private bathroom, and emergency response system, ensuring comfort and security in every living space.

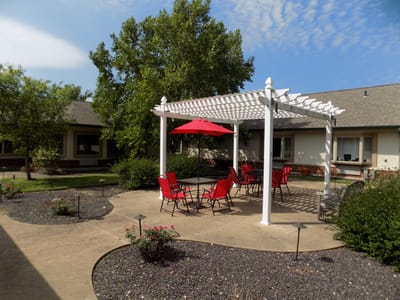
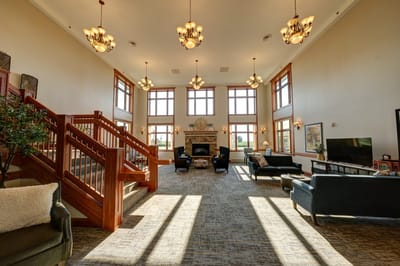
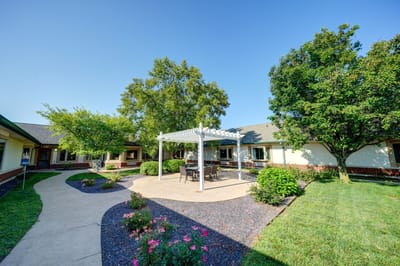
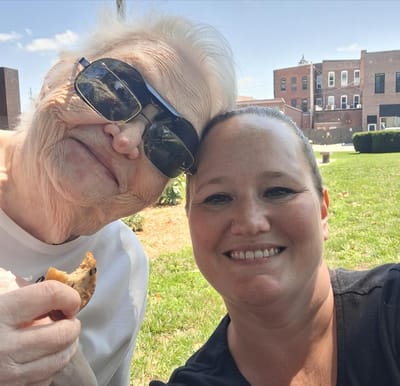
The community prides itself on a vibrant atmosphere that nurtures social connections and personal well-being. Residents can also enjoy an array of amenities, including delicious meals in a welcoming dining room and relaxing salon services at the on-site beauty/barber shop. With a dedicated team providing personalized care 24/7, Grand Prairie of Macomb creates a fulfilling lifestyle where seniors can truly feel at home.

(309) 833-5000

Quality ratings

Measured by Centers for Medicare & Medicaid Services (CMS)

Overall rating Info The Overall CMS Rating combines results from health inspections, staffing levels and quality measures. Health inspections carry the most weight. Staffing and quality scores can increase or decrease the final rating based on performance compared to state and national standards.
▼ 20.6% Below IL avg. ▼ 20.6% Below IL avg.Click the badge to see the full State ranking.Click here to see the full State ranking.
Health Inspection Info Based on the results of the facility's three most recent standard inspections and any complaint investigations. CMS reviews the number, scope, and severity of deficiencies, with more recent findings weighted more heavily.
▼ 28.0% Below IL avg. ▼ 28.0% Below IL avg.Click the badge to see the full State ranking.Click here to see the full State ranking.
Staffing Info Measures average nursing staff hours per resident per day, including Registered Nurses (RNs) and total nursing staff. Ratings are adjusted based on the level of care residents require and are compared to state and national benchmarks.
▼ 6.4% Below IL avg. ▼ 6.4% Below IL avg.Click the badge to see the full State ranking.Click here to see the full State ranking.
Quality Measures Info Based on clinical and physical health indicators reported to CMS, such as hospital readmissions, falls, pressure ulcers, and improvements in mobility. These measures reflect how well residents' health needs are being managed.
▼ 29.0% Below IL avg. ▼ 29.0% Below IL avg.Click the badge to see the full State ranking.Click here to see the full State ranking.

Staffing hours breakdown

Info Daily nursing hours per resident by staff type, reported to CMS. Higher is generally better — compare this facility to state and national averages to see where staffing stands.

Hours per resident per day — compared to Illinois state averages

Total nursing care / resident Info This home is ranked 89th out of 167 homes in Illinois. Total adjusted nursing hours per resident per day, combining RN, LPN, and aide time. CMS adjusts this for case-mix so facilities can be fairly compared.
2h 50m per day
Rank #89 / 167Nurse hours — State benchmarkedThis home is ranked 89th out of 167 homes in Illinois. Shows adjusted nurse hours per resident per day benchmarked to the Illinois average, with a ranking across 167 Illinois SNFs. More hours mean more direct care. The national average is about 3.5 hrs; below 3.0 is a red flag.Click the rank badge to see the full State ranking.Click here to see the full State ranking.
This facility Illinois avg (3h 6m per day)
vs Illinois avg
-8%
Staff typeHours / Day / Residentvs state avg
Weekend Total Nursing Info Combined nursing hours (RN + LPN + Nurse Aide) per resident per day on weekends. Staffing often drops on weekends — this figure reveals whether the facility maintains adequate coverage outside of weekday hours. 2h 47m per day

Types of Care at Grand Prairie of Macomb

Assisted Living

Capacity and availability

This home usually has availability

Occupancy lower than 85% suggests more openings may be available.

Lower occupancy than the Illinois average: 69.3%
Occupancy rate 60.3% Rank #154 / 199Occupancy rate — State benchmarkedThis home is ranked 154th out of 199 homes in Illinois. Shows this facility's occupancy rate versus the Illinois average, with its Statewide rank out of 199. Higher occupancy signals strong local demand and financial stability.Click the rank badge to see the full State ranking.Click here to see the full State ranking.
Avg. Length of Stay 133 days
Occupancy rate
60.3% Rank #154 / 199Occupancy rate — State benchmarkedThis home is ranked 154th out of 199 homes in Illinois. Shows this facility's occupancy rate versus the Illinois average, with its Statewide rank out of 199. Higher occupancy signals strong local demand and financial stability.Click the rank badge to see the full State ranking.Click here to see the full State ranking.
Avg. Length of Stay
133 days
Walk Score
Walk Score: 6 / 100 Rank #609 / 647Walk Score — State benchmarkedThis home is ranked 609th out of 647 homes in Illinois. Shows how walkable this facility's neighborhood is compared to the average Walk Score across Illinois SNFs. Higher scores benefit residents, families, and staff.Click the rank badge to see the full State ranking.Click here to see the full State ranking.
Car-dependent. Most errands require a car, with limited nearby walkable options.

About this community

Awards

Awards2021 Bronze Quality Awards, 2022-23 Best in Assisted Living, A Great Place to Work in 2024

License Details

Safety & Compliance

Wheelchair Accessible
Emergency SystemsYes

Payment & Insurance

1 service
Accept Medicaid

Therapy & Rehabilitation

1 service
Respite Care

Staffing & Medical

1 service
24-Hour Staffing

Additional Policies & Features

Minimum Age65
HousekeepingYes
Linen ServiceYes

Amenities & Lifestyle

Activity Room
Beauty/Barber Shop
Convenience Store
Dining Room
Exercise Room
Library
Patio
Television Lounge
Specific Programssupportive living program
Operating HoursMonday-Friday: 9am-5pm

Dining & Nutrition

Food DescriptionThree daily meals are included.

Contact Grand Prairie of Macomb

Staffing Data

Reporting period: October 1 – December 31, 2025 (Q4 2025). Source: CMS Payroll-Based Journal report.

Total staff 155
Employees 115
Contractors 40
Staff to resident ratio 1.48:1
18% worse than Illinois average
Illinois average ratio: 1.80:1 Illinois average ratio: 1.80:1See full Illinois ranking
Avg staff/day 61
Average shift 7.1 hours
7% worse than Illinois average
Illinois average: 7.6 hours Illinois average shift: 7.6 hoursSee full Illinois ranking
Total staff hours (quarter) 39,856

Nursing staff breakdown

Q4 2025 · Oct 1 – Dec 31 More info This data comes from the CMS Payroll-Based Journal report covering October 1 – December 31, 2025.
Registered Nurse

Manages medical care and health needs.

RN Staff 22
Average shift length Info Average shift length. Calculated as total hours divided by days worked and average staff per day. 7.2 hours

This role is partially covered by contractors.

Licensed Practical Nurse

Assists with medical care and medications.

LPN Staff 21
Average shift length Info Average shift length. Calculated as total hours divided by days worked and average staff per day. 8 hours

No contractors work on this role.

Certified Nursing Assistant

Helps with daily care and mobility.

CNA Staff 70
Average shift length Info Average shift length. Calculated as total hours divided by days worked and average staff per day. 6.9 hours

No contractors work on this role.

Contractor staffing

Q4 2025 · Oct 1 – Dec 31 More info This data comes from the CMS Payroll-Based Journal report covering October 1 – December 31, 2025.

Total hours from contractors

6.5%

2,577 contractor hours this quarter

Speech Language Pathologist: 9 Physical Therapy Aide: 7 Registered Nurse: 6 Respiratory Therapy Technician: 5 Physical Therapy Assistant: 5 Qualified Social Worker: 3 Clinical Nurse Specialist: 2 Occupational Therapy Aide: 1 Medical Director: 1 Occupational Therapy Assistant: 1

Staff by category

Q4 2025 · Oct 1 – Dec 31 More info This data comes from the CMS Payroll-Based Journal report covering October 1 – December 31, 2025.
Certified Nursing Assistant7007022,20792100%6.9
Licensed Practical Nurse210216,97792100%8
Registered Nurse166224,90392100%7.2
Other Dietary Services Staff3031,3199098%7.4
Diagnostic X-ray Services Staff2028946773%7.9
Physical Therapy Aide0776487885%6.9
Speech Language Pathologist0996008087%6
Dietitian1015126571%7.9
Nurse Practitioner1014886166%8
Administrator1014725964%8
Qualified Social Worker0332393740%6.5
Clinical Nurse Specialist0222082325%8
Respiratory Therapy Technician0551464246%3.4
Physical Therapy Assistant0551234246%2.9
Occupational Therapy Aide011601617%3.8
Occupational Therapy Assistant01148910%5.3
Medical Director0111344%3.3
70 Certified Nursing Assistant
% of Days 100%
21 Licensed Practical Nurse
% of Days 100%
22 Registered Nurse
% of Days 100%
3 Other Dietary Services Staff
% of Days 98%
2 Diagnostic X-ray Services Staff
% of Days 73%
7 Physical Therapy Aide
% of Days 85%
9 Speech Language Pathologist
% of Days 87%
1 Dietitian
% of Days 71%
1 Nurse Practitioner
% of Days 66%
1 Administrator
% of Days 64%
3 Qualified Social Worker
% of Days 40%
2 Clinical Nurse Specialist
% of Days 25%
5 Respiratory Therapy Technician
% of Days 46%
5 Physical Therapy Assistant
% of Days 46%
1 Occupational Therapy Aide
% of Days 17%
1 Occupational Therapy Assistant
% of Days 10%
1 Medical Director
% of Days 4%

Penalties and fines

Includes penalties issued in 2023-2025

Federal penalties imposed by CMS for regulatory violations, including civil money penalties (fines) and denials of payment for new Medicare/Medicaid admissions.

Source: CMS Penalties Database (Data as of Jan 2026)

Total fines amount $159K Rank #137 / 168Federal fines — State benchmarkedThis home is ranked 137th out of 168 homes in Illinois. Shows this facility's cumulative CMS federal fine dollars versus the Illinois average among facilities with fines, and where it ranks among 168 skilled nursing facilities in the pool. Lower total dollars mean a better rank.Click the rank badge to see the full State ranking.Click here to see the full State ranking.
11% higher than Illinois average

Illinois average: $143K

Number of fines 5
69% more fines than Illinois average

Illinois average: 3.0

Payment Denials Info Serious action where Medicare and/or Medicaid temporarily stops payments for new residents until issues are fixed. 1
6% fewer payment denials than Illinois average

Illinois average: 1.1

Fines amount comparison
This facility $159K
Illinois average $143K
Penalty History

Penalties are imposed by CMS for violations of federal nursing home regulations.

5 penalties in the past 3 years

Multiple penalties were reported in the last 3 years.

Civil Money Penalty Info Fines imposed for noncompliance, which can be assessed per day or per instance of violation. Feb 27, 2025
$31K
Civil Money Penalty Info Fines imposed for noncompliance, which can be assessed per day or per instance of violation. Oct 24, 2024
$82K
Payment Denial Info Serious action where Medicare and/or Medicaid temporarily stops payments for new residents until issues are fixed. Oct 24, 2024
82 days
Civil Money Penalty Info Fines imposed for noncompliance, which can be assessed per day or per instance of violation. Feb 6, 2024
$3K

Last updated: Jan 2026

Quality of care over time

These measures show how residents usually do over time at this home, based on health outcomes and preventive care.

High-risk clinical events score Info A composite score based on pressure ulcers, falls with injury, weight loss, walking ability decline, and activities of daily living decline. 7.2
26% better than Illinois average

Illinois average: 9.7

Functional decline score Info A composite score based on activities of daily living decline, walking ability decline, and incontinence. 15.7
16% better than Illinois average

Illinois average: 18.6

Long-stay resident measures
Need for Help with Daily Activities Increased Info Percent of long-stay residents whose need for help with daily activities has increased 11.3%
27% better than Illinois average

Illinois average: 15.5%

Walking Ability Worsened Info Percent of long-stay residents whose ability to move independently worsened 7.8%
58% better than Illinois average

Illinois average: 18.4%

Low Risk Residents with Bowel/Bladder Incontinence Info Percent of low risk long-stay residents who lose control of their bowels or bladder 27.9%
29% worse than Illinois average

Illinois average: 21.6%

Falls with Major Injury Info Percent of long-stay residents experiencing one or more falls with major injury 2.7%
19% better than Illinois average

Illinois average: 3.4%

High Risk Residents with Pressure Ulcers Info Percent of long-stay high risk residents with pressure ulcers 6.1%
16% worse than Illinois average

Illinois average: 5.3%

Urinary Tract Infection Info Percent of long-stay residents with a urinary tract infection 0.8%
58% better than Illinois average

Illinois average: 1.8%

Lost Too Much Weight Info Percent of long-stay residents who lose too much weight 8.2%
25% worse than Illinois average

Illinois average: 6.5%

Depressive Symptoms Info Percent of long-stay residents who have depressive symptoms 90.9%
89% worse than Illinois average

Illinois average: 48.1%

Antipsychotic Use Info Percent of long-stay residents who received an antipsychotic medication 21.3%
5% worse than Illinois average

Illinois average: 20.2%

Pneumococcal Vaccine Info Percent of long-stay residents assessed and appropriately given the pneumococcal vaccine 75.7%
15% worse than Illinois average

Illinois average: 89.2%

Influenza Vaccine Info Percent of long-stay residents assessed and appropriately given the seasonal influenza vaccine 81.4%
11% worse than Illinois average

Illinois average: 91.6%

Short-stay resident measures
Pneumococcal Vaccine Info Percent of short-stay residents assessed and appropriately given the pneumococcal vaccine 21.5%
68% worse than Illinois average

Illinois average: 68.3%

Antipsychotic medication increase Info Percent of short-stay residents who newly received an antipsychotic medication 1.5%
38% better than Illinois average

Illinois average: 2.3%

Influenza Vaccine Info Percent of short-stay residents assessed and appropriately given the seasonal influenza vaccine 22.2%
65% worse than Illinois average

Illinois average: 63.0%

Breakdown by payment type

Medicare

20% of new residents, usually for short-term rehab.

Typical stay 1 - 2 months

Private pay

76% of new residents, often for short stays.

Typical stay 4 - 5 months

Medicaid

4% of new residents, often for long-term daily care.

Typical stay 8 - 9 months

Facility Characteristics

Source: CMS Long-Term Care Facility Characteristics (Data as of Jan 2026)

Total residents 105
Medicare
2
1.9% of residents
Medicaid
101
96.2% of residents
Private pay or other
2
1.9% of residents
Programs & Services
Residents Group

Residents meet regularly to discuss policies, care quality, and activities

Active Resident Council

Organized group of residents that meets regularly to discuss facility policies, quality of life, and activities.

Finances and operations

Privately-owned community
Home revenue
$8.0M
Operating loss
-$1.4M
Privately-owned community
Home revenue
$8.0M Rank #142 / 166Revenue — State benchmarkedThis home is ranked 142nd out of 166 homes in Illinois. Shows this facility's annual revenue compared to the Illinois SNF average. Higher revenue generally means more resources for staffing and capital — read alongside Payroll %.Click the rank badge to see the full State ranking.Click here to see the full State ranking.
Operating loss
-$1.4M
Payroll costs Info The portion of the home's budget spent on staff, including nurses, caregivers, and other employees who support care and operations. Rank #134 / 166Payroll — State benchmarkedThis home is ranked 134th out of 166 homes in Illinois. Shows total annual staff payroll benchmarked to the Illinois average. Higher payroll investment relative to peers often signals better staffing and less reliance on cheaper contract labor.Click the rank badge to see the full State ranking.Click here to see the full State ranking.
$5.0M
62.5% of revenue Rank #26 / 166Payroll % — State benchmarkedThis home is ranked 26th out of 166 homes in Illinois. Shows payroll as a percentage of revenue versus the Illinois average. Well-run Illinois SNFs typically land around 54–67% — the top third Statewide. Below 25% may signal understaffing or heavy agency use — read with Staffing ratings.Click the rank badge to see the full State ranking.Click here to see the full State ranking.
Other operating costs Info All remaining costs needed to run the home, such as food, utilities, building maintenance, supplies and administrative expenses.
$4.4M
Total costs $9.4M

What does this home offer?

Total residents icon

Total Residents: 82 Residents

Housing options icon

Housing Options: Studio / 1 Bed

Building type icon
Building type icon

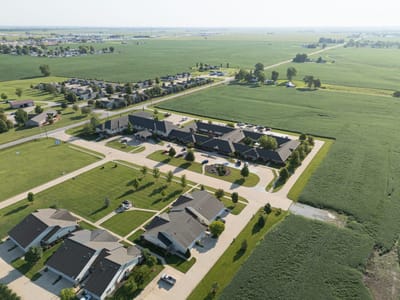
Building Type: Single-story

Transportation services icon

Transportation Services

Fitness and recreation icon

Fitness and Recreation

Movie Theater icon

Movie Theater

Parking Available icon

Parking Available

Who this home usually serves

TYPE OF STAY

Primarily short stays

Residents typically stay for brief periods, with frequent admissions and discharges throughout the year.

Places of interest near Grand Prairie of Macomb

Address 1.8 miles from city center Info Estimated distance in miles from Macomb's city center to Grand Prairie of Macomb's address, calculated via Google Maps.

Calculate Travel Distance to Grand Prairie of Macomb

Add your location

Address

Financial Assistance for
Nursing Home in Illinois

Grand Prairie of Macomb is located in Macomb, Illinois.
Here are the financial assistance programs available to residents in Illinois.

Get Financial aid guidance

Community Care Program

Illinois CCP

Age 60+
General Illinois resident, at risk of nursing home placement.
Income Limits (2025) ~$1,215/month individual
Asset Limits $17,500 individual, excludes home, car
IL

High demand in urban areas; waitlists possible.

Benefits
In-home care (3-5 hours/day) Adult day services ($65/day) Emergency home response systems ($30/month)

Illinois Respite Program

IL Respite (via NFCSP)

Age Caregiver of someone 60+ (or with dementia)
General Illinois resident.
Income Limits No strict limit; prioritizes low-income.
Asset Limits Not applicable.
IL

Limited slots; urban/rural balance.

Benefits
In-home respite (4-6 hours/day) Adult day care (~$65/day) Short-term facility care (up to 5 days)

Supportive Living Program (SLP)

Illinois Medicaid Supportive Living Program

Age 65+ or 22-64 with disability
General Illinois resident, Medicaid-eligible, needs moderate assistance (not nursing home-level).
Income Limits (2025) ~$2,829/month (300% FBR, individual); QIT allowed.
Asset Limits $2,000 (individual), $3,000 (couple) (excludes home, car).
IL

~200 SLP sites statewide; room/board not covered.

Benefits
Personal care (5-7 hours/day, e.g., bathing, mobility) Meals Housekeeping Medication management Respite (~240 hours/year)

Persons Who Are Elderly Waiver

Illinois Medicaid Elderly Waiver

Age 65+
General Illinois resident, Medicaid-eligible, nursing home-level care need.
Income Limits (2025) ~$2,829/month 300% FBR, individual
Asset Limits $2,000 (individual), $3,000 (couple).
IL

Part of HealthChoice Illinois; consumer-directed options available.

Benefits
Personal care (5-7 hours/day, e.g., dressing, eating) Homemaker Adult day care (~$60/day) Respite (240 hours/year) Home mods ($1,000 avg.)

Medicare Savings Program (MSP)

Illinois Medicare Savings Program

Age 65+ or disabled
General Illinois resident, Medicare Part A/B.
Income Limits (2025) ~$2,510/month (QMB), ~$3,380/month (SLMB), ~$3,598/month (QI)—individual.
Asset Limits $9,430 (individual), $14,130 (couple).
IL

Three tiers; no waitlist.

Benefits
Covers Part B premiums ($174.70/month) Deductibles ($240/year) Copays (~20%)

Optional State Supplementation (OSS)

Illinois Optional State Supplementation

Age 65+ or disabled
General Illinois resident, in approved facility, SSI recipient or low-income.
Income Limits (2025) ~$1,004/month including SSI
Asset Limits $2,000 (individual), $3,000 (couple).
IL

~$50-$500/month based on facility type.

Benefits
Cash (~$50-$500/month) for room/board in personal care homes or SLFs

VA Aid and Attendance (A&A) and Housebound Benefits

Illinois VA Aid and Attendance/Housebound

Age 65+ or disabled veteran/spouse
General Illinois resident, wartime service, need for ADL help (A&A) or homebound.
Income Limits (2025) Net income < ~$1,984/month (veteran with dependent, A&A); pension offsets income.
Asset Limits ~$155,356 net worth limit
IL

High veteran demand in urban/rural areas.

Benefits
Cash (~$1,433-$2,642/month veteran, ~$951-$1,318 spouse) for care costs (e.g., in-home, assisted living)

Frequently Asked Questions about Grand Prairie of Macomb

Is Grand Prairie of Macomb in a walkable area?

Grand Prairie of Macomb has a walk score of 6. Car-dependent. Most errands require a car, with limited nearby walkable options.

Are there photos of Grand Prairie of Macomb?

Yes — there are 9 photos of Grand Prairie of Macomb in the photo gallery on this page.

What is the address of Grand Prairie of Macomb?

Grand Prairie of Macomb is located at 1307 Meadowlark Ln, Macomb, IL 61455, United States.

What is the phone number of Grand Prairie of Macomb?

(309) 833-5000 will put you in contact with the team at Grand Prairie of Macomb.

Is Grand Prairie of Macomb Medicare or Medicaid certified?

Yes — Grand Prairie of Macomb is a CMS-certified provider of Medicare and Medicaid.

Guides for Better Senior Living

Care Cost Calculator: See Prices in Your Area

Nursing Home Data Explorer

Don’t Wait Too Long: 7 Red Flag Signs Your Parent Needs Assisted Living Now

The True Cost of Assisted Living in 2025 – And How Families Are Paying For It

Understanding Senior Living Costs: Pricing Models, Discounts & Financial Assistance

Explore Open Rooms
1 Contact details
2 What type of senior care service are you looking for?
3 What budget do you have in mind for senior care?
4 How soon do you need to find care?
5 Additional details

Thank you for your interest!

Our team will be in touch shortly to help with next steps.