Wesley Village Retirement Center

Independent Living in Macomb

CMS overall rating Info The Overall CMS Rating is scored from 1 to 5 stars and combines results from health inspections, staffing levels, and quality measures. Health inspections carry the most weight. Staffing and quality scores can increase or decrease the final rating based on performance compared to state and national standards.

Overview of Wesley Village Retirement Center

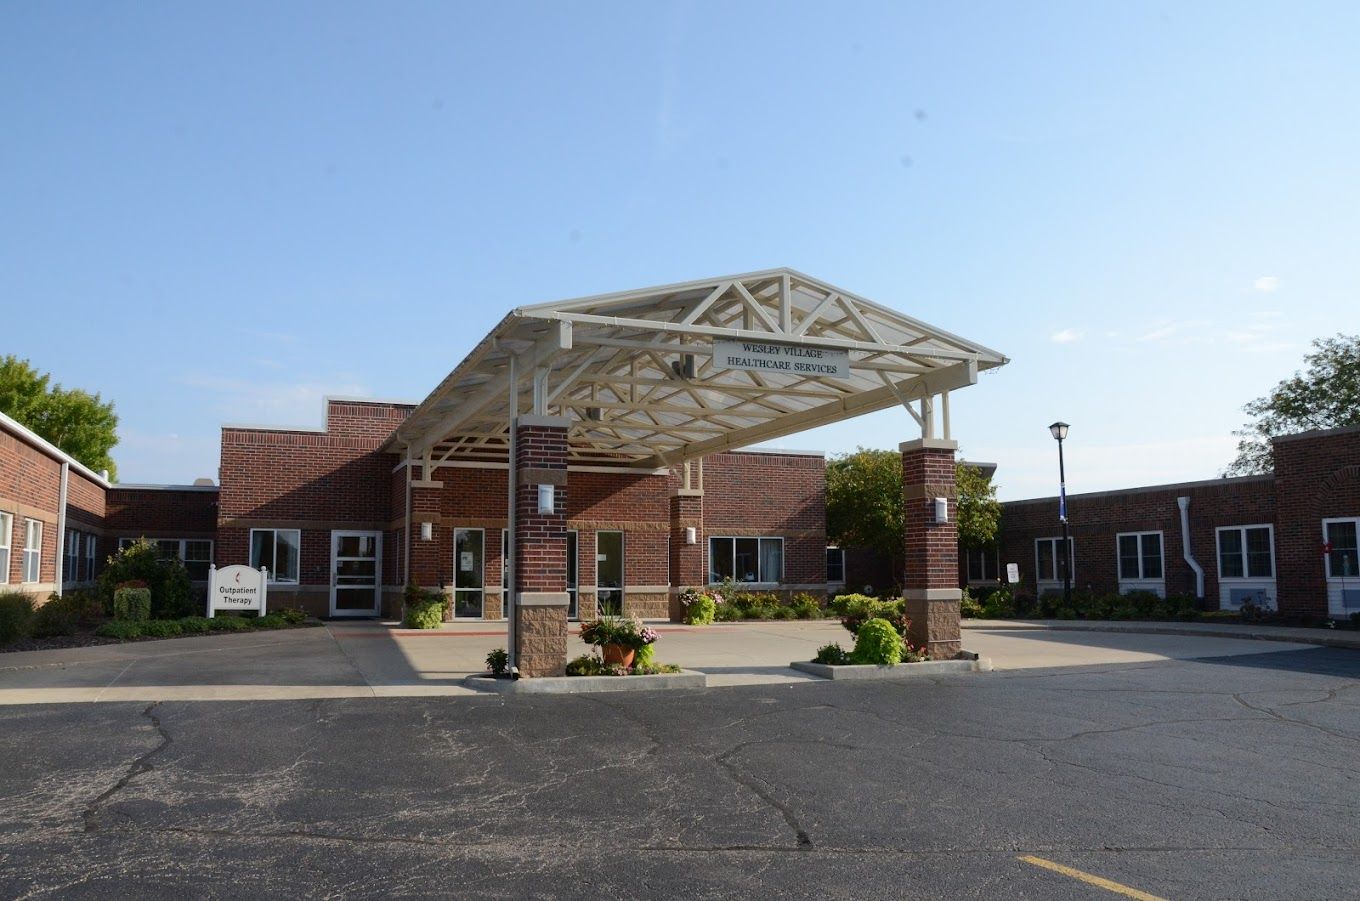
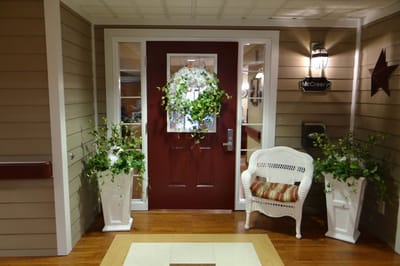
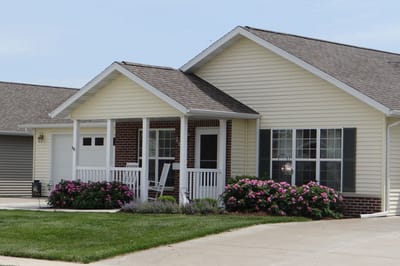
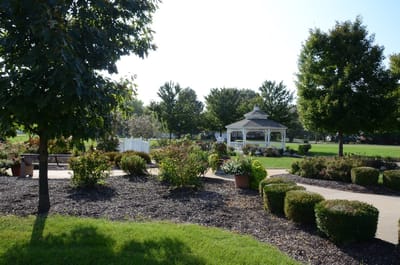
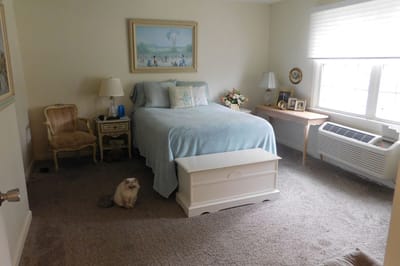
Nestled in the heart of Macomb, IL, Wesley Village Retirement Center offers a warm and vibrant community for seniors, encompassing independent living, memory care, skilled nursing, short-term rehabilitation, and specialized care services. As the area’s only continuing care retirement community, the community provides a range of accommodations designed to meet evolving needs, with spacious independent homes and apartments that foster independence and comfort.

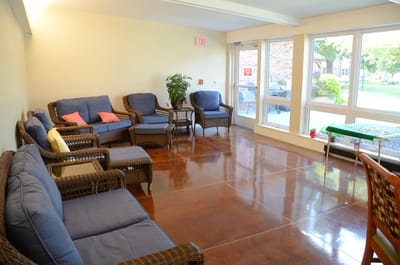
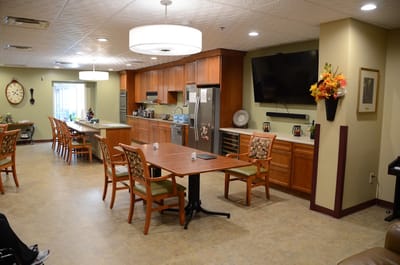
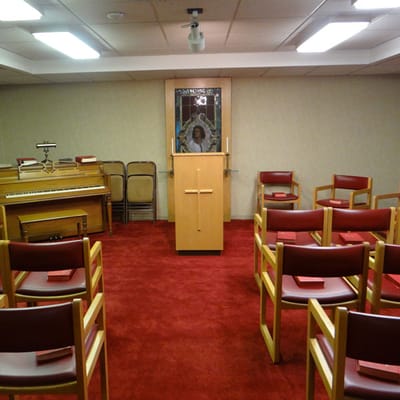
With a commitment to enhancing residents’ lives, the community prides itself on offering engaging amenities and services, such as a community center perfect for social gatherings and a welcoming dining area for shared meals. A robust lineup of activities encourages active, meaningful lifestyles, from group exercise to Bible study and entertainment. Wesley Village is dedicated to a mission of compassionate care, fostering a homelike atmosphere where residents can enjoy life fully and worry-free.

Quality ratings

Measured by Centers for Medicare & Medicaid Services (CMS)

Overall rating Info The Overall CMS Rating combines results from health inspections, staffing levels and quality measures. Health inspections carry the most weight. Staffing and quality scores can increase or decrease the final rating based on performance compared to state and national standards.
4/5 ▲ 1.5 Illinois average: 2.5/5
Health Inspection Info Based on the results of the facility's three most recent standard inspections and any complaint investigations. CMS reviews the number, scope, and severity of deficiencies, with more recent findings weighted more heavily.
4/5 ▲ 1.2 Illinois average: 2.8/5
Staffing Info Measures average nursing staff hours per resident per day, including Registered Nurses (RNs) and total nursing staff. Ratings are adjusted based on the level of care residents require and are compared to state and national benchmarks.
4/5 ▲ 1.9 Illinois average: 2.1/5
Quality Measures Info Based on clinical and physical health indicators reported to CMS, such as hospital readmissions, falls, pressure ulcers, and improvements in mobility. These measures reflect how well residents' health needs are being managed.
3/5 ▲ 0.2 Illinois average: 2.8/5

Staffing hours breakdown

Info Daily nursing hours per resident by staff type, reported to CMS. Higher is generally better — compare this facility to state and national averages to see where staffing stands.

Hours per resident per day — compared to Illinois state averages

Total nursing care / resident Info This home is ranked 15th out of 128 homes in Illinois.

Total adjusted nursing hours per resident per day, combining RN, LPN, and aide time. CMS adjusts this for case-mix so facilities can be fairly compared.
5h 18m per day
Rank #15 / 128Nurse hours — state benchmarkedThis home is ranked 15th out of 128 homes in Illinois.Shows adjusted nurse hours per resident per day benchmarked to the Illinois average, with a ranking across 128 Illinois SNFs. More hours mean more direct care. The national average is about 3.5 hrs; below 3.0 is a red flag.
This facility Illinois avg (3h 6m per day)
vs Illinois avg
+71%
Staff typeHours / dayvs state avg
Total Nursing (Weekend) Info Combined nursing hours (RN + LPN + Nurse Aide) per resident per day on weekends. Staffing often drops on weekends — this figure reveals whether the facility maintains adequate coverage outside of weekday hours. 3h 59m per day

Capacity and availability

This home usually has availability

Occupancy lower than 85% suggests more openings may be available.

Lower occupancy than the Illinois average: 69.3%
Occupancy rate 65.9% Rank #91 / 128Occupancy rate — state benchmarkedThis home is ranked 91st out of 128 homes in Illinois.Shows this facility's occupancy rate versus the Illinois average, with its statewide rank out of 128. Higher occupancy signals strong local demand and financial stability.
Avg. Length of Stay 115 days
Occupancy rate
65.9% Rank #91 / 128Occupancy rate — state benchmarkedThis home is ranked 91st out of 128 homes in Illinois.Shows this facility's occupancy rate versus the Illinois average, with its statewide rank out of 128. Higher occupancy signals strong local demand and financial stability.
Avg. Length of Stay
115 days

Who this home usually serves

TYPE OF STAY

Mix of rehab and long-term care

This home supports both short-term rehab and long-term care, with residents staying for a wide range of durations.

Breakdown by payment type

Medicare

34% of new residents, usually for short-term rehab.

Typical stay 1 - 2 months

Private pay

58% of new residents, often for short stays.

Typical stay 3 - 4 months

Medicaid

9% of new residents, often for long-term daily care.

Typical stay 1 - 2 years

Finances and operations

Voluntary non-profit community
Operated by a church.
Home revenue
$10.9M
Surplus of revenue
$710.4K
Voluntary non-profit community Operated by a church.
Home revenue
$10.9M Rank #118 / 126Revenue — state benchmarkedThis home is ranked 118th out of 126 homes in Illinois.Shows this facility's annual revenue compared to the Illinois SNF average. Higher revenue generally means more resources for staffing and capital — read alongside Payroll %.
Surplus of revenue
$710.4K
Payroll costs Info The portion of the home's budget spent on staff, including nurses, caregivers, and other employees who support care and operations. Rank #83 / 126Payroll — state benchmarkedThis home is ranked 83rd out of 126 homes in Illinois.Shows total annual staff payroll benchmarked to the Illinois average. Higher payroll investment relative to peers often signals better staffing and less reliance on cheaper contract labor.
$5.1M
46.5% of revenue Rank #8 / 126Payroll % — state benchmarkedThis home is ranked 8th out of 126 homes in Illinois.Shows payroll as a percentage of revenue versus the Illinois average. Well-run SNFs often land around 55–65%. Below 25% may signal understaffing or heavy agency use — read with Staffing ratings.
Other operating costs Info All remaining costs needed to run the home, such as food, utilities, building maintenance, supplies and administrative expenses.
$5.1M
Total costs $10.2M
Walk Score
Walk Score: 5 / 100 Rank #96 / 99Walk Score — state benchmarkedThis home is ranked 96th out of 99 homes in Illinois.Shows how walkable this facility's neighborhood is compared to the average Walk Score across Illinois SNFs. Higher scores benefit residents, families, and staff.
Car-dependent. Most errands require a car, with limited nearby walkable options.

About this community

Therapy & Rehabilitation

3 services
Rehabilitation Services
Respite Care
Short-Term Rehab

Staffing & Medical

1 service
Licensed Nurses/CNAs

Additional Services

1 service
Short Term Rehabilitation

Amenities & Lifestyle

Specific ProgramsWesley Estates, Independent Living Apartments, Judy’s Suites – Assisted Living, Health Care Center, Dining at Wesley Village, Activities
Religious ServicesYes
Volunteer ProgramsYes
Operating HoursMonday: 8:00 AM – 5:00 PM, Tuesday: 8:00 AM – 5:00 PM, Wednesday: 8:00 AM – 5:00 PM, Thursday: 8:00 AM – 5:00 PM, Friday: 8:00 AM – 5:00 PM, Saturday: 9:00 AM – 2:00 PM, Sunday: 10:00 AM – 2:00 PM

What does this home offer?

Total residents icon

Total Residents: 200 Residents

Building type icon
Building type icon

Building Type: Single-story

Fitness and recreation icon

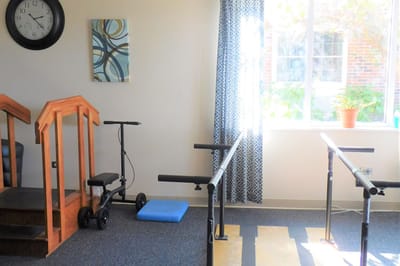
Fitness and Recreation

Types of Care at Wesley Village Retirement Center

Independent Living

Contact Wesley Village Retirement Center

Health Inspection History

Inspections
Total health inspections 4

Illinois average 10.4


Last Health inspection on Feb 2025

Total health citations
8 Rank #8 / 127Health citations — state benchmarkedThis home is ranked 8th out of 127 homes in Illinois.Shows this facility's total health deficiency citations benchmarked to the Illinois state average, with a ranking across all 127 IL SNFs. Lower citation counts earn a better rank.

Illinois average 36.8

Citations per inspection
2

Illinois average 3.68


Health citations are formal notices following inspections when they fail to comply with safety and care standards.

7 of 8 citations resulted from standard inspections; and 1 of 8 resulted from complaint investigations.

Breakdown of citation severity (last 3 years)
Critical Health citations More info
0
100% better than Illinois average

Illinois average: 0.7


Serious Health citations More info 0
100% better than Illinois average

Illinois average: 3.6

0 critical citations More info Illinois average: 0.7

0 serious citations More info Illinois average: 3.6

8 moderate citations More info Illinois average: 32

0 minor citations More info Illinois average: 0.5
Citations history (last 3 years)
Administration moderate citation Info Issues related to how the facility is managed, including policies, procedures, and compliance with regulations. Feb 20, 2025
Corrected

Infection Control moderate citation Info Issues related to preventing and controlling infections, including hygiene practices and safety protocols. Feb 20, 2025
Corrected

Nutrition moderate citation Info Issues related to food quality, meal service, and resident's nutritional needs. Feb 20, 2025
Corrected

Pharmacy moderate citation Info Issues related to medication management, including how drugs are stored, administered, and monitored. Feb 20, 2025
Corrected

Compare Independent Living around Macomb The information below is reported by the Illinois Department of Public Health, Office of Health Care Regulation.

Filter by care type
Wesley Village Retirement Center
AL

Assisted Living A licensed, long-term care setting for seniors or individuals with disabilities who need help with daily activities — like bathing, dressing, and medication management — but not 24-hour skilled nursing. Offers housing, meals, and around-the-clock support while aiming to maximize resident independence.

IL

Independent Living Lifestyle-focused communities for older adults offering dining, activities, and transportation with minimal personal care. Best for active, independent seniors who want community without medical support.

MC

Memory Care Secured, specialized care for people living with Alzheimer's or dementia. Staff trained in cognitive impairment, with higher staff-to-resident ratios and an environment designed to reduce confusion and wandering risk.

NH

Nursing Home Licensed facility providing 24/7 skilled nursing care for residents with complex, ongoing medical needs. Staffed by RNs, LPNs, and CNAs. Inspected and star-rated annually by CMS. Accepts Medicare (short-term rehab) and Medicaid (long-term care).

Macomb73No 5 --

Financial Assistance for
Independent Living in Illinois

Get Financial aid guidance

Community Care Program

Illinois CCP

Age 60+
General Illinois resident, at risk of nursing home placement.
Income Limits (2025) ~$1,215/month individual
Asset Limits $17,500 individual, excludes home, car
IL

High demand in urban areas; waitlists possible.

Benefits
In-home care (3-5 hours/day) Adult day services ($65/day) Emergency home response systems ($30/month)

Illinois Respite Program

IL Respite (via NFCSP)

Age Caregiver of someone 60+ (or with dementia)
General Illinois resident.
Income Limits No strict limit; prioritizes low-income.
Asset Limits Not applicable.
IL

Limited slots; urban/rural balance.

Benefits
In-home respite (4-6 hours/day) Adult day care (~$65/day) Short-term facility care (up to 5 days)

Supportive Living Program (SLP)

Illinois Medicaid Supportive Living Program

Age 65+ or 22-64 with disability
General Illinois resident, Medicaid-eligible, needs moderate assistance (not nursing home-level).
Income Limits (2025) ~$2,829/month (300% FBR, individual); QIT allowed.
Asset Limits $2,000 (individual), $3,000 (couple) (excludes home, car).
IL

~200 SLP sites statewide; room/board not covered.

Benefits
Personal care (5-7 hours/day, e.g., bathing, mobility) Meals Housekeeping Medication management Respite (~240 hours/year)

Persons Who Are Elderly Waiver

Illinois Medicaid Elderly Waiver

Age 65+
General Illinois resident, Medicaid-eligible, nursing home-level care need.
Income Limits (2025) ~$2,829/month 300% FBR, individual
Asset Limits $2,000 (individual), $3,000 (couple).
IL

Part of HealthChoice Illinois; consumer-directed options available.

Benefits
Personal care (5-7 hours/day, e.g., dressing, eating) Homemaker Adult day care (~$60/day) Respite (240 hours/year) Home mods ($1,000 avg.)

Medicare Savings Program (MSP)

Illinois Medicare Savings Program

Age 65+ or disabled
General Illinois resident, Medicare Part A/B.
Income Limits (2025) ~$2,510/month (QMB), ~$3,380/month (SLMB), ~$3,598/month (QI)—individual.
Asset Limits $9,430 (individual), $14,130 (couple).
IL

Three tiers; no waitlist.

Benefits
Covers Part B premiums ($174.70/month) Deductibles ($240/year) Copays (~20%)

Senior Community Service Employment Program (SCSEP)

Illinois SCSEP

Age 55+
General unemployed, low-income, Illinois resident.
Income Limits (2025) ~$1,983/month 125% FPL
Asset Limits Not specified; income-focused.
IL

Priority for veterans, rural residents.

Benefits
Paid training (~20 hours/week at ~$7.25/hour) Job placement

Optional State Supplementation (OSS)

Illinois Optional State Supplementation

Age 65+ or disabled
General Illinois resident, in approved facility, SSI recipient or low-income.
Income Limits (2025) ~$1,004/month including SSI
Asset Limits $2,000 (individual), $3,000 (couple).
IL

~$50-$500/month based on facility type.

Benefits
Cash (~$50-$500/month) for room/board in personal care homes or SLFs

VA Aid and Attendance (A&A) and Housebound Benefits

Illinois VA Aid and Attendance/Housebound

Age 65+ or disabled veteran/spouse
General Illinois resident, wartime service, need for ADL help (A&A) or homebound.
Income Limits (2025) Net income < ~$1,984/month (veteran with dependent, A&A); pension offsets income.
Asset Limits ~$155,356 net worth limit
IL

High veteran demand in urban/rural areas.

Benefits
Cash (~$1,433-$2,642/month veteran, ~$951-$1,318 spouse) for care costs (e.g., in-home, assisted living)

Places of interest near Wesley Village Retirement Center

Address 1.8 miles from city center Info Estimated distance in miles from Macomb's city center to Wesley Village Retirement Center's address, calculated via Google Maps.

Calculate Travel Distance to Wesley Village Retirement Center

Add your location

Address

Staffing Data (Q2 2025)

This data corresponds to Q2 2025 and is based on CMS Payroll-Based Journal.

Total staff 91
Employees 72
Contractors 19
Staff to resident ratio 1.90:1
0% compared with Illinois average

Illinois average ratio: 1.90:1

Avg staff/day 34
Average shift 7.7 hours
0% compared with Illinois average

Illinois average: 7.6 hours

Total staff hours (quarter) 23,666
Nursing staff breakdown
Registered Nurse

Manages medical care and health needs.

Total count 14
Average shift length Info Average shift length. Calculated as total hours divided by days worked and average staff per day. 9.4 hours

This role is partially covered by contractors.

Licensed Practical Nurse

Assists with medical care and medications.

Total count 5
Average shift length Info Average shift length. Calculated as total hours divided by days worked and average staff per day. 11.1 hours

No contractors work on this role.

Certified Nursing Assistant

Helps with daily care and mobility.

Total count 48
Average shift length Info Average shift length. Calculated as total hours divided by days worked and average staff per day. 7.8 hours

No contractors work on this role.

Contractor staffing

Total hours from contractors

4.1%

972 contractor hours this quarter

Registered Nurse: 4 Physical Therapy Aide: 4 Physical Therapy Assistant: 3 Qualified Social Worker: 2 Respiratory Therapy Technician: 1 Speech Language Pathologist: 1 Occupational Therapy Aide: 1 Occupational Therapy Assistant: 1 Mental Health Service Worker: 1 Medical Director: 1
Staff by category
Certified Nursing Assistant4804814,27591100%7.8
Registered Nurse104142,68391100%9.4
Licensed Practical Nurse5052,12991100%11.1
Clinical Nurse Specialist3031,2287582%8.2
Other Dietary Services Staff3039757582%7.3
Administrator1015105156%10
RN Director of Nursing1015035763%8.8
Nurse Practitioner1014544651%9.9
Physical Therapy Aide0442526673%3
Speech Language Pathologist0112176167%3.6
Respiratory Therapy Technician0111766268%2.8
Physical Therapy Assistant0331645662%2.8
Occupational Therapy Aide011441314%3.4
Qualified Social Worker022252022%1.3
Occupational Therapy Assistant0111533%5
Mental Health Service Worker011933%3
Medical Director011744%1.8
48 Certified Nursing Assistant
% of Days 100%
14 Registered Nurse
% of Days 100%
5 Licensed Practical Nurse
% of Days 100%
3 Clinical Nurse Specialist
% of Days 82%
3 Other Dietary Services Staff
% of Days 82%
1 Administrator
% of Days 56%
1 RN Director of Nursing
% of Days 63%
1 Nurse Practitioner
% of Days 51%
4 Physical Therapy Aide
% of Days 73%
1 Speech Language Pathologist
% of Days 67%
1 Respiratory Therapy Technician
% of Days 68%
3 Physical Therapy Assistant
% of Days 62%
1 Occupational Therapy Aide
% of Days 14%
2 Qualified Social Worker
% of Days 22%
1 Occupational Therapy Assistant
% of Days 3%
1 Mental Health Service Worker
% of Days 3%
1 Medical Director
% of Days 4%

Facility Characteristics

Source: CMS Long-Term Care Facility Characteristics (Data as of Jan 2026)

Total residents 48
Medicare
5
10.4% of residents
Medicaid
17
35.4% of residents
Private pay or other
26
54.2% of residents
Programs & Services
Residents Group

Residents meet regularly to discuss policies, care quality, and activities

CCRC

Part of a Continuing Care Retirement Community offering multiple care levels

Active Resident Council

Organized group of residents that meets regularly to discuss facility policies, quality of life, and activities.

Quality of care over time

These measures show how residents usually do over time at this home, based on health outcomes and preventive care.

High-risk clinical events score Info A composite score based on pressure ulcers, falls with injury, weight loss, walking ability decline, and activities of daily living decline. 9.4
In line with Illinois average

Illinois average: 9.7

Functional decline score Info A composite score based on activities of daily living decline, walking ability decline, and incontinence. 18.0
In line with Illinois average

Illinois average: 18.6

Long-stay resident measures
Need for Help with Daily Activities Increased Info Percent of long-stay residents whose need for help with daily activities has increased 12.2%
21% better than Illinois average

Illinois average: 15.5%

Walking Ability Worsened Info Percent of long-stay residents whose ability to move independently worsened 11.4%
38% better than Illinois average

Illinois average: 18.4%

Low Risk Residents with Bowel/Bladder Incontinence Info Percent of low risk long-stay residents who lose control of their bowels or bladder 30.4%
41% worse than Illinois average

Illinois average: 21.6%

Falls with Major Injury Info Percent of long-stay residents experiencing one or more falls with major injury 5.7%
68% worse than Illinois average

Illinois average: 3.4%

High Risk Residents with Pressure Ulcers Info Percent of long-stay high risk residents with pressure ulcers 2.7%
48% better than Illinois average

Illinois average: 5.3%

Urinary Tract Infection Info Percent of long-stay residents with a urinary tract infection 2.3%
29% worse than Illinois average

Illinois average: 1.8%

Lost Too Much Weight Info Percent of long-stay residents who lose too much weight 15.1%
131% worse than Illinois average

Illinois average: 6.5%

Depressive Symptoms Info Percent of long-stay residents who have depressive symptoms 9.2%
81% better than Illinois average

Illinois average: 48.1%

Antipsychotic Use Info Percent of long-stay residents who received an antipsychotic medication 5.1%
75% better than Illinois average

Illinois average: 20.2%

Pneumococcal Vaccine Info Percent of long-stay residents assessed and appropriately given the pneumococcal vaccine 98.3%
10% better than Illinois average

Illinois average: 89.2%

Influenza Vaccine Info Percent of long-stay residents assessed and appropriately given the seasonal influenza vaccine 100.0%
9% better than Illinois average

Illinois average: 91.6%

Short-stay resident measures
Pneumococcal Vaccine Info Percent of short-stay residents assessed and appropriately given the pneumococcal vaccine 91.3%
34% better than Illinois average

Illinois average: 68.3%

Antipsychotic medication increase Info Percent of short-stay residents who newly received an antipsychotic medication 0.0%
100% better than Illinois average

Illinois average: 2.3%

Influenza Vaccine Info Percent of short-stay residents assessed and appropriately given the seasonal influenza vaccine 93.8%
49% better than Illinois average

Illinois average: 63.0%

Guides for Better Senior Living

Care Cost Calculator: See Prices in Your Area

Nursing Home Data Explorer

Don’t Wait Too Long: 7 Red Flag Signs Your Parent Needs Assisted Living Now

The True Cost of Assisted Living in 2025 – And How Families Are Paying For It

Understanding Senior Living Costs: Pricing Models, Discounts & Financial Assistance

Explore Open Rooms
1 Contact details
2 What type of senior care service are you looking for?
3 What budget do you have in mind for senior care?
4 How soon do you need to find care?
5 Additional details

Thank you for your interest!

Our team will be in touch shortly to help with next steps.