Grand Terrace Health Care Center

Nursing Home
Overview of Grand Terrace Health Care Center

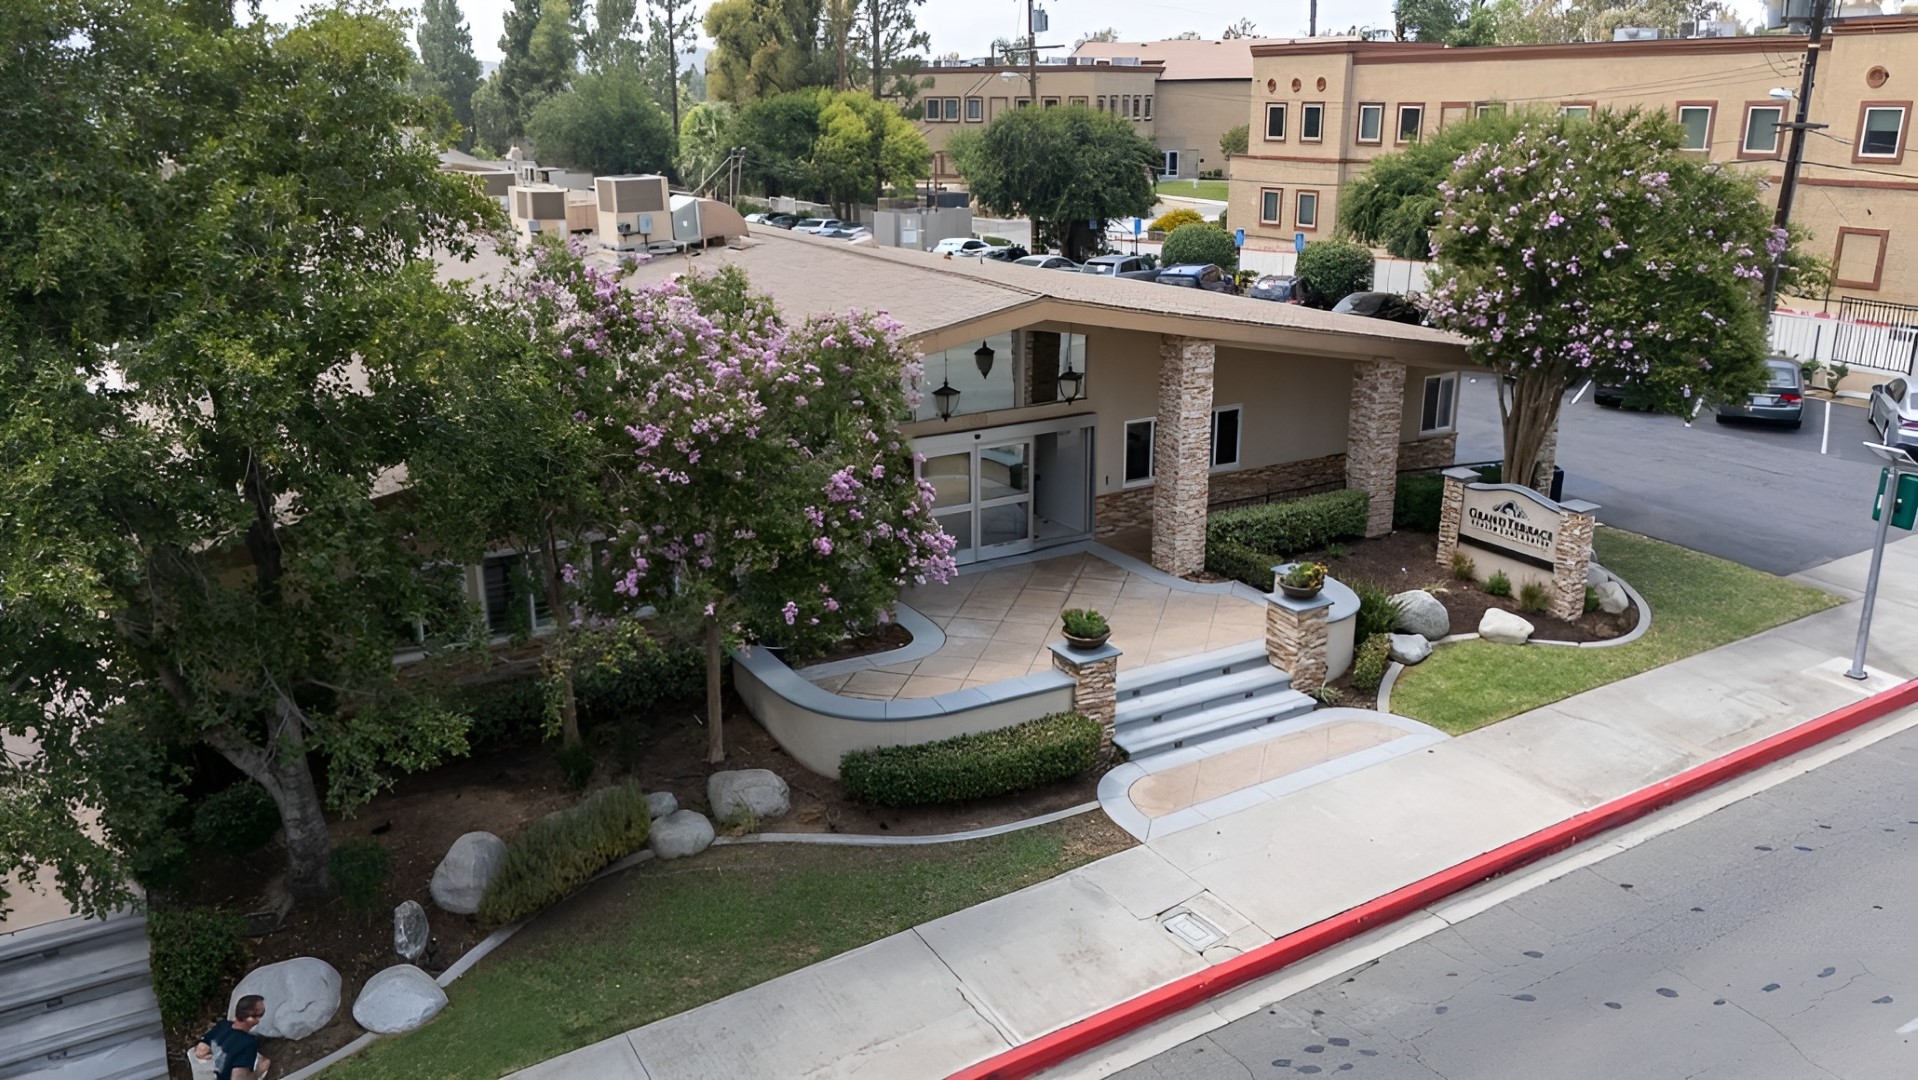
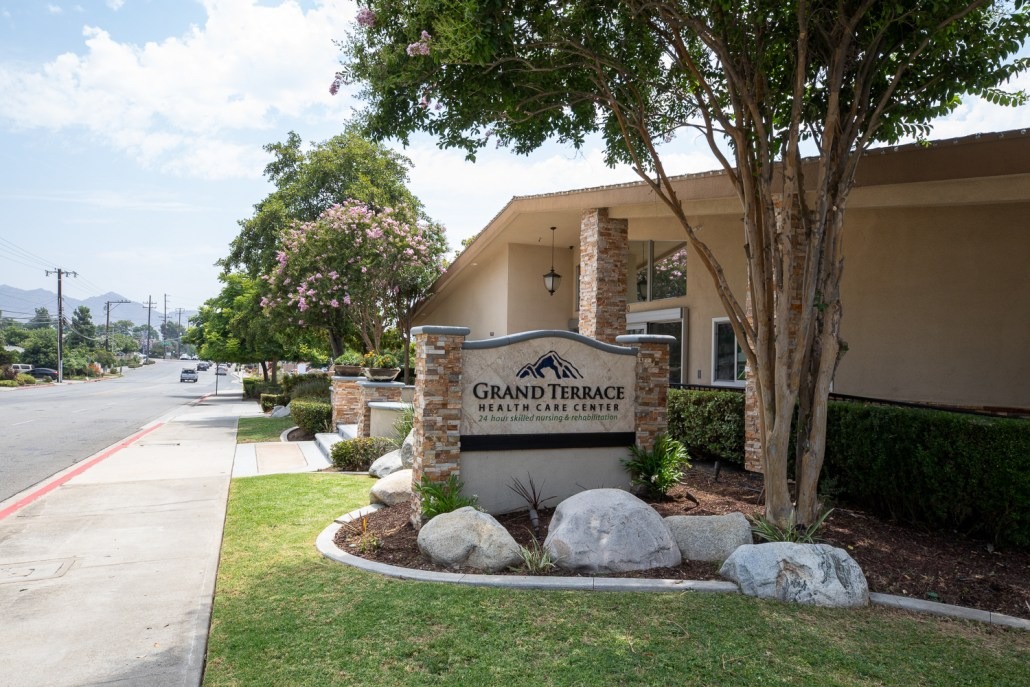
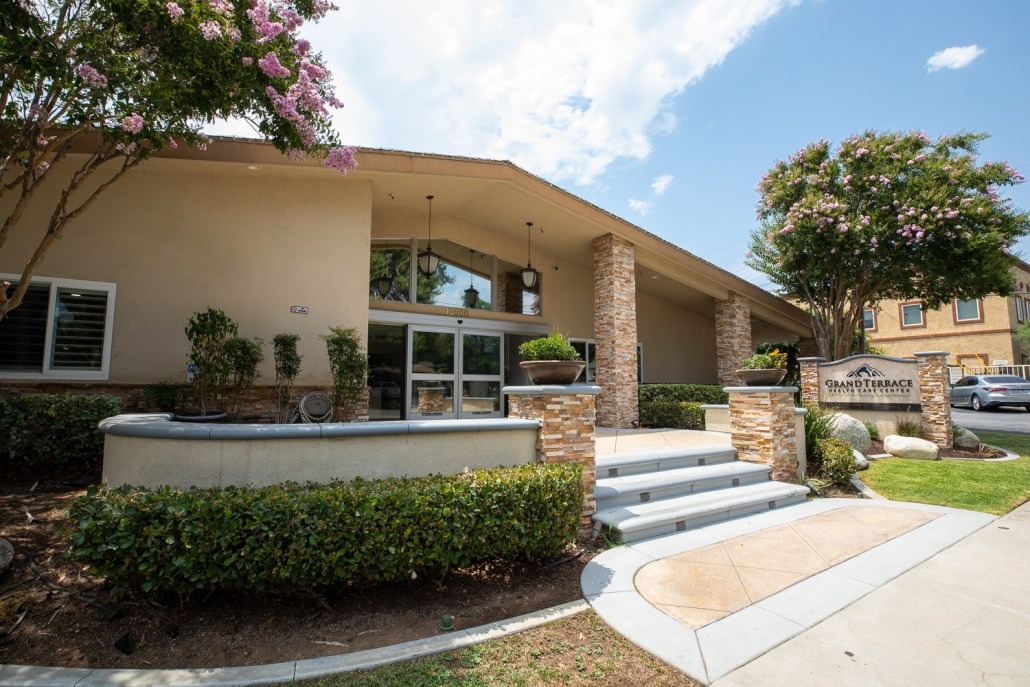
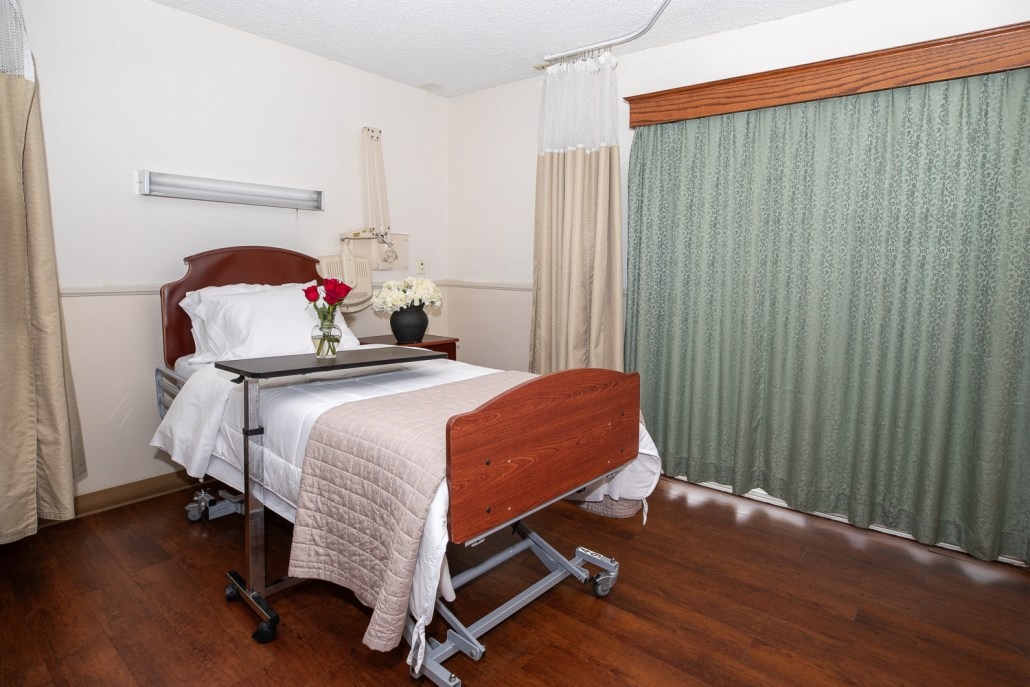
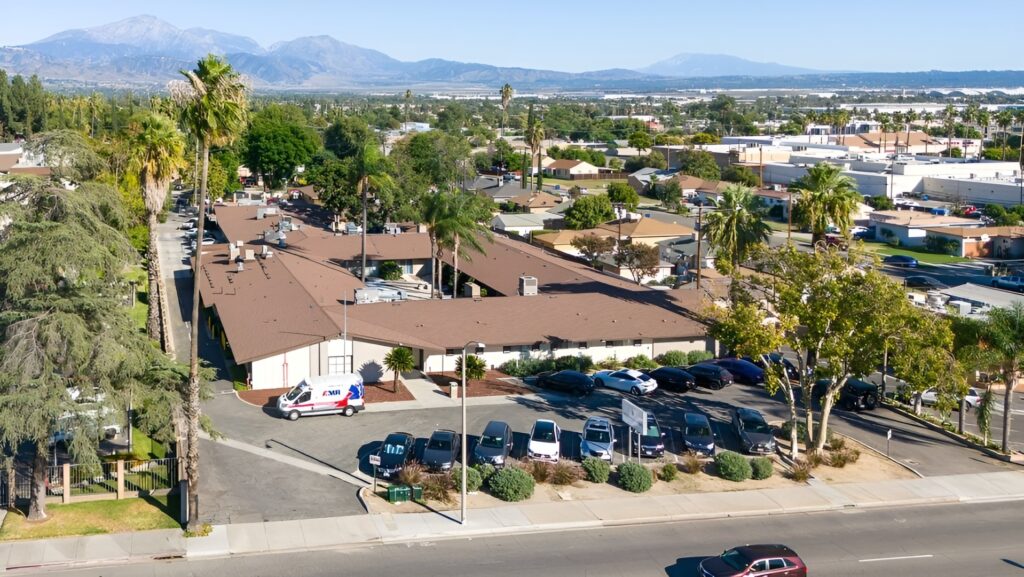
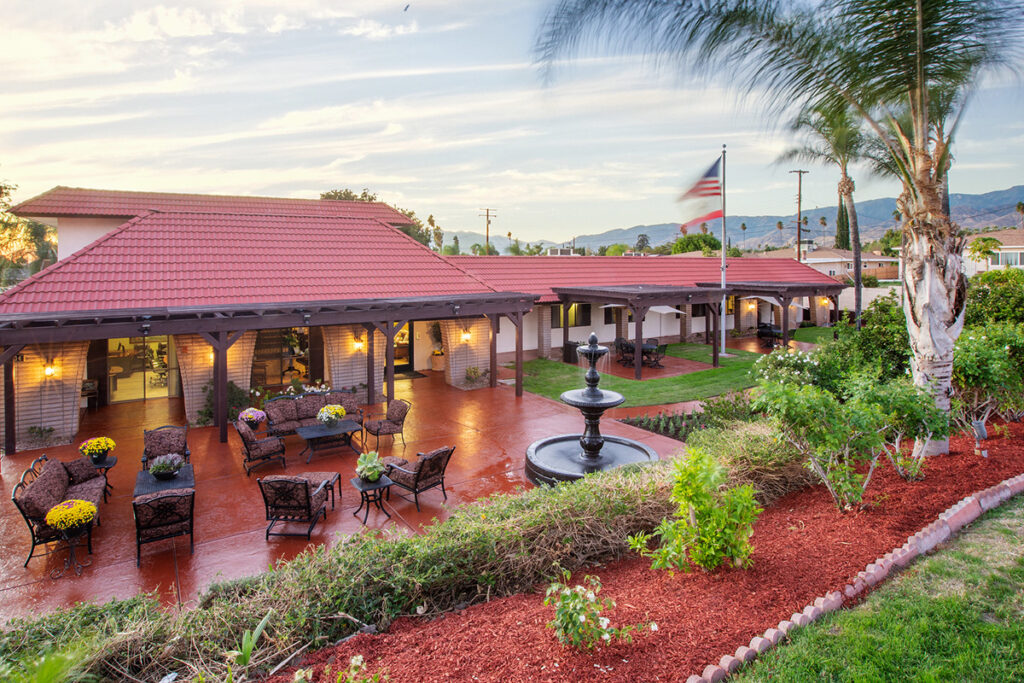
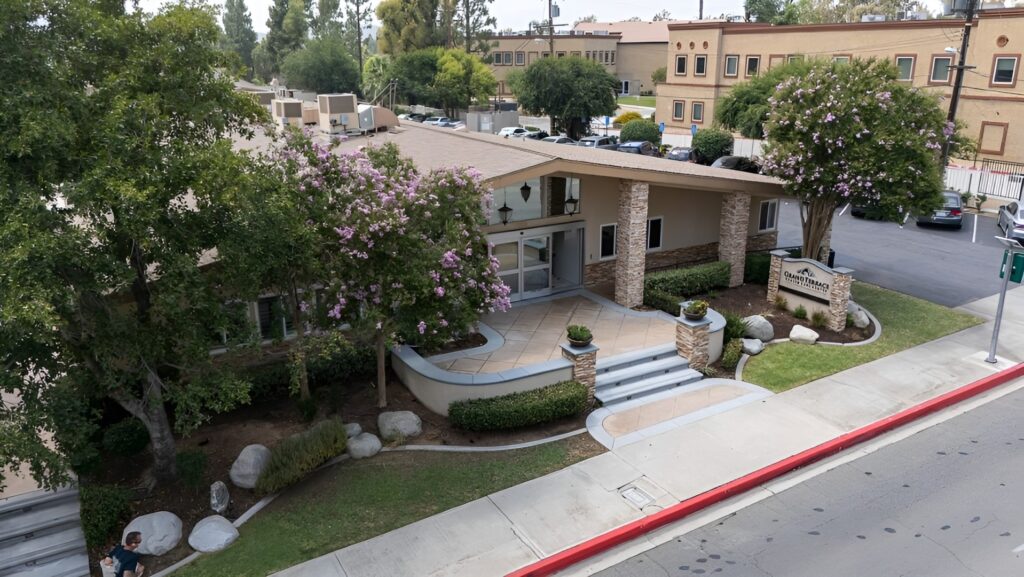
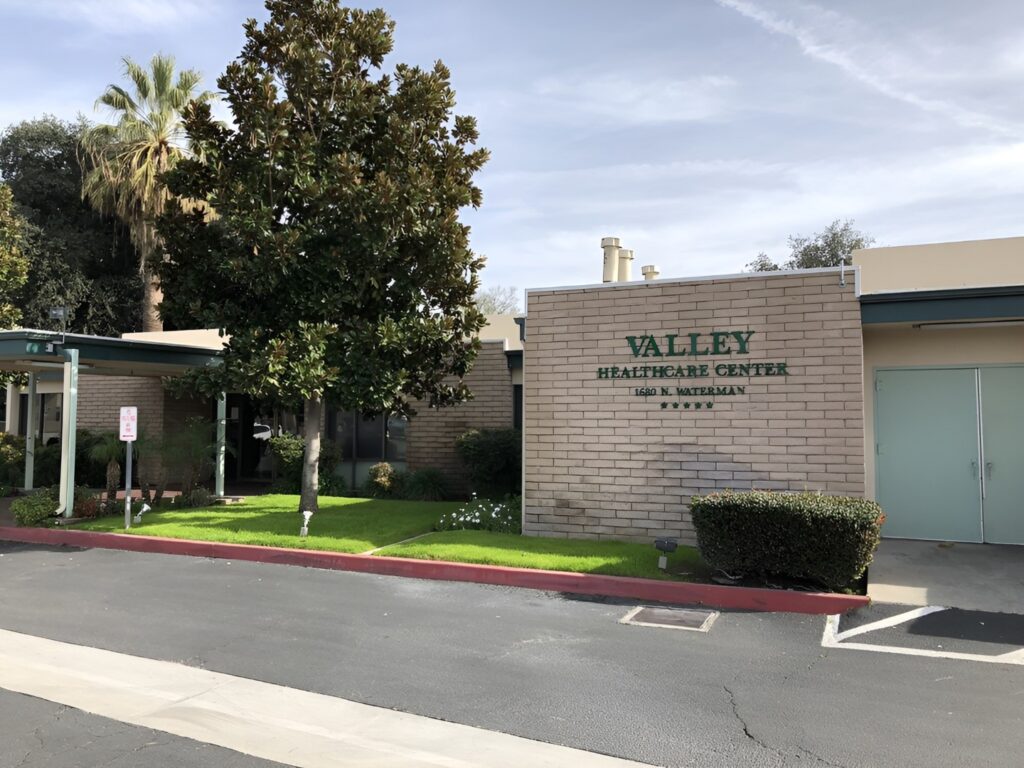
Ideally set in the harmonious residential area of Mt. Vernon Avenue, Grand Terrace, CA, Grand Terrace Health Care Center is a trusted community that offers skilled nursing and rehabilitation. Residents here enjoy their golden years with a kind and highly trained team providing exceptional care and assistance tailored to their needs 24/7. With 59 cozy and specially designed accommodations, residents receive the utmost attention and care they deserve.

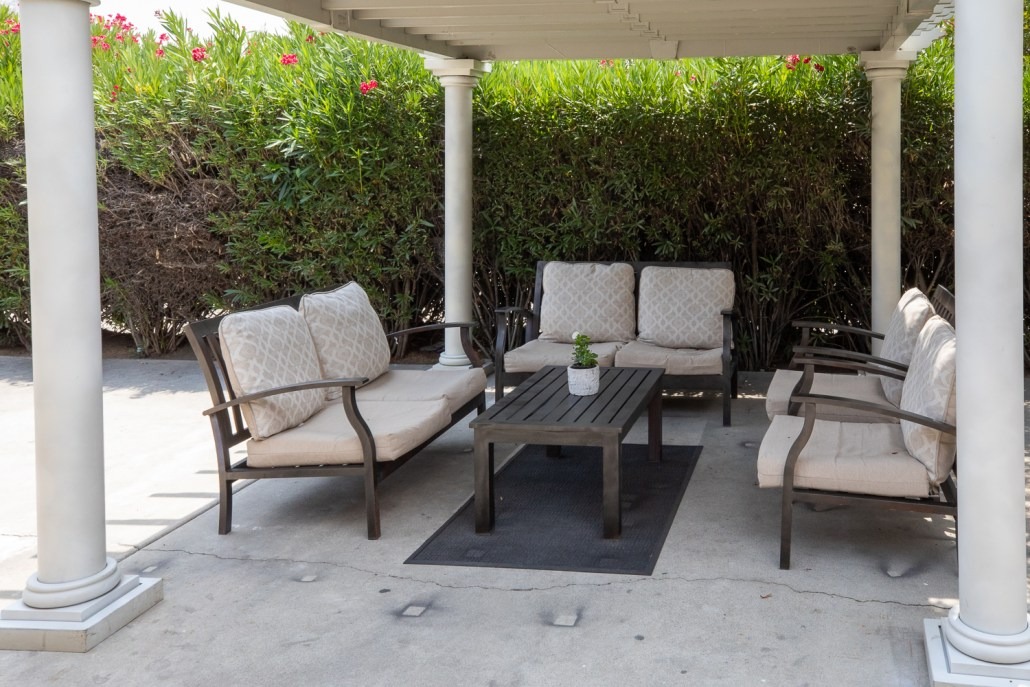
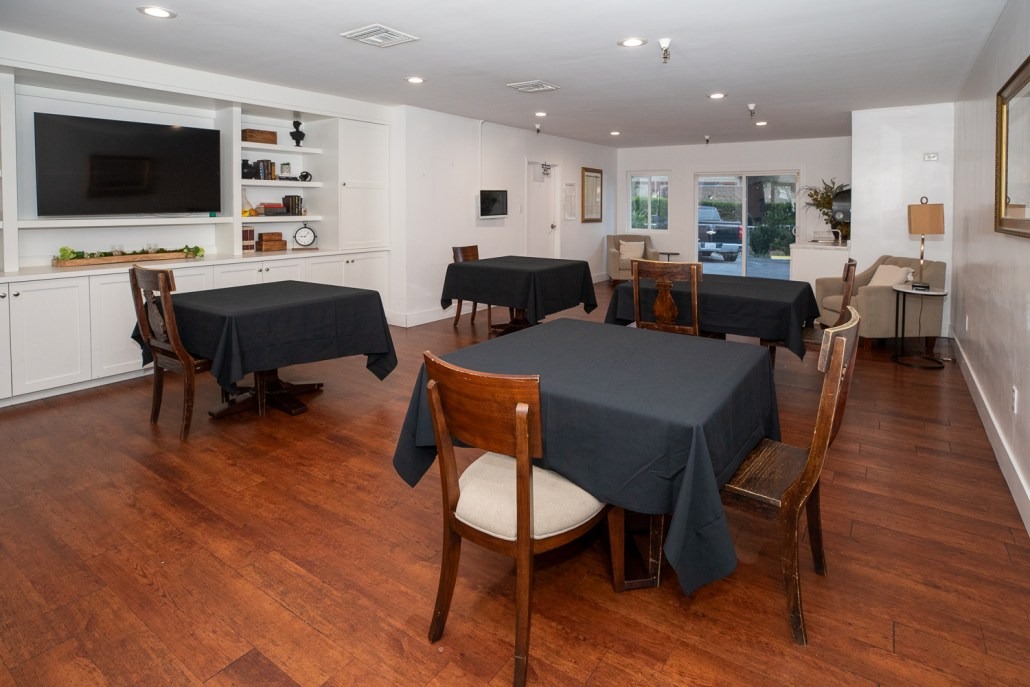
It is important for residents to maintain social connections and live actively, so a jam-packed calendar of stimulating activities and exciting events is conducted to highlight their strengths and interests. Medicare and Medicaid are also accepted in the community, easing residents’ financial burdens. The community is ideal for those seeking top-notch care to improve their living experiences in retirement.

Quality ratings

Measured by Centers for Medicare & Medicaid Services (CMS)

Overall rating Info Official CMS rating based on health inspections, staffing and quality measures.
4/5
California average: 3.1/5
Health Inspection Info Official CMS rating based on deficiencies found during state health inspections.
4/5
California average: 2.8/5
Staffing Info Official CMS rating based on nurse staffing hours per resident per day.
3/5
California average: 3.1/5
Quality Measures Info Official CMS rating based on clinical outcomes for residents.
4/5
California average: 4.1/5

Nursing care per resident

Info Average daily nursing hours per resident (adjusted for acuity). Higher values indicate more nursing time per resident.
4h 7m per day

This home provides 3% less nursing time per resident than the state average.

California average: 4h 13m per day

Staffing hours breakdown

Info Hours of care per resident per day, broken down by staff type. Data from CMS Medicare.
Staff type Facility State avg National avg
Registered Nurse (RN) Info Registered nurse hours per resident per day. 30m per day 39m per day 41m per day
LPN / LVN Info Licensed Practical Nurse / Licensed Vocational Nurse hours per resident per day. 1h 26m per day 1h 13m per day 52m per day
Nurse Aide Info Nurse aide hours per resident per day. 2h 46m per day 2h 39m per day 2h 21m per day
Total Nursing (Weekend) Info Total number of nurse staff hours per resident per day on weekends. 4h 7m per day 4h 5m per day 3h 26m per day
Physical Therapist Info Physical therapist staff hours per resident per day. 6m per day 5m per day 4m per day
RN (Weekend) Info Registered nurse hours per resident per day on weekends. 19m per day 30m per day 29m per day

Capacity and availability

Smaller home

May offer a more intimate, personalized care environment.

Total beds 59

This home usually has limited availability

Occupancy is moderate, suggesting balanced demand.

Similar demand to the California average
Occupancy rate 90.5%
Residents per day (avg) 51
Occupancy rate
90.5%
Residents per day (avg)
51

Who this home usually serves

TYPE OF STAY

Mostly short-term rehab stays

Most residents typically stay for a few weeks or months before returning home or moving on.

Might be optimal for
Short stays Recovery Medicare-covered care

Breakdown by payment type

Medicare

50% of new residents, usually for short-term rehab.

Typical stay 1 - 2 months

Private pay

35% of new residents, often for short stays.

Typical stay 27 days

Medicaid

16% of new residents, often for long-term daily care.

Typical stay 5 - 6 months

Finances and operations

Proprietary home
Corporation
Home revenue
$10.4M
Profit
$705.5K
Proprietary home Corporation
Home revenue
$10,443,747.00
Profit
$705,453.00
Payroll costs Info The portion of the home's budget spent on staff, including nurses, caregivers, and other employees who support care and operations.
$4.4M
42.5% of revenue
Other operating costs Info All remaining costs needed to run the home, such as food, utilities, building maintenance, supplies and administrative expenses.
$5.3M
Total costs $9.7M
Walk Score
Walk Score: 67 / 100
Moderately walkable. Some errands can be accomplished on foot, with a mix of nearby amenities.

About this community

Care Services

Nursing Services
Rehabilitation Services
Skilled Nursing
Licensed Nurses/CNAs
24-Hour Staffing

Programs & Activities

Specific Programs
In-House Therapy, Skilled Nursing, Stay Active

What does this home offer?

Housing options icon

Housing Options: Private / Semi-Private Rooms

Building type icon
Building type icon

Building Type: Single-story

Dining services icon

Dining Services

Housekeeping icon
Housekeeping icon

Housekeeping Services

Recreational activities icon

Recreational Activities
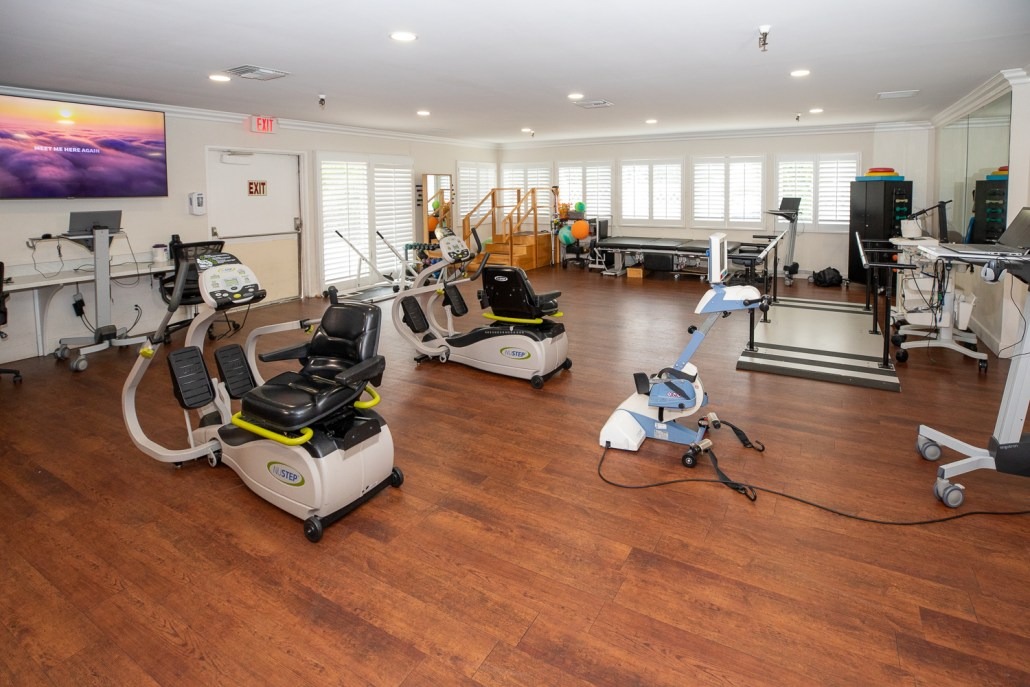
Exercise program icon

Exercise Programs

Types of Care at Grand Terrace Health Care Center

Nursing Home
Contact Grand Terrace Health Care Center

Compare Nursing Homes around San Bernardino County

The information below is reported by the California Department of Social Services and Department of Public Health.
Arrowhead Springs Healthcare Center
SNF

Nursing Homes 24/7 care needed

San Bernardino (Perris Hills)
119
No
-
69
SANCHEZ GONZALEZ, YAMALIEL
87.3%
$19,659,991.00
$7,377,247.00
37.5%
106.50
5/5
4.5628
4/5
4/5
5/5
32
-
+1%
+8%
+3%
Private / Semi-Private Rooms
Highland Palms Healthcare Center
SNF

Nursing Homes 24/7 care needed

Highland (Cypress)
99
No
A+
57
SIVAPALAN, SIVAKAMI
93.2%
$26,652,256.00
$7,129,881.00
26.8%
91.50
5/5
3.1704
4/5
2/5
5/5
33
-
-32%
-25%
+10%
Private Rooms
Grand Terrace Health Care Center
SNF

Nursing Homes 24/7 care needed

Grand Terrace
59
No
-
67
-
90.5%
$10,440,299.00
$4,433,593.00
42.5%
51.30
4/5
4.1117
4/5
3/5
4/5
30
1
+5%
-3%
+7%
Private / Semi-Private Rooms
Loma Linda Post Acute
SNF

Nursing Homes 24/7 care needed

Loma Linda
83
No
-
39
CHANCELLOR HEALTH CARE INC
79.7%
$6,389,080.00
$2,358,380.00
36.9%
78.50
4/5
3.8491
4/5
3/5
3/5
29
-
-30%
-9%
-6%
Semi-Private Rooms
Valley Healthcare Center
SNF

Nursing Homes 24/7 care needed

San Bernardino
202
No
A+
60
VALE HOLDING COMPANY LLC
80.4%
$30,281,364.00
$10,424,406.00
34.4%
189.90
4/5
4.1836
3/5
4/5
5/5
45
-
-27%
-1%
-5%
Private / Semi-Private / 3 Bed Rooms

Places of interest near Grand Terrace Health Care Center

Address 0.1 miles from city center

Address 12000 Mt Vernon Ave, Grand Terrace, CA 92313

Calculate Travel Distance to Grand Terrace Health Care Center

Add your location

Address

Staffing Data

Source: CMS Payroll-Based Journal (Q2 2025)

100
Total Staff
100
Employees
0
Contractors
28,672
Total Hours (Quarter)
44
Avg Staff/Day
7.2
Avg Shift (hrs)
Nursing Staff Breakdown
Role Count Avg Shift (hrs) Uses Contractors?
Registered Nurse97.4 No
Licensed Practical Nurse167.3 No
Certified Nursing Assistant507 No
Staff by Category
Administration
1 staff
7.8hs shift avg
Nursing Staff
77 staff
7.1hs shift avg
Physicians & Practitioners
2 staff
8.8hs shift avg
Therapy Services
12 staff
7.4hs shift avg
Activities & Recreation
0 staff
0hs shift avg
Social Services
3 staff
7.1hs shift avg
Dietary Services
2 staff
7.4hs shift avg
Other Services
3 staff
7.5hs shift avg
Role Employees Contractors Total Staff Total Hours Days Worked % of Days Avg Shift (hrs)
Certified Nursing Assistant5005012,50991100%7
Licensed Practical Nurse160165,93391100%7.3
Speech Language Pathologist4041,6416571%7.2
Registered Nurse9091,62691100%7.4
Physical Therapy Aide3031,3656571%7.6
Dental Services Staff2029736774%7.8
RN Director of Nursing2026896571%8.8
Nurse Practitioner1015856673%8.9
Respiratory Therapy Technician3035276673%7.5
Administrator1015086571%7.8
Physical Therapy Assistant2025006976%7.2
Qualified Social Worker3034986673%7.1
Other Dietary Services Staff1014616268%7.4
Dietitian1014185662%7.5
Mental Health Service Worker1014136066%6.9
Clinical Nurse Specialist1012844%7

Health Inspection History

Inspections
Total health inspections 4

California average 12.5


Last Health inspection on Nov 2024

Total health citations 30
Citations per inspection
7.5

Health citations are formal notices following inspections when they fail to comply with safety and care standards.

29 of 30 citations resulted from standard inspections; and 1 of 30 resulted from complaint investigations.

Breakdown of citation severity (last 3 years)
Critical Health citations More info 1
150% worse than California average

California average: 0.4


Serious Health citations More info 0
100% better than California average

California average: 1

1 critical citation More info California average: 0.4

0 serious citations More info California average: 1

25 moderate citations More info California average: 47.2

4 minor citations More info California average: 1.5
Citations history (last 3 years)
Environmental minor citation Nov 22, 2024
Corrected

Infection Control moderate citation Nov 22, 2024
Corrected

Nutrition moderate citation Nov 22, 2024
Corrected

Pharmacy moderate citation Nov 22, 2024
Corrected

Facility Characteristics

Source: CMS Long-Term Care Facility Characteristics (Data as of Jan 2026)

Ownership: For-Profit Corporation
Resident Census by Payment Source
54 Total Residents
Medicare 13 (24.1%)
Medicaid 16 (29.6%)
Private Pay/Other 25 (46.3%)

Quality of care over time

These measures show how residents usually do over time at this home, based on health outcomes and preventive care.

High-risk clinical events score Info A composite score based on pressure ulcers, falls with injury, weight loss, walking ability decline, and activities of daily living decline. 7.3
10% worse than California average

California average: 6.6

Functional decline score Info A composite score based on activities of daily living decline, walking ability decline, and incontinence. 9.5
16% better than California average

California average: 11.3

Long-stay resident measures
Need for Help with Daily Activities Increased Info Percent of long-stay residents whose need for help with daily activities has increased 10.8%
In line with California average

California average: 11.1%

Walking Ability Worsened Info Percent of long-stay residents whose ability to move independently worsened 16.2%
35% worse than California average

California average: 12.0%

Low Risk Residents with Bowel/Bladder Incontinence Info Percent of low risk long-stay residents who lose control of their bowels or bladder 1.6%
86% better than California average

California average: 11.3%

Falls with Major Injury Info Percent of long-stay residents experiencing one or more falls with major injury 2.3%
40% worse than California average

California average: 1.7%

High Risk Residents with Pressure Ulcers Info Percent of long-stay high risk residents with pressure ulcers 3.3%
33% better than California average

California average: 5.0%

Urinary Tract Infection Info Percent of long-stay residents with a urinary tract infection 0.0%
100% better than California average

California average: 1.2%

Lost Too Much Weight Info Percent of long-stay residents who lose too much weight 3.8%
10% better than California average

California average: 4.2%

Depressive Symptoms Info Percent of long-stay residents who have depressive symptoms 54.9%
721% worse than California average

California average: 6.7%

Antipsychotic Use Info Percent of long-stay residents who received an antipsychotic medication 4.8%
53% better than California average

California average: 10.1%

Pneumococcal Vaccine Info Percent of long-stay residents assessed and appropriately given the pneumococcal vaccine 100.0%
In line with California average

California average: 98.5%

Influenza Vaccine Info Percent of long-stay residents assessed and appropriately given the seasonal influenza vaccine 100.0%
In line with California average

California average: 98.2%

Short-stay resident measures
Pneumococcal Vaccine Info Percent of short-stay residents assessed and appropriately given the pneumococcal vaccine 99.2%
6% better than California average

California average: 94.0%

Antipsychotic medication increase Info Percent of short-stay residents who newly received an antipsychotic medication 1.5%
In line with California average

California average: 1.5%

Influenza Vaccine Info Percent of short-stay residents assessed and appropriately given the seasonal influenza vaccine 96.7%
In line with California average

California average: 93.2%

Re-hospitalized after SNF stay Info Percentage of short-stay residents who were re-hospitalized after their nursing home admission. 26.0%
12% worse than California average

California average: 23.2%

Emergency department visits Info Percentage of short-stay residents who had an outpatient emergency department visit. 11.5%
In line with California average

California average: 11.2%

Falls with major injury Info Percentage of SNF residents who experience falls with major injury during their stay. 0.7%
In line with California average

California average: 0.8%

Ability to care for self at discharge Info Percentage of residents at or above expected ability to care for themselves at discharge. 61.1%
14% better than California average

California average: 53.7%

Successful return to home or community Info Rate of successful return to home or community from a skilled nursing facility. 54.6%
8% better than California average

California average: 50.6%

Guides for Better Senior Living

Care Cost Calculator: See Prices in Your Area

Nursing Home Data Explorer

Don’t Wait Too Long: 7 Red Flag Signs Your Parent Needs Assisted Living Now

The True Cost of Assisted Living in 2025 – And How Families Are Paying For It

Understanding Senior Living Costs: Pricing Models, Discounts & Financial Assistance

Financial Aid for California Seniors

Get financial aid guidance

Multipurpose Senior Services Program

MSSP (Medi-Cal Waiver)

Age 65+, California resident, Medi-Cal eligible, nursing home risk.

~$2,829/month (300% FBR, individual).

$2,000 (individual), $3,000 (couple).

County-managed; waitlists possible.

In-Home Supportive Services (IHSS)

California IHSS

Age 65+, California resident, Medicaid-eligible or low-income.

~$1,732/month (individual, Medi-Cal threshold).

$2,000 (individual).

Can hire family as caregivers.

Multipurpose Senior Services Program (MSSP)

CA MSSP

Age 65+, California resident, Medi-Cal-eligible, nursing home-eligible but community-capable.

~$2,829/month (300% FBR, individual).

$2,000 (individual).

Available in 38 counties; waitlists common.

Property Tax Postponement Program (PTP)

CA PTP

Age 62+, California resident, own and live in home, 40% equity.

~$51,500/year (household, adjusted annually).

Equity-based; no strict asset cap.

Deferred taxes accrue interest (5% as of 2024); repaid upon sale/death.

Assisted Living Waiver (ALW)

CA ALW

Age 65+ or disabled, California resident, Medi-Cal-eligible, nursing home-eligible.

~$2,829/month (300% FBR, individual).

$2,000 (individual).

Available in 15 counties (e.g., LA, Sacramento); waitlists common.

California CARES Program

CA CARES

Caregivers of California residents 60+ needing help with 3+ daily activities; no caregiver age limit.

No strict limit; cost-sharing above ~$2,500/month threshold.

Not applicable; need-based.

High demand in urban areas; complements IHSS respite.

Low-Income Home Energy Assistance Program (LIHEAP)

CA LIHEAP

Age 60+ priority, California resident, low-income, utility/heating need.

~$2,510/month (200% of poverty level, individual).

Not applicable; income-focused.

High demand in inland/coastal extremes; weatherization capped at $5,000/home.

Who we are

Your Senior Care Partner, Every Step of the Way

We help families find affordable senior communities and unlock same day discounts, Medicaid, and Medicare options tailored to your needs.

Contact us Today