Highland Palms Healthcare Center
CMS overall rating Info CMS (the Centers for Medicare & Medicaid Services) is the federal agency that rates nursing home quality. Its Overall Rating runs from 1 to 5 stars, combining health inspections, staffing, and quality measures, with inspections weighted most heavily.

Highland Palms Healthcare Center

CMS overall rating Info CMS (the Centers for Medicare & Medicaid Services) is the federal agency that rates nursing home quality. Its Overall Rating runs from 1 to 5 stars, combining health inspections, staffing, and quality measures, with inspections weighted most heavily.
Calculator: See prices in your area
Highland Palms Healthcare Center accepts Medicaid, Medicare, and private pay.

Overview of Highland Palms Healthcare Center

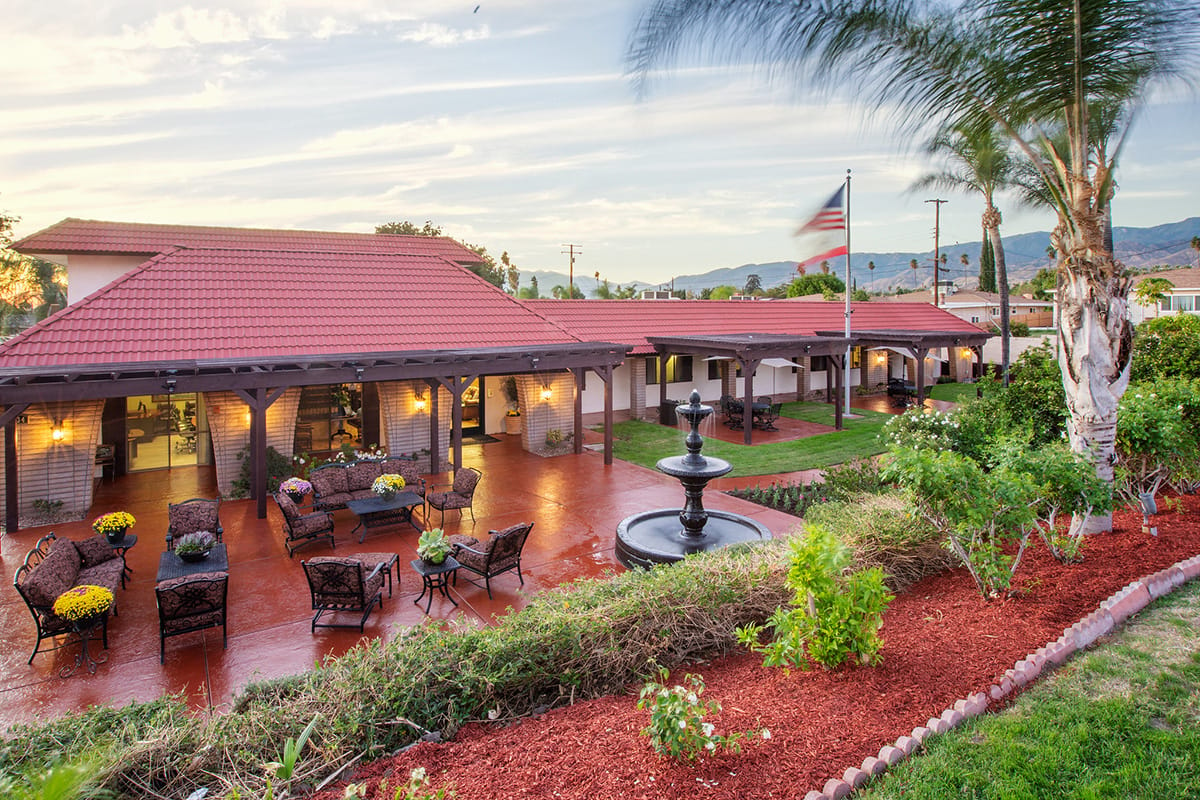
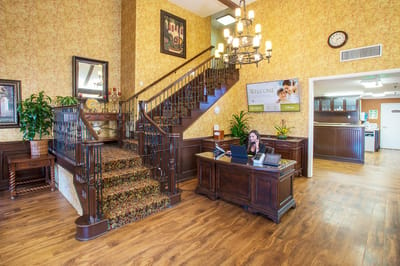
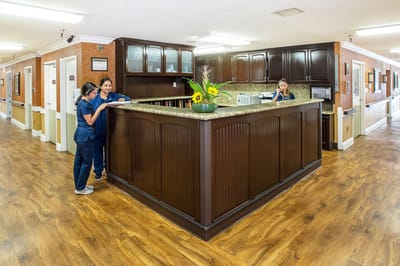
Highland Palms Healthcare Center is a trusted community situated near Loma Linda Medical Center in Highland, CA, that offers nursing care and rehabilitation. With top-notch care and assistance around the clock, residents receive personalized care tailored to their needs and preferences. As a Medicare and Medicaid-certified community, the community strives to provide the highest quality of life while staying on a budget.

Families are also welcome to visit their loved ones, especially with the community’s cozy and beautiful communal spaces. Here, residents enjoy delicious and healthy meals that cater to their dietary needs and preferences. The community is 4-star rated by the Centers for Medicaid and Medicare Services, ensuring a trustworthy and exceptional quality of care.

(909) 862-0611

Quality ratings

Measured by Centers for Medicare & Medicaid Services (CMS)

Overall rating Info The Overall CMS Rating combines results from health inspections, staffing levels and quality measures. Health inspections carry the most weight. Staffing and quality scores can increase or decrease the final rating based on performance compared to state and national standards.
▲ 38.9% Above CA avg. ▲ 38.9% Above CA avg.Click the badge to see the full State ranking.Click here to see the full State ranking.
Health Inspection Info Based on the results of the facility's three most recent standard inspections and any complaint investigations. CMS reviews the number, scope, and severity of deficiencies, with more recent findings weighted more heavily.
▲ 27.0% Above CA avg. ▲ 27.0% Above CA avg.Click the badge to see the full State ranking.Click here to see the full State ranking.
Staffing Info Measures average nursing staff hours per resident per day, including Registered Nurses (RNs) and total nursing staff. Ratings are adjusted based on the level of care residents require and are compared to state and national benchmarks.
▼ 42.0% Below CA avg. ▼ 42.0% Below CA avg.Click the badge to see the full State ranking.Click here to see the full State ranking.
Quality Measures Info Based on clinical and physical health indicators reported to CMS, such as hospital readmissions, falls, pressure ulcers, and improvements in mobility. These measures reflect how well residents' health needs are being managed.
▲ 17.4% Above CA avg. ▲ 17.4% Above CA avg.Click the badge to see the full State ranking.Click here to see the full State ranking.

Staffing hours breakdown

Info Daily nursing hours per resident by staff type, reported to CMS. Higher is generally better — compare this facility to state and national averages to see where staffing stands.

Hours per resident per day — compared to California state averages

Total nursing care / resident Info This home is ranked 327th out of 345 homes in California for nurse hours. Total adjusted nursing hours per resident per day, combining RN, LPN, and aide time. CMS adjusts this for case-mix so facilities can be fairly compared.
3h 10m per day
Rank #327 / 345Nurse hours — State benchmarkedThis home is ranked 327th out of 345 homes in California for nurse hours. Shows adjusted nurse hours per resident per day benchmarked to the California average, with a ranking across 345 California SNFs. More hours mean more direct care. The national average is about 3.5 hrs; below 3.0 is a red flag.Click the rank badge to see the full State ranking.Click here to see the full State ranking.
This facility California avg (4h 23m per day)
vs California avg
-28%

5 of 6 metrics below state avg

Staff typeHours / Day / Residentvs state avg
Registered Nurse (RN) Info RNs hold the highest nursing license and can assess residents, interpret test results, and direct care plans. More RN hours per day often signals stronger clinical oversight and faster response to health changes. 16m per day ▼ 59% State avg: 39m per day · National avg: 41m per day
LPN / LVN Info Licensed Practical Nurses (LPNs) or Licensed Vocational Nurses (LVNs) deliver routine hands-on care — medication administration, wound dressing, and monitoring vital signs. They work under RN supervision and make up a large share of daily bedside care. 1h 14m per day ■ Avg State avg: 1h 13m per day · National avg: 52m per day
Nurse Aide Info Certified Nurse Aides (CNAs) provide the most direct day-to-day assistance: bathing, dressing, feeding, and mobility. Nurse aide hours are typically the largest staffing category and directly affect residents' quality of life. 2h 32m per day ▼ 4% State avg: 2h 39m per day · National avg: 2h 21m per day
Weekend Total Nursing Info Combined nursing hours (RN + LPN + Nurse Aide) per resident per day on weekends. Staffing often drops on weekends — this figure reveals whether the facility maintains adequate coverage outside of weekday hours. 3h 49m per day ▼ 6% State avg: 4h 5m per day · National avg: 3h 26m per day
Physical Therapist Info Hours per resident per day provided by licensed Physical Therapists (PTs) or PT Assistants. PT services help residents recover mobility after injury or illness and are especially important for post-acute (short-stay) rehabilitation. 2m per day ▼ 60% State avg: 5m per day · National avg: 4m per day
Weekend RN Info Registered nurse hours specifically on weekends. Facilities sometimes reduce RN presence on Saturdays and Sundays — a low weekend RN figure compared to weekday hours can indicate reduced clinical oversight when most administrative staff are absent. 14m per day ▼ 53% State avg: 30m per day · National avg: 29m per day

Capacity and availability

This home usually has limited availability

Higher occupancy than the California average: 84.7%
Occupancy rate
93.2% Rank #237 / 1530Occupancy rate — State benchmarkedThis home is ranked 237th out of 1530 homes in California for occupancy rate. Shows this facility's occupancy rate versus the California average, with its Statewide rank out of 1530. Higher occupancy signals strong local demand and financial stability.Click the rank badge to see the full State ranking.Click here to see the full State ranking.
Avg. Length of Stay
101 days
Years in operation
13 years in operation Rank #531 / 1487Years in operation — State benchmarkedThis home is ranked 531st out of 1487 homes in California for years in operation. Shows how long this facility has been in operation compared to other California SNFs. Longer operating histories may benefit residents, families, and staff.Click the rank badge to see the full State ranking.Click here to see the full State ranking.
A community with a solid operating history and experience delivering ongoing care.
Walk Score
Walk Score: 57 / 100 Rank #1158 / 2093Walk Score — State benchmarkedThis home is ranked 1158th out of 2093 homes in California for walk score. Shows how walkable this facility's neighborhood is compared to the average Walk Score across California SNFs. Higher scores benefit residents, families, and staff.Click the rank badge to see the full State ranking.Click here to see the full State ranking.
Moderately walkable. Some errands can be accomplished on foot, with a mix of nearby amenities.
BBB Rating
BBB Rating: A+ (Not Accredited)
An independent rating from the Better Business Bureau based on factors such as complaint history, transparency, and business practices.
How BBB ratings work

About this community

Awards

Awards5-Star Medicare Rating

License Details

CMS Certification Number56024

Payment & Insurance

2 services
Accept Medicaid
Accept Medicare

Therapy & Rehabilitation

2 services
Rehabilitation Services
Respite Care

Staffing & Medical

2 services
Doctor on Staff
24-Hour Staffing

Amenities & Lifestyle

Expansive Rehab Gym
Spacious Courtyards & Common Areas
Specific ProgramsShort-Term Rehabilitation, 24-Hour Skilled Nursing, Complex Wound Care
Touring HoursMonday – Friday: 8 am – 8 pm, Weekends: 9 am – 6 pm

Dining & Nutrition

Food DescriptionHighland Palms Healthcare Center provides personalized rehabilitation and nursing services in a caring environment.

Contact Highland Palms Healthcare Center

Inspection History

In California, the Department of Social Services (for assisted living facilities) and the Department of Public Health (for nursing homes) conduct inspections to ensure resident safety and regulatory compliance.

Health Inspection History

Inspections since 2019
Total health inspections 9

California average 12.5


Last Health inspection on Oct 2024

Total health citations
33 Rank #131 / 352Health citations — State benchmarkedThis home is ranked 131st out of 352 homes in California for health citations. Shows this facility's total health deficiency citations benchmarked to the California State average, with a ranking across all 352 CA SNFs. Lower citation counts earn a better rank.Click the rank badge to see the full State ranking.Click here to see the full State ranking.

California average 50.2

Citations per inspection
3.67 Rank #130 / 352Citations per inspection — State benchmarkedThis home is ranked 130th out of 352 homes in California for citations per inspection. Shows average deficiency citations per CMS inspection for this facility versus the California mean across 352 SNFs with citation data. Lower is better.Click the rank badge to see the full State ranking.Click here to see the full State ranking.

California average 4.65


Health citations are formal notices following inspections when they fail to comply with safety and care standards.

27 of 33 citations resulted from standard inspections; and 6 of 33 resulted from complaint investigations.

Breakdown of citation severity (last 7 years)
Critical health citations
0
100% better than California average

California average: 0.4


Serious health citations
0
100% better than California average

California average: 1

0 critical citations California average: 0.4

0 serious citations California average: 1

33 moderate citations California average: 47.2

0 minor citations California average: 1.5
Citations history (last 7 years)
Infection Control moderate citation Oct 31, 2024
Corrected

Pharmacy moderate citation Oct 31, 2024
Corrected

Pharmacy moderate citation Oct 31, 2024
Corrected

Quality of Care moderate citation Oct 31, 2024
Corrected

Staffing Data

Reporting period: October 1 – December 31, 2025 (Q4 2025). Source: CMS Payroll-Based Journal report.

Total staff 143
Employees 143
Contractors 0
Staff to resident ratio 1.54 : 1
15% fewer staff per resident than California average
California average ratio: 1.81 : 1 California average ratio: 1.81 : 1See full California ranking
Avg staff/day 60
Average shift 7.1 hours
8% worse than California average
California average: 7.7 hours California average shift: 7.7 hoursSee full California ranking
Total staff hours (quarter) 39,014

Nursing staff breakdown

Q4 2025 · Oct 1 – Dec 31 More info This data comes from the CMS Payroll-Based Journal report covering October 1 – December 31, 2025.
Registered Nurse

Manages medical care and health needs.

RN Staff Info All 7 RN Staff are full-time employees. No contractors work on this role. 7
Average shift length Info Average shift length. Calculated as total hours divided by days worked and average staff per day. 7.6 hours
Licensed Practical Nurse

Assists with medical care and medications.

LPN Staff Info All 32 LPN Staff are full-time employees. No contractors work on this role. 32
Average shift length Info Average shift length. Calculated as total hours divided by days worked and average staff per day. 7.2 hours
Certified Nursing Assistant

Helps with daily care and mobility.

CNA Staff Info All 72 CNA Staff are full-time employees. No contractors work on this role. 72
Average shift length Info Average shift length. Calculated as total hours divided by days worked and average staff per day. 7.2 hours

Contractor staffing

Q4 2025 · Oct 1 – Dec 31 More info This data comes from the CMS Payroll-Based Journal report covering October 1 – December 31, 2025.
Total hours from contractors 0% — all staff are direct employees this quarter

Staff by category

Q4 2025 · Oct 1 – Dec 31 More info This data comes from the CMS Payroll-Based Journal report covering October 1 – December 31, 2025.
Certified Nursing Assistant7207220,68992100%7.2
Licensed Practical Nurse320329,19492100%7.2
Speech Language Pathologist9091,9196975%6.3
Registered Nurse7071,58092100%7.6
Physical Therapy Aide6061,0366773%5.6
RN Director of Nursing2021,0308390%6.6
Dental Services Staff2029506368%8.1
Nurse Practitioner1015286571%8.1
Dietitian1014855964%8.2
Other Dietary Services Staff1014666065%7.8
Physical Therapy Assistant2023785459%7
Respiratory Therapy Technician4043167177%4.3
Administrator1012566470%4
Qualified Activities Professional1011521921%8
Qualified Social Worker101341213%2.8
Therapeutic Recreation Specialist101311%3
72 Certified Nursing Assistant
% of Days 100%
32 Licensed Practical Nurse
% of Days 100%
9 Speech Language Pathologist
% of Days 75%
7 Registered Nurse
% of Days 100%
6 Physical Therapy Aide
% of Days 73%
2 RN Director of Nursing
% of Days 90%
2 Dental Services Staff
% of Days 68%
1 Nurse Practitioner
% of Days 71%
1 Dietitian
% of Days 64%
1 Other Dietary Services Staff
% of Days 65%
2 Physical Therapy Assistant
% of Days 59%
4 Respiratory Therapy Technician
% of Days 77%
1 Administrator
% of Days 70%
1 Qualified Activities Professional
% of Days 21%
1 Qualified Social Worker
% of Days 13%
1 Therapeutic Recreation Specialist
% of Days 1%

Penalties and fines

Federal penalties imposed by CMS for regulatory violations, including civil money penalties (fines) and denials of payment for new Medicare/Medicaid admissions.

Source: CMS Penalties Database

No penalties in the past 3 years

No civil money penalties or payment denials were reported in the last 3 years.

Quality of care over time

These measures show how residents usually do over time at this home, based on health outcomes and preventive care.

High-risk clinical events score Info A composite score based on pressure ulcers, falls with injury, weight loss, walking ability decline, and activities of daily living decline. 8.8
32% worse than California average

California average: 6.6

Functional decline score Info A composite score based on activities of daily living decline, walking ability decline, and incontinence. 6.0
47% better than California average

California average: 11.3

Long-stay resident measures
Significantly above average California avg: 4.2 Info CMS star rating based on long-stay quality measure performance. 5 stars = significantly above average, 1 star = significantly below average.
Need for Help with Daily Activities Increased Info Percent of long-stay residents whose need for help with daily activities has increased 5.5%
50% better than California average

California average: 11.1%

Walking Ability Worsened Info Percent of long-stay residents whose ability to move independently worsened 7.7%
36% better than California average

California average: 12.0%

Low Risk Residents with Bowel/Bladder Incontinence Info Percent of low risk long-stay residents who lose control of their bowels or bladder 4.8%
57% better than California average

California average: 11.3%

Falls with Major Injury Info Percent of long-stay residents experiencing one or more falls with major injury 0.0%
100% better than California average

California average: 1.7%

High Risk Residents with Pressure Ulcers Info Percent of long-stay high risk residents with pressure ulcers 29.7%
500% worse than California average

California average: 5.0%

Urinary Tract Infection Info Percent of long-stay residents with a urinary tract infection 0.0%
100% better than California average

California average: 1.2%

Lost Too Much Weight Info Percent of long-stay residents who lose too much weight 0.9%
80% better than California average

California average: 4.2%

Depressive Symptoms Info Percent of long-stay residents who have depressive symptoms 34.0%
407% worse than California average

California average: 6.7%

Antipsychotic Use Info Percent of long-stay residents who received an antipsychotic medication 0.0%
100% better than California average

California average: 10.1%

Pneumococcal Vaccine Info Percent of long-stay residents assessed and appropriately given the pneumococcal vaccine 100.0%
In line with California average

California average: 98.5%

Influenza Vaccine Info Percent of long-stay residents assessed and appropriately given the seasonal influenza vaccine 100.0%
In line with California average

California average: 98.2%

Hospitalizations per 1,000 days Info Number of hospitalizations per 1,000 long-stay resident days. 3.06
36% worse than California average

California average: 2.25

ED visits per 1,000 days Info Number of outpatient emergency department visits per 1,000 long-stay resident days. 1.02
36% better than California average

California average: 1.59

Short-stay resident measures
Average California avg: 3.5 Info CMS star rating based on short-stay quality measure performance. 5 stars = much above average, 1 star = much below average.
Pneumococcal Vaccine Info Percent of short-stay residents assessed and appropriately given the pneumococcal vaccine 99.7%
6% better than California average

California average: 94.0%

Antipsychotic medication increase Info Percent of short-stay residents who newly received an antipsychotic medication 0.0%
100% better than California average

California average: 1.5%

Influenza Vaccine Info Percent of short-stay residents assessed and appropriately given the seasonal influenza vaccine 100.0%
7% better than California average

California average: 93.2%

Re-hospitalized after SNF stay Info Percentage of short-stay residents who were re-hospitalized after their nursing home admission. 21.4%
8% better than California average

California average: 23.2%

Emergency department visits Info Percentage of short-stay residents who had an outpatient emergency department visit. 11.9%
6% worse than California average

California average: 11.2%

Falls with major injury Info Percentage of SNF residents who experience falls with major injury during their stay. 0.0%
100% better than California average

California average: 0.8%

Ability to care for self at discharge Info Percentage of residents at or above expected ability to care for themselves at discharge. 63.1%
17% better than California average

California average: 53.7%

Successful return to home or community Info Rate of successful return to home or community from a skilled nursing facility. 50.1%
In line with California average

California average: 50.6%

Breakdown by payment type

Medicare

39% of new residents, usually for short-term rehab.

Typical stay 2 - 3 months

Private pay

59% of new residents, often for short stays.

Typical stay 3 - 4 months

Medicaid

2% of new residents, often for long-term daily care.

Typical stay 9 - 10 months

Facility Characteristics

Source: CMS Long-Term Care Facility Characteristics (Data as of Jan 2026)

Total residents 93
Medicare
22
23.7% of residents
Medicaid
18
19.4% of residents
Private pay or other
53
57% of residents
Programs & Services
Residents Group

Residents meet regularly to discuss policies, care quality, and activities

Active Resident Council

Organized group of residents that meets regularly to discuss facility policies, quality of life, and activities.

Finances and operations

Privately-owned community
Home revenue
$26.7M
Profit
$4.5M
Privately-owned community
Home revenue
$26.7M Rank #84 / 346Revenue — State benchmarkedThis home is ranked 84th out of 346 homes in California for revenue. Shows this facility's annual revenue compared to the California SNF average. Higher revenue generally means more resources for staffing and capital — read alongside Payroll %.Click the rank badge to see the full State ranking.Click here to see the full State ranking.
Profit
$4.5M
Payroll costs Info The portion of the home's budget spent on staff, including nurses, caregivers, and other employees who support care and operations. Rank #185 / 346Payroll — State benchmarkedThis home is ranked 185th out of 346 homes in California for payroll. Shows total annual staff payroll benchmarked to the California average. Higher payroll investment relative to peers often signals better staffing and less reliance on cheaper contract labor.Click the rank badge to see the full State ranking.Click here to see the full State ranking.
$8.2M
30.7% of revenue Rank #328 / 346Payroll % — State benchmarkedThis home is ranked 328th out of 346 homes in California for payroll %. Shows payroll as a percentage of revenue versus the California average. Well-run California SNFs typically land around 56–67% — the top third Statewide. Below 25% may signal understaffing or heavy agency use — read with Staffing ratings.Click the rank badge to see the full State ranking.Click here to see the full State ranking.
Other operating costs Info All remaining costs needed to run the home, such as food, utilities, building maintenance, supplies and administrative expenses.
$14.0M
Total costs $22.2M

What does this home offer?

Housing options icon

Housing Options: Private Rooms

Building type icon
Building type icon

Building Type: Single-story

Housekeeping icon
Housekeeping icon

Housekeeping Services
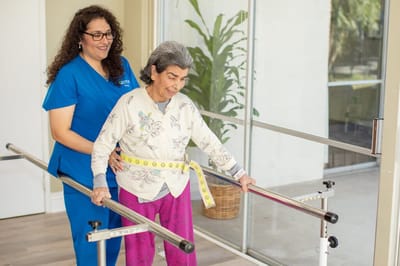
Exercise program icon

Exercise Programs

Health Programs icon

Health Programs

Who this home usually serves

TYPE OF STAY

Mix of rehab and long-term care

This home supports both short-term rehab and long-term care, with residents staying for a wide range of durations.

Managed by Daniel Driggs

Administrator

Daniel Driggs serves as the Administrator at Highland Palms Healthcare Center, leading the team dedicated to providing quality care. His leadership ensures residents receive attentive and compassionate support in a welcoming environment.

Places of interest near Highland Palms Healthcare Center

Address 2.1 miles from city center Info Estimated distance in miles from Highland's city center to Highland Palms Healthcare Center's address, calculated via Google Maps.

Calculate Travel Distance to Highland Palms Healthcare Center

Add your location

Address

Financial Assistance for
Nursing Home in California

Highland Palms Healthcare Center is located in Highland, California.
Here are the financial assistance programs available to residents in California.

Get Financial aid guidance

Multipurpose Senior Services Program

MSSP (Medi-Cal Waiver)

Age 65+
General California resident, Medi-Cal eligible, nursing home risk.
Income Limits (2025) ~$2,829/month 300% FBR, individual
Asset Limits $2,000 (individual), $3,000 (couple).
CA

County-managed; waitlists possible.

Benefits
In-home support (4-6 hours/day) Respite care (14 days/year) Meals (~$6/meal) Transportation (8 trips/month) Care management

In-Home Supportive Services (IHSS)

California IHSS

Age 65+
General California resident, Medicaid-eligible or low-income.
Income Limits ~$1,732/month individual, Medi-Cal threshold
Asset Limits $2,000 individual
CA

Can hire family as caregivers.

Benefits
Personal care (up to 283 hours/month) Homemaker services Respite (varies)

Multipurpose Senior Services Program (MSSP)

CA MSSP

Age 65+
General California resident, Medi-Cal-eligible, nursing home-eligible but community-capable.
Income Limits ~$2,829/month 300% FBR, individual
Asset Limits $2,000 individual
CA

Available in 38 counties; waitlists common.

Benefits
Case management Respite care (up to 10 days/year) Minor home mods (avg. $500) Adult day care (~$50/day)

Property Tax Postponement Program (PTP)

CA PTP

Age 62+
General California resident, own and live in home, 40% equity.
Income Limits (2025) ~$51,500/year household, adjusted annually
Asset Limits Equity-based; no strict asset cap.
CA

Deferred taxes accrue interest (5% as of 2024); repaid upon sale/death.

Benefits
Property tax deferral (avg. $1,000-$3,000/year, varies by county)

Assisted Living Waiver (ALW)

CA ALW

Age 65+ or disabled
General California resident, Medi-Cal-eligible, nursing home-eligible.
Income Limits ~$2,829/month 300% FBR, individual
Asset Limits $2,000 individual
CA

Available in 15 counties (e.g., LA, Sacramento); waitlists common.

Benefits
Personal care in ALFs (5-7 hours/day) Medication management Social services

California CARES Program

CA CARES

Age
General Caregivers of California residents 60+ needing help with 3+ daily activities; no caregiver age limit.
Income Limits No strict limit; cost-sharing above ~$2,500/month threshold.
Asset Limits Not applicable; need-based.
CA

High demand in urban areas; complements IHSS respite.

Benefits
Respite care (up to 10 days/year) Counseling (4-6 sessions/year) Training (2-3 workshops/year) Supplies (~$200/year)

Compare Nursing Home around San Bernardino County

The information below is reported by the California Department of Social Services and Department of Public Health.

5 facilities compared · CMS & CA Dept. of Health data

Filter by care type
Arrowhead Springs Healthcare Center
NH

Nursing Home Licensed facility providing 24/7 skilled nursing care for residents with complex, ongoing medical needs. Staffed by RNs, LPNs, and CNAs. Inspected and star-rated annually by CMS. Accepts Medicare (short-term rehab) and Medicaid (long-term care).

San Bernardino (Perris Hills)
119
Facility 119
CA AVG 103
Rank #599 / 1658
--4.56 -21%+8%$0323.6-107-
69
Facility 69
CA AVG 57
Rank #769 / 2093
Yamaliel Sanchez Gonzalez$19.7M$8.9M45%55708
Highland Palms Healthcare Center
NH

Nursing Home Licensed facility providing 24/7 skilled nursing care for residents with complex, ongoing medical needs. Staffed by RNs, LPNs, and CNAs. Inspected and star-rated annually by CMS. Accepts Medicare (short-term rehab) and Medicaid (long-term care).

Highland (Cypress)
99
Facility 99
CA AVG 103
Rank #727 / 1658
--3.17 -45%-25%$0333.7-92A+
57
Facility 57
CA AVG 57
Rank #1158 / 2093
Sivakami Sivapalan$26.7M$8.2M30.7%56024
Grand Terrace Health Care Center
NH

Nursing Home Licensed facility providing 24/7 skilled nursing care for residents with complex, ongoing medical needs. Staffed by RNs, LPNs, and CNAs. Inspected and star-rated annually by CMS. Accepts Medicare (short-term rehab) and Medicaid (long-term care).

Grand Terrace
59
Facility 59
CA AVG 103
Rank #1092 / 1658
--4.11 +12%-3%$0307.5151-
67
Facility 67
CA AVG 57
Rank #831 / 2093
-$10.4M$5.2M49.4%55129
Loma Linda Post Acute
NH

Nursing Home Licensed facility providing 24/7 skilled nursing care for residents with complex, ongoing medical needs. Staffed by RNs, LPNs, and CNAs. Inspected and star-rated annually by CMS. Accepts Medicare (short-term rehab) and Medicaid (long-term care).

Loma Linda
64
Facility 64
CA AVG 103
Rank #1051 / 1658
79.7% -6%3.85 -9%-9%$0293.2-51-
39
Facility 39
CA AVG 57
Rank #1576 / 2093
Chancellor Health Care Inc$6.4M$2.8M43.5%55299
Valley Healthcare Center
NH

Nursing Home Licensed facility providing 24/7 skilled nursing care for residents with complex, ongoing medical needs. Staffed by RNs, LPNs, and CNAs. Inspected and star-rated annually by CMS. Accepts Medicare (short-term rehab) and Medicaid (long-term care).

San Bernardino
202
Facility 202
CA AVG 103
Rank #148 / 1658
--4.18 -16%-1%$0455.6-21A+
60
Facility 60
CA AVG 57
Rank #1051 / 2093
Vale Holding Company LLC$31.3M$15.2M48.5%56389

Frequently Asked Questions about Highland Palms Healthcare Center

What neighborhood is Highland Palms Healthcare Center in?

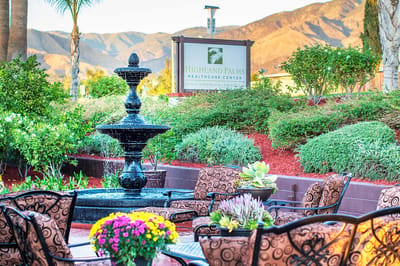
Highland Palms Healthcare Center is in the Cypress neighborhood of Highland.

Is Highland Palms Healthcare Center in a walkable area?

Highland Palms Healthcare Center has a walk score of 57. Moderately walkable. Some errands can be accomplished on foot, with a mix of nearby amenities.

Are there photos of Highland Palms Healthcare Center?

Yes — there are 14 photos of Highland Palms Healthcare Center in the photo gallery on this page.

What is the address of Highland Palms Healthcare Center?

Highland Palms Healthcare Center is located at 7534 Palm Ave, Highland, CA 92346.

What is the phone number of Highland Palms Healthcare Center?

(909) 862-0611 will put you in contact with the team at Highland Palms Healthcare Center.

Is Highland Palms Healthcare Center Medicare or Medicaid certified?

Yes — Highland Palms Healthcare Center is a CMS-certified provider of Medicare and Medicaid.

Guides for Better Senior Living

Care Cost Calculator: See Prices in Your Area

Nursing Home Data Explorer

Don’t Wait Too Long: 7 Red Flag Signs Your Parent Needs Assisted Living Now

The True Cost of Assisted Living in 2025 – And How Families Are Paying For It

Understanding Senior Living Costs: Pricing Models, Discounts & Financial Assistance

Explore Open Rooms
1 Contact details
2 What type of senior care service are you looking for?
3 What budget do you have in mind for senior care?
4 How soon do you need to find care?
5 Additional details

Thank you for your interest!

Our team will be in touch shortly to help with next steps.