Grand Terrace Health Care Center
Nursing Home · San Bernardino County, CA
CMS overall rating Info The Overall CMS Rating is scored from 1 to 5 stars and combines results from health inspections, staffing levels, and quality measures. Health inspections carry the most weight. Staffing and quality scores can increase or decrease the final rating based on performance compared to state and national standards.

Grand Terrace Health Care Center

Nursing Home · San Bernardino County, CA
CMS overall rating Info The Overall CMS Rating is scored from 1 to 5 stars and combines results from health inspections, staffing levels, and quality measures. Health inspections carry the most weight. Staffing and quality scores can increase or decrease the final rating based on performance compared to state and national standards.
Calculator: See prices in your area
Grand Terrace Health Care Center accepts Medicare, Medicaid, and private pay.

Overview of Grand Terrace Health Care Center

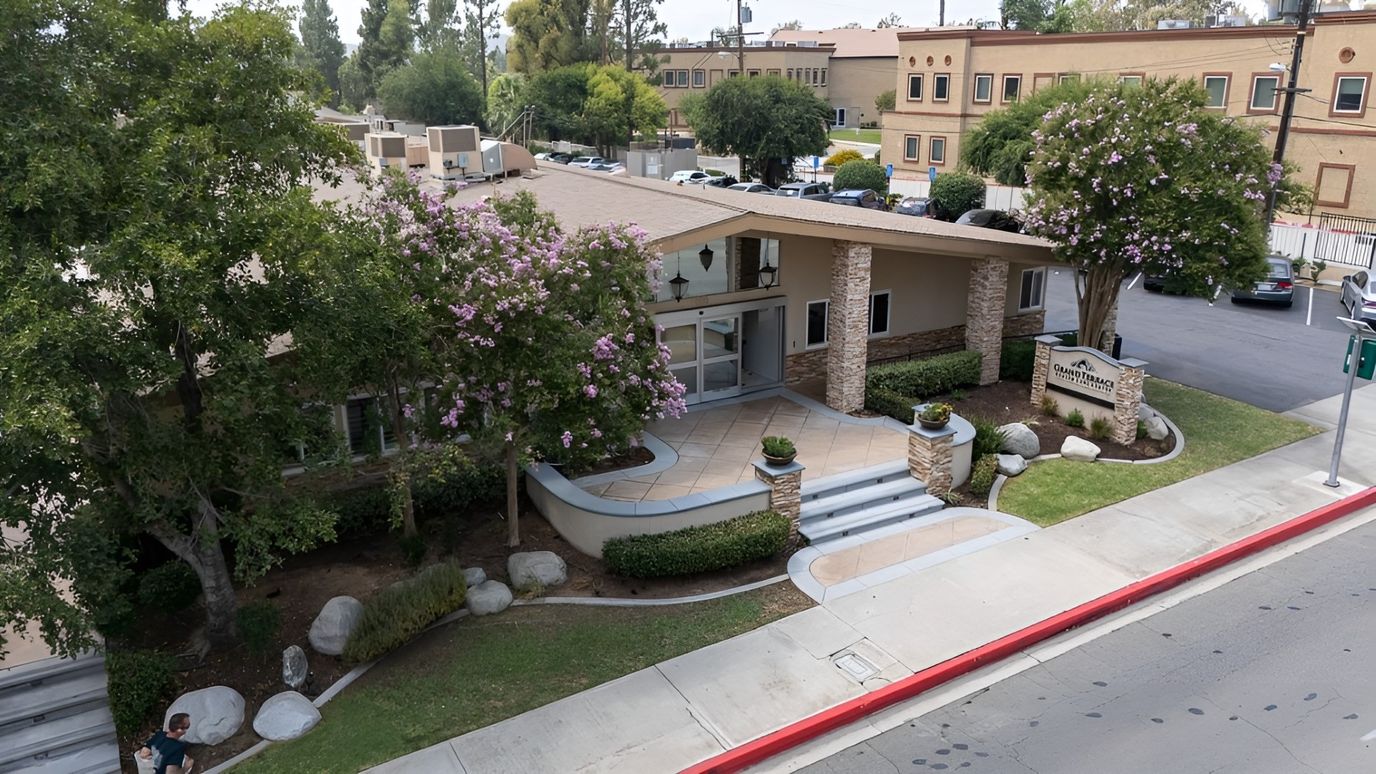
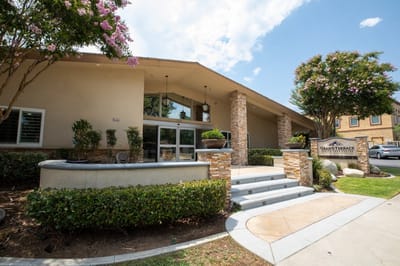
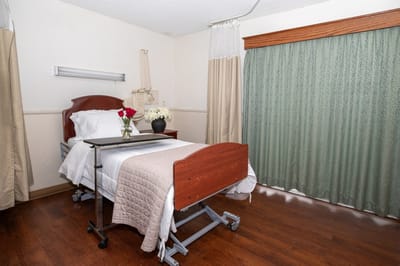
Ideally set in the harmonious residential area of Mt. Vernon Avenue, Grand Terrace, CA, Grand Terrace Health Care Center is a trusted community that offers skilled nursing and rehabilitation. Residents here enjoy their golden years with a kind and highly trained team providing exceptional care and assistance tailored to their needs 24/7. With 59 cozy and specially designed accommodations, residents receive the utmost attention and care they deserve.

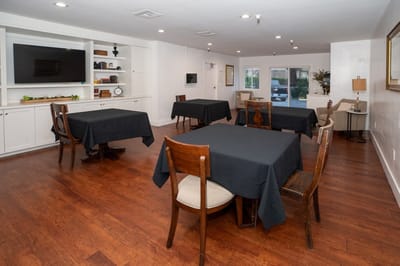
It is important for residents to maintain social connections and live actively, so a jam-packed calendar of stimulating activities and exciting events is conducted to highlight their strengths and interests. Medicare and Medicaid are also accepted in the community, easing residents’ financial burdens. The community is ideal for those seeking top-notch care to improve their living experiences in retirement.

Quality ratings

Measured by Centers for Medicare & Medicaid Services (CMS)

Overall rating Info The Overall CMS Rating combines results from health inspections, staffing levels and quality measures. Health inspections carry the most weight. Staffing and quality scores can increase or decrease the final rating based on performance compared to state and national standards.
▲ 27.0% Above CA avg. ▲ 27.0% Above CA avg.Click the badge to see the full State ranking.Click here to see the full State ranking.
Health Inspection Info Based on the results of the facility's three most recent standard inspections and any complaint investigations. CMS reviews the number, scope, and severity of deficiencies, with more recent findings weighted more heavily.
▲ 43.0% Above CA avg. ▲ 43.0% Above CA avg.Click the badge to see the full State ranking.Click here to see the full State ranking.
Staffing Info Measures average nursing staff hours per resident per day, including Registered Nurses (RNs) and total nursing staff. Ratings are adjusted based on the level of care residents require and are compared to state and national benchmarks.
▼ 4.4% Below CA avg. ▼ 4.4% Below CA avg.Click the badge to see the full State ranking.Click here to see the full State ranking.
Quality Measures Info Based on clinical and physical health indicators reported to CMS, such as hospital readmissions, falls, pressure ulcers, and improvements in mobility. These measures reflect how well residents' health needs are being managed.
▼ 2.1% Below CA avg. ▼ 2.1% Below CA avg.Click the badge to see the full State ranking.Click here to see the full State ranking.

Staffing hours breakdown

Info Daily nursing hours per resident by staff type, reported to CMS. Higher is generally better — compare this facility to state and national averages to see where staffing stands.

Hours per resident per day — compared to California state averages

Total nursing care / resident Info This home is ranked 158th out of 346 homes in California. Total adjusted nursing hours per resident per day, combining RN, LPN, and aide time. CMS adjusts this for case-mix so facilities can be fairly compared.
4h 7m per day
Rank #158 / 346Nurse hours — State benchmarkedThis home is ranked 158th out of 346 homes in California. Shows adjusted nurse hours per resident per day benchmarked to the California average, with a ranking across 346 California SNFs. More hours mean more direct care. The national average is about 3.5 hrs; below 3.0 is a red flag.Click the rank badge to see the full State ranking.Click here to see the full State ranking.
This facility California avg (4h 13m per day)
vs California avg
-3%

3 of 6 metrics below state avg

Standout metric Physical Therapist is +20% above state avg
Staff typeHours / Day / Residentvs state avg
Registered Nurse (RN) Info RNs hold the highest nursing license and can assess residents, interpret test results, and direct care plans. More RN hours per day often signals stronger clinical oversight and faster response to health changes. 30m per day ▼ 23% State avg: 39m per day · National avg: 41m per day
LPN / LVN Info Licensed Practical Nurses (LPNs) or Licensed Vocational Nurses (LVNs) deliver routine hands-on care — medication administration, wound dressing, and monitoring vital signs. They work under RN supervision and make up a large share of daily bedside care. 1h 26m per day ▲ 18% State avg: 1h 13m per day · National avg: 52m per day
Nurse Aide Info Certified Nurse Aides (CNAs) provide the most direct day-to-day assistance: bathing, dressing, feeding, and mobility. Nurse aide hours are typically the largest staffing category and directly affect residents' quality of life. 2h 46m per day ▲ 4% State avg: 2h 39m per day · National avg: 2h 21m per day
Weekend Total Nursing Info Combined nursing hours (RN + LPN + Nurse Aide) per resident per day on weekends. Staffing often drops on weekends — this figure reveals whether the facility maintains adequate coverage outside of weekday hours. 3h 57m per day ▼ 3% State avg: 4h 5m per day · National avg: 3h 26m per day
Physical Therapist Info Hours per resident per day provided by licensed Physical Therapists (PTs) or PT Assistants. PT services help residents recover mobility after injury or illness and are especially important for post-acute (short-stay) rehabilitation. 6m per day ▲ 20% State avg: 5m per day · National avg: 4m per day
Weekend RN Info Registered nurse hours specifically on weekends. Facilities sometimes reduce RN presence on Saturdays and Sundays — a low weekend RN figure compared to weekday hours can indicate reduced clinical oversight when most administrative staff are absent. 19m per day ▼ 37% State avg: 30m per day · National avg: 29m per day

Types of Care at Grand Terrace Health Care Center

Nursing Home

Capacity and availability

This home usually has limited availability

Occupancy between 85% and 95% suggests balanced demand.

Higher occupancy than the California average: 84.7%
Occupancy rate 90.5% Rank #297 / 1407Occupancy rate — State benchmarkedThis home is ranked 297th out of 1407 homes in California. Shows this facility's occupancy rate versus the California average, with its Statewide rank out of 1407. Higher occupancy signals strong local demand and financial stability.Click the rank badge to see the full State ranking.Click here to see the full State ranking.
Avg. Length of Stay 62 days
Occupancy rate
90.5% Rank #297 / 1407Occupancy rate — State benchmarkedThis home is ranked 297th out of 1407 homes in California. Shows this facility's occupancy rate versus the California average, with its Statewide rank out of 1407. Higher occupancy signals strong local demand and financial stability.Click the rank badge to see the full State ranking.Click here to see the full State ranking.
Avg. Length of Stay
62 days
Walk Score
Walk Score: 67 / 100 Rank #831 / 2096Walk Score — State benchmarkedThis home is ranked 831st out of 2096 homes in California. Shows how walkable this facility's neighborhood is compared to the average Walk Score across California SNFs. Higher scores benefit residents, families, and staff.Click the rank badge to see the full State ranking.Click here to see the full State ranking.
Moderately walkable. Some errands can be accomplished on foot, with a mix of nearby amenities.

About this community

Therapy & Rehabilitation

1 service
Rehabilitation Services

Staffing & Medical

1 service
24-Hour Staffing

Amenities & Lifestyle

Specific ProgramsIn-House Therapy, Stay Active

Contact Grand Terrace Health Care Center

Staffing Data

Reporting period: October 1 – December 31, 2025 (Q4 2025). Source: CMS Payroll-Based Journal report.

Total staff 110
Employees 110
Contractors 0
Staff to resident ratio 2.04:1
12% better than California average
California average ratio: 1.81:1 California average ratio: 1.81:1See full California ranking
Avg staff/day 43
Average shift 7.1 hours
8% worse than California average
California average: 7.7 hours California average shift: 7.7 hoursSee full California ranking
Total staff hours (quarter) 28,253

Nursing staff breakdown

Q4 2025 · Oct 1 – Dec 31 More info This data comes from the CMS Payroll-Based Journal report covering October 1 – December 31, 2025.
Registered Nurse

Manages medical care and health needs.

RN Staff 11
Average shift length Info Average shift length. Calculated as total hours divided by days worked and average staff per day. 7.3 hours

No contractors work on this role.

Licensed Practical Nurse

Assists with medical care and medications.

LPN Staff 18
Average shift length Info Average shift length. Calculated as total hours divided by days worked and average staff per day. 7.2 hours

No contractors work on this role.

Certified Nursing Assistant

Helps with daily care and mobility.

CNA Staff 50
Average shift length Info Average shift length. Calculated as total hours divided by days worked and average staff per day. 7 hours

No contractors work on this role.

Contractor staffing

Q4 2025 · Oct 1 – Dec 31 More info This data comes from the CMS Payroll-Based Journal report covering October 1 – December 31, 2025.

Total hours from contractors

0%

0 contractor hours this quarter

No contractor roles were reported this quarter.

Staff by category

Q4 2025 · Oct 1 – Dec 31 More info This data comes from the CMS Payroll-Based Journal report covering October 1 – December 31, 2025.
Certified Nursing Assistant5005012,24892100%7
Licensed Practical Nurse180185,99692100%7.2
Registered Nurse110111,5079199%7.3
Speech Language Pathologist4041,4226672%7.1
Physical Therapy Aide6061,3487379%7.1
Dental Services Staff2029926571%8
Respiratory Therapy Technician2027766975%6.3
RN Director of Nursing2026796672%8.9
Nurse Practitioner1015946773%8.9
Administrator1015156672%7.8
Mental Health Service Worker1015126470%8
Physical Therapy Assistant3035006874%7.1
Dietitian1014776571%7.3
Other Dietary Services Staff4044746773%7
Qualified Social Worker2021884145%4.6
Clinical Nurse Specialist2022733%9
50 Certified Nursing Assistant
% of Days 100%
18 Licensed Practical Nurse
% of Days 100%
11 Registered Nurse
% of Days 99%
4 Speech Language Pathologist
% of Days 72%
6 Physical Therapy Aide
% of Days 79%
2 Dental Services Staff
% of Days 71%
2 Respiratory Therapy Technician
% of Days 75%
2 RN Director of Nursing
% of Days 72%
1 Nurse Practitioner
% of Days 73%
1 Administrator
% of Days 72%
1 Mental Health Service Worker
% of Days 70%
3 Physical Therapy Assistant
% of Days 74%
1 Dietitian
% of Days 71%
4 Other Dietary Services Staff
% of Days 73%
2 Qualified Social Worker
% of Days 45%
2 Clinical Nurse Specialist
% of Days 3%

Penalties and fines

Federal penalties imposed by CMS for regulatory violations, including civil money penalties (fines) and denials of payment for new Medicare/Medicaid admissions.

Source: CMS Penalties Database

No penalties in the past 3 years

No civil money penalties or payment denials were reported in the last 3 years.

Quality of care over time

These measures show how residents usually do over time at this home, based on health outcomes and preventive care.

High-risk clinical events score Info A composite score based on pressure ulcers, falls with injury, weight loss, walking ability decline, and activities of daily living decline. 7.3
10% worse than California average

California average: 6.6

Functional decline score Info A composite score based on activities of daily living decline, walking ability decline, and incontinence. 9.5
16% better than California average

California average: 11.3

Long-stay resident measures
Significantly above average California avg: 4.2 Info CMS star rating based on long-stay quality measure performance. 5 stars = significantly above average, 1 star = significantly below average.
Need for Help with Daily Activities Increased Info Percent of long-stay residents whose need for help with daily activities has increased 10.8%
In line with California average

California average: 11.1%

Walking Ability Worsened Info Percent of long-stay residents whose ability to move independently worsened 16.2%
35% worse than California average

California average: 12.0%

Low Risk Residents with Bowel/Bladder Incontinence Info Percent of low risk long-stay residents who lose control of their bowels or bladder 1.6%
86% better than California average

California average: 11.3%

Falls with Major Injury Info Percent of long-stay residents experiencing one or more falls with major injury 2.3%
40% worse than California average

California average: 1.7%

High Risk Residents with Pressure Ulcers Info Percent of long-stay high risk residents with pressure ulcers 3.3%
33% better than California average

California average: 5.0%

Urinary Tract Infection Info Percent of long-stay residents with a urinary tract infection 0.0%
100% better than California average

California average: 1.2%

Lost Too Much Weight Info Percent of long-stay residents who lose too much weight 3.8%
10% better than California average

California average: 4.2%

Depressive Symptoms Info Percent of long-stay residents who have depressive symptoms 54.9%
721% worse than California average

California average: 6.7%

Antipsychotic Use Info Percent of long-stay residents who received an antipsychotic medication 4.8%
53% better than California average

California average: 10.1%

Pneumococcal Vaccine Info Percent of long-stay residents assessed and appropriately given the pneumococcal vaccine 100.0%
In line with California average

California average: 98.5%

Influenza Vaccine Info Percent of long-stay residents assessed and appropriately given the seasonal influenza vaccine 100.0%
In line with California average

California average: 98.2%

Short-stay resident measures
Average California avg: 3.5 Info CMS star rating based on short-stay quality measure performance. 5 stars = much above average, 1 star = much below average.
Pneumococcal Vaccine Info Percent of short-stay residents assessed and appropriately given the pneumococcal vaccine 99.2%
6% better than California average

California average: 94.0%

Antipsychotic medication increase Info Percent of short-stay residents who newly received an antipsychotic medication 1.5%
In line with California average

California average: 1.5%

Influenza Vaccine Info Percent of short-stay residents assessed and appropriately given the seasonal influenza vaccine 96.7%
In line with California average

California average: 93.2%

Re-hospitalized after SNF stay Info Percentage of short-stay residents who were re-hospitalized after their nursing home admission. 26.0%
12% worse than California average

California average: 23.2%

Emergency department visits Info Percentage of short-stay residents who had an outpatient emergency department visit. 11.5%
In line with California average

California average: 11.2%

Falls with major injury Info Percentage of SNF residents who experience falls with major injury during their stay. 0.7%
In line with California average

California average: 0.8%

Ability to care for self at discharge Info Percentage of residents at or above expected ability to care for themselves at discharge. 61.1%
14% better than California average

California average: 53.7%

Successful return to home or community Info Rate of successful return to home or community from a skilled nursing facility. 54.6%
8% better than California average

California average: 50.6%

Breakdown by payment type

Medicare

50% of new residents, usually for short-term rehab.

Typical stay 1 - 2 months

Private pay

35% of new residents, often for short stays.

Typical stay 27 days

Medicaid

16% of new residents, often for long-term daily care.

Typical stay 5 - 6 months

Facility Characteristics

Source: CMS Long-Term Care Facility Characteristics (Data as of Jan 2026)

Total residents 54
Medicare
13
24.1% of residents
Medicaid
16
29.6% of residents
Private pay or other
25
46.3% of residents

Finances and operations

Privately-owned community
Operated by a business corporation.
Home revenue
$10.4M
Profit
$705.5K
Privately-owned community Operated by a business corporation.
Home revenue
$10.4M Rank #273 / 347Revenue — State benchmarkedThis home is ranked 273rd out of 347 homes in California. Shows this facility's annual revenue compared to the California SNF average. Higher revenue generally means more resources for staffing and capital — read alongside Payroll %.Click the rank badge to see the full State ranking.Click here to see the full State ranking.
Profit
$705.5K
Payroll costs Info The portion of the home's budget spent on staff, including nurses, caregivers, and other employees who support care and operations. Rank #286 / 347Payroll — State benchmarkedThis home is ranked 286th out of 347 homes in California. Shows total annual staff payroll benchmarked to the California average. Higher payroll investment relative to peers often signals better staffing and less reliance on cheaper contract labor.Click the rank badge to see the full State ranking.Click here to see the full State ranking.
$5.2M
49.4% of revenue Rank #168 / 347Payroll % — State benchmarkedThis home is ranked 168th out of 347 homes in California. Shows payroll as a percentage of revenue versus the California average. Well-run California SNFs typically land around 56–67% — the top third Statewide. Below 25% may signal understaffing or heavy agency use — read with Staffing ratings.Click the rank badge to see the full State ranking.Click here to see the full State ranking.
Other operating costs Info All remaining costs needed to run the home, such as food, utilities, building maintenance, supplies and administrative expenses.
$4.6M
Total costs $9.7M

What does this home offer?

Housing options icon

Housing Options: Private / Semi-Private Rooms

Building type icon
Building type icon

Building Type: Single-story

Dining services icon

Dining Services

Housekeeping icon
Housekeeping icon

Housekeeping Services

Recreational activities icon

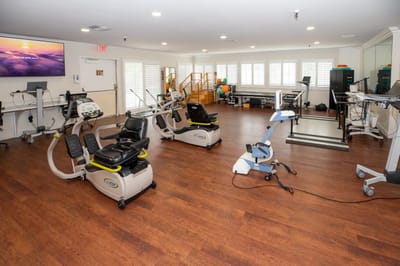
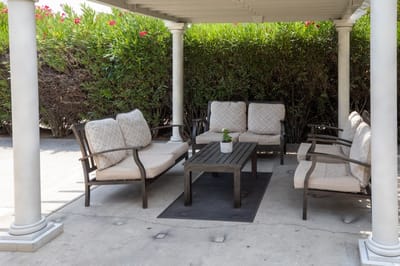
Recreational Activities

Exercise program icon

Exercise Programs

Who this home usually serves

TYPE OF STAY

Mostly short-term rehab stays

Most residents typically stay for a few weeks or months before returning home or moving on.

Places of interest near Grand Terrace Health Care Center

Address 0.1 miles from city center Info Estimated distance in miles from Grand Terrace's city center to Grand Terrace Health Care Center's address, calculated via Google Maps.

Calculate Travel Distance to Grand Terrace Health Care Center

Add your location

Address

Financial Assistance for
Nursing Home in California

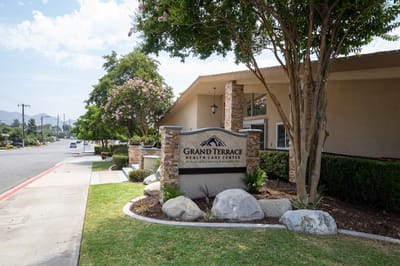
Grand Terrace Health Care Center is located in Grand Terrace, California.
Here are the financial assistance programs available to residents in California.

Get Financial aid guidance

Multipurpose Senior Services Program

MSSP (Medi-Cal Waiver)

Age 65+
General California resident, Medi-Cal eligible, nursing home risk.
Income Limits (2025) ~$2,829/month 300% FBR, individual
Asset Limits $2,000 (individual), $3,000 (couple).
CA

County-managed; waitlists possible.

Benefits
In-home support (4-6 hours/day) Respite care (14 days/year) Meals (~$6/meal) Transportation (8 trips/month) Care management

In-Home Supportive Services (IHSS)

California IHSS

Age 65+
General California resident, Medicaid-eligible or low-income.
Income Limits ~$1,732/month individual, Medi-Cal threshold
Asset Limits $2,000 individual
CA

Can hire family as caregivers.

Benefits
Personal care (up to 283 hours/month) Homemaker services Respite (varies)

Multipurpose Senior Services Program (MSSP)

CA MSSP

Age 65+
General California resident, Medi-Cal-eligible, nursing home-eligible but community-capable.
Income Limits ~$2,829/month 300% FBR, individual
Asset Limits $2,000 individual
CA

Available in 38 counties; waitlists common.

Benefits
Case management Respite care (up to 10 days/year) Minor home mods (avg. $500) Adult day care (~$50/day)

Property Tax Postponement Program (PTP)

CA PTP

Age 62+
General California resident, own and live in home, 40% equity.
Income Limits (2025) ~$51,500/year household, adjusted annually
Asset Limits Equity-based; no strict asset cap.
CA

Deferred taxes accrue interest (5% as of 2024); repaid upon sale/death.

Benefits
Property tax deferral (avg. $1,000-$3,000/year, varies by county)

Assisted Living Waiver (ALW)

CA ALW

Age 65+ or disabled
General California resident, Medi-Cal-eligible, nursing home-eligible.
Income Limits ~$2,829/month 300% FBR, individual
Asset Limits $2,000 individual
CA

Available in 15 counties (e.g., LA, Sacramento); waitlists common.

Benefits
Personal care in ALFs (5-7 hours/day) Medication management Social services

California CARES Program

CA CARES

Age
General Caregivers of California residents 60+ needing help with 3+ daily activities; no caregiver age limit.
Income Limits No strict limit; cost-sharing above ~$2,500/month threshold.
Asset Limits Not applicable; need-based.
CA

High demand in urban areas; complements IHSS respite.

Benefits
Respite care (up to 10 days/year) Counseling (4-6 sessions/year) Training (2-3 workshops/year) Supplies (~$200/year)

Compare Nursing Home around San Bernardino County

The information below is reported by the California Department of Social Services and Department of Public Health.

5 facilities compared · CMS & CA Dept. of Health data

Filter by care type
Arrowhead Springs Healthcare Center
NH

Nursing Home Licensed facility providing 24/7 skilled nursing care for residents with complex, ongoing medical needs. Staffed by RNs, LPNs, and CNAs. Inspected and star-rated annually by CMS. Accepts Medicare (short-term rehab) and Medicaid (long-term care).

San Bernardino (Perris Hills)119 87.3% +3%4.56 -21%+8%$0323.6-107- 69 Yamaliel Sanchez Gonzalez$19.7M$8.9M45%55708
Highland Palms Healthcare Center
NH

Nursing Home Licensed facility providing 24/7 skilled nursing care for residents with complex, ongoing medical needs. Staffed by RNs, LPNs, and CNAs. Inspected and star-rated annually by CMS. Accepts Medicare (short-term rehab) and Medicaid (long-term care).

Highland (Cypress)99 93.2% +10%3.17 -45%-25%$0333.7-92A+ 57 Sivakami Sivapalan$26.7M$8.2M30.7%56024
Grand Terrace Health Care Center
NH

Nursing Home Licensed facility providing 24/7 skilled nursing care for residents with complex, ongoing medical needs. Staffed by RNs, LPNs, and CNAs. Inspected and star-rated annually by CMS. Accepts Medicare (short-term rehab) and Medicaid (long-term care).

Grand Terrace59 90.5% +7%4.11 +12%-3%$0307.5151- 67 -$10.4M$5.2M49.4%55129
Loma Linda Post Acute
NH

Nursing Home Licensed facility providing 24/7 skilled nursing care for residents with complex, ongoing medical needs. Staffed by RNs, LPNs, and CNAs. Inspected and star-rated annually by CMS. Accepts Medicare (short-term rehab) and Medicaid (long-term care).

Loma Linda64 79.7% -6%3.85 -9%-9%$0293.2-79- 39 Chancellor Health Care Inc$6.4M$2.8M43.5%55299
Valley Healthcare Center
NH

Nursing Home Licensed facility providing 24/7 skilled nursing care for residents with complex, ongoing medical needs. Staffed by RNs, LPNs, and CNAs. Inspected and star-rated annually by CMS. Accepts Medicare (short-term rehab) and Medicaid (long-term care).

San Bernardino202 80.4% -5%4.18 -16%-1%$0455.6-21A+ 60 Vale Holding Company LLC$31.3M$15.2M48.5%56389

Frequently Asked Questions about Grand Terrace Health Care Center

What neighborhood is Grand Terrace Health Care Center in?

Grand Terrace Health Care Center is in the Grand Terrace neighborhood.

Is Grand Terrace Health Care Center in a walkable area?

Grand Terrace Health Care Center has a walk score of 67. Moderately walkable. Some errands can be accomplished on foot, with a mix of nearby amenities.

Are there photos of Grand Terrace Health Care Center?

Yes — there is 1 photo of Grand Terrace Health Care Center in the photo gallery on this page.

What is the address of Grand Terrace Health Care Center?

Grand Terrace Health Care Center is located at 12000 Mt Vernon Ave, Grand Terrace, CA 92313.

What is the phone number of Grand Terrace Health Care Center?

(909) 825-5221 will put you in contact with the team at Grand Terrace Health Care Center.

Is Grand Terrace Health Care Center Medicare or Medicaid certified?

Yes — Grand Terrace Health Care Center is a CMS-certified provider of Medicare and Medicaid.

Guides for Better Senior Living

Care Cost Calculator: See Prices in Your Area

Nursing Home Data Explorer

Don’t Wait Too Long: 7 Red Flag Signs Your Parent Needs Assisted Living Now

The True Cost of Assisted Living in 2025 – And How Families Are Paying For It

Understanding Senior Living Costs: Pricing Models, Discounts & Financial Assistance

Explore Open Rooms
1 Contact details
2 What type of senior care service are you looking for?
3 What budget do you have in mind for senior care?
4 How soon do you need to find care?
5 Additional details

Thank you for your interest!

Our team will be in touch shortly to help with next steps.