Explore Open Rooms

1 Contact details
2 What type of senior care service are you looking for?
3 What budget do you have in mind for senior care?
4 How soon do you need to find care?
5 Additional details

Thank you for your interest!

Our team will be in touch shortly to help with next steps.

Nursing Home

Green Valley Rehabilitation Health Center

Nursing Home

Green Valley Rehabilitation Health Center

1735 Adkins St, Eugene, OR 97401 View map
Overview of Green Valley Rehabilitation Health Center

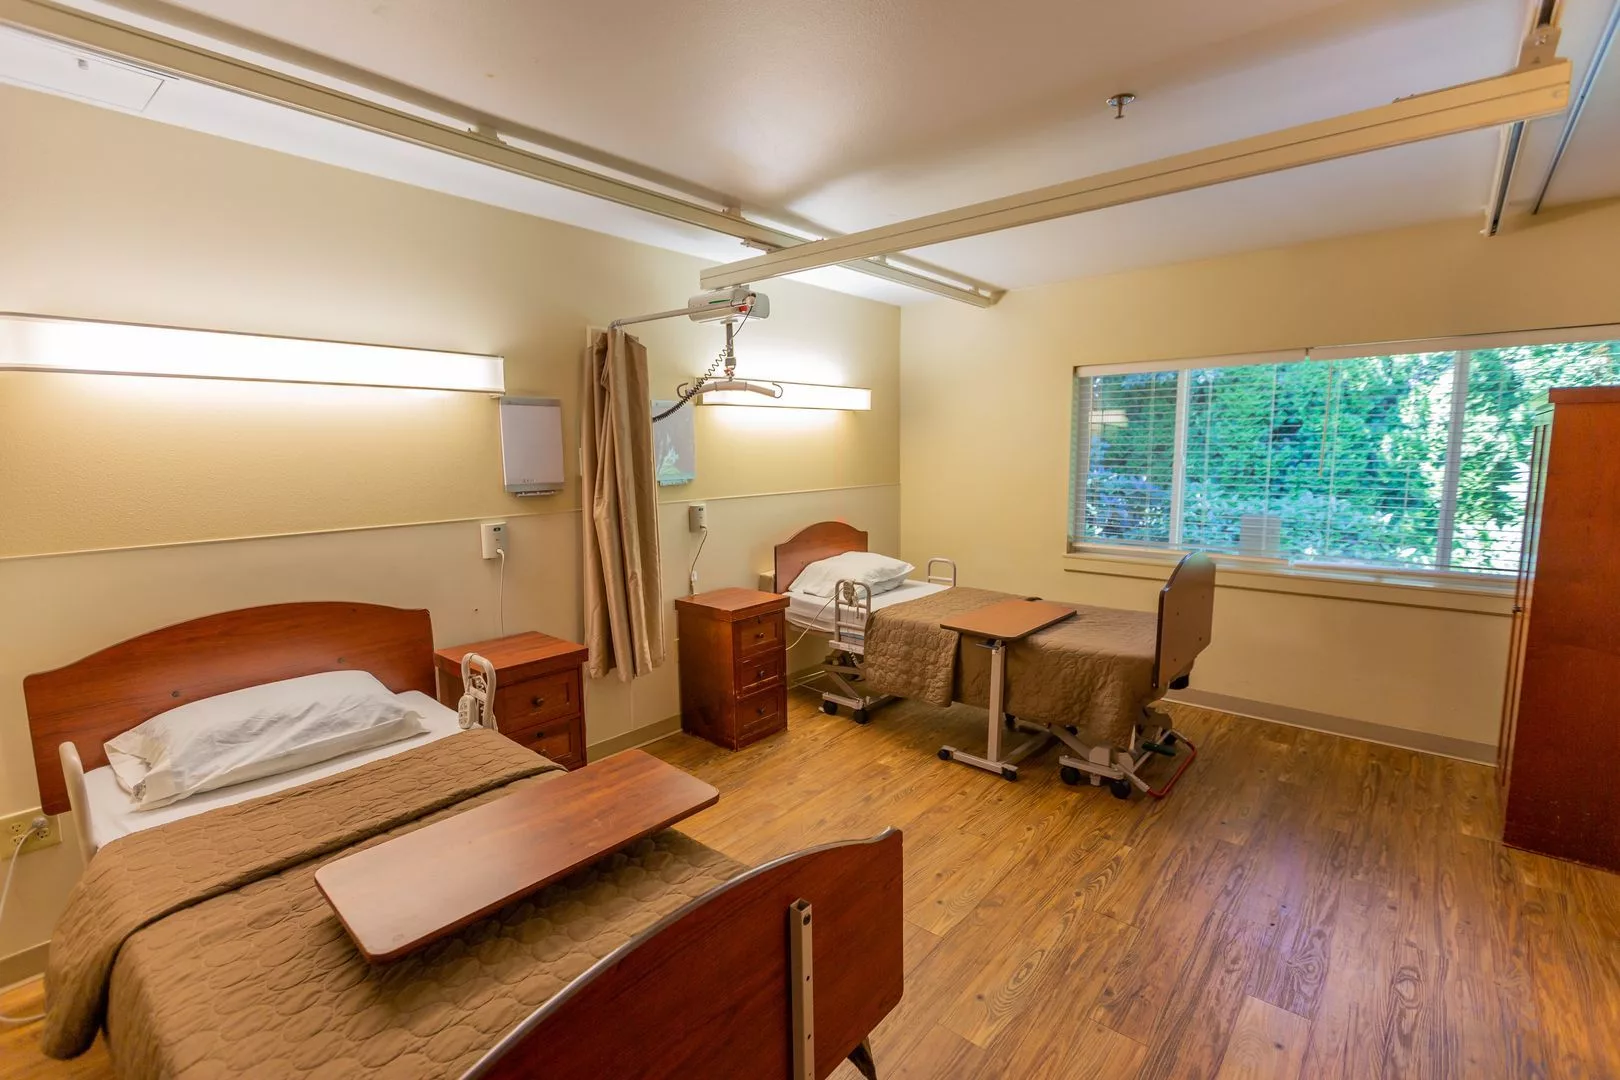
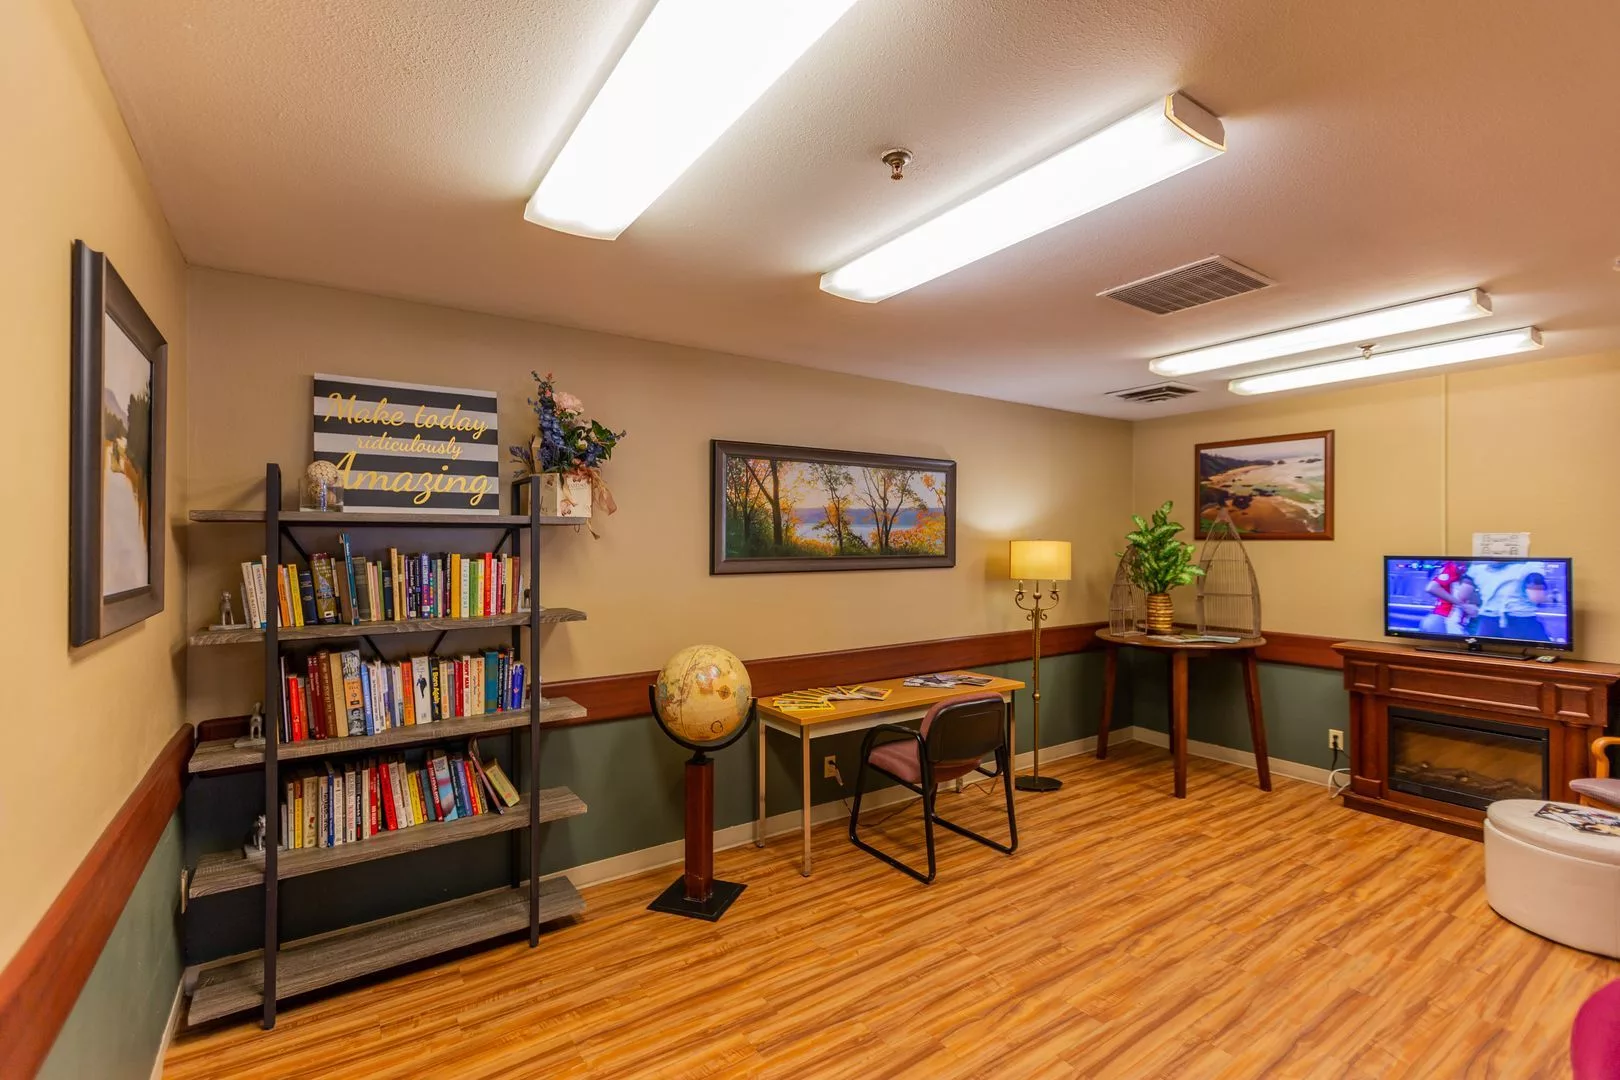
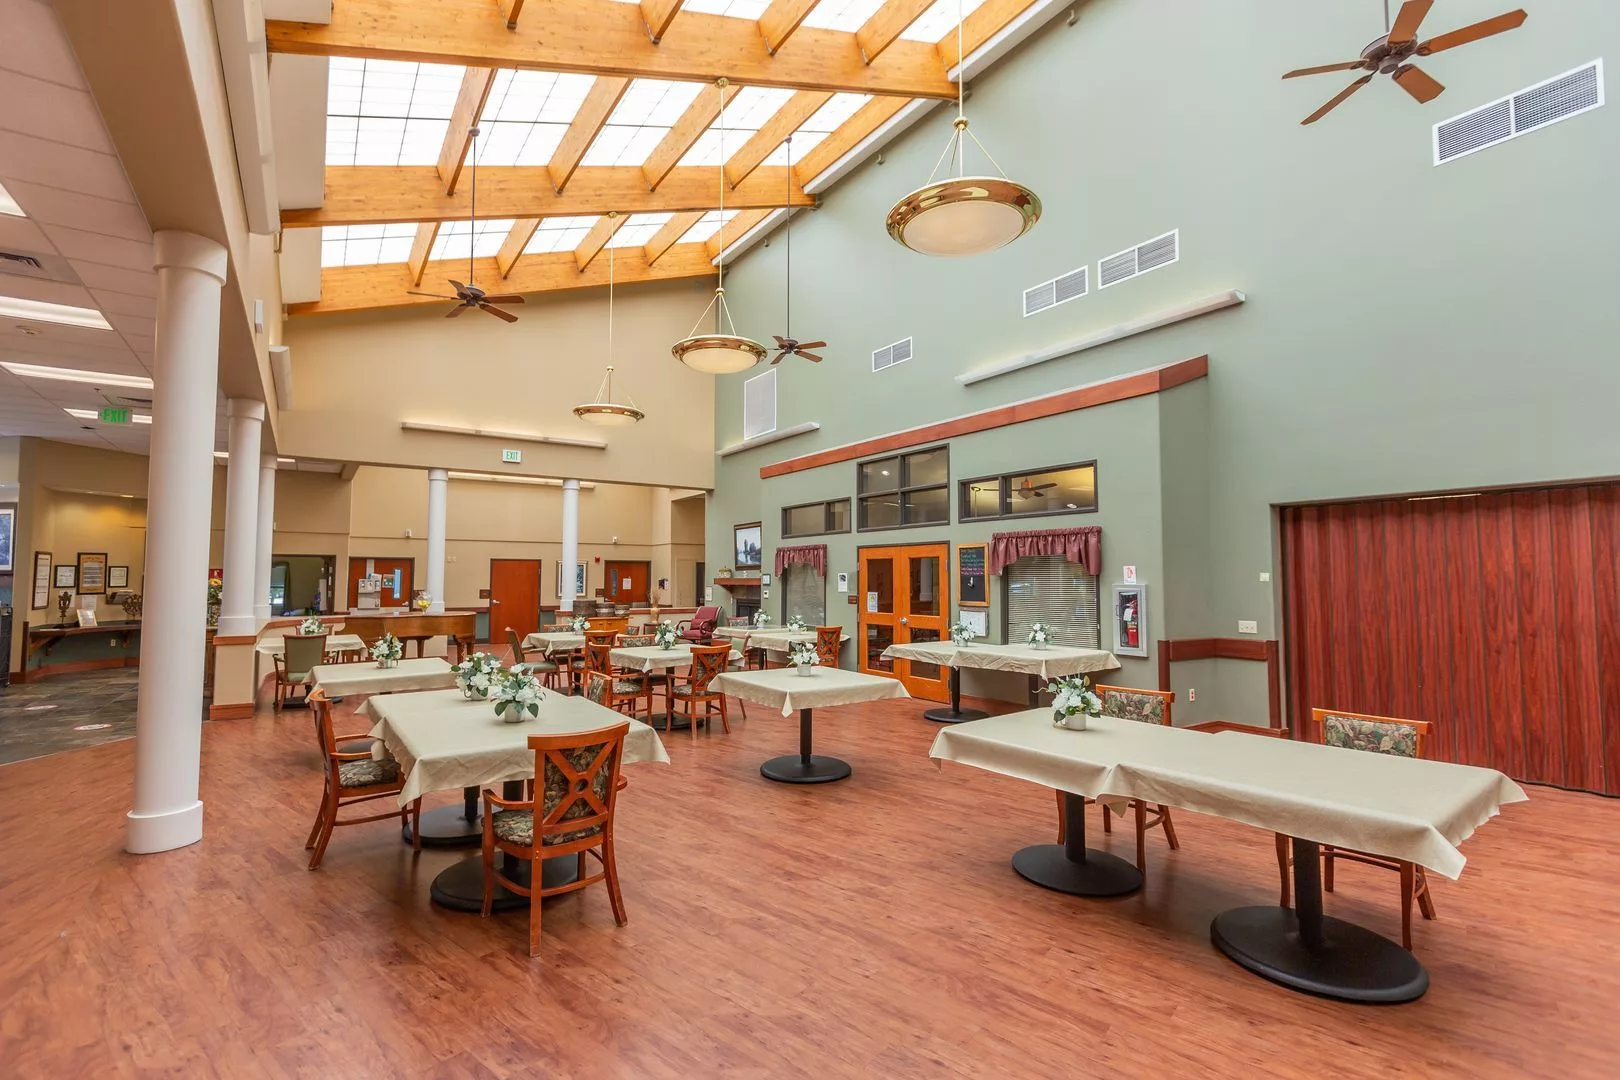
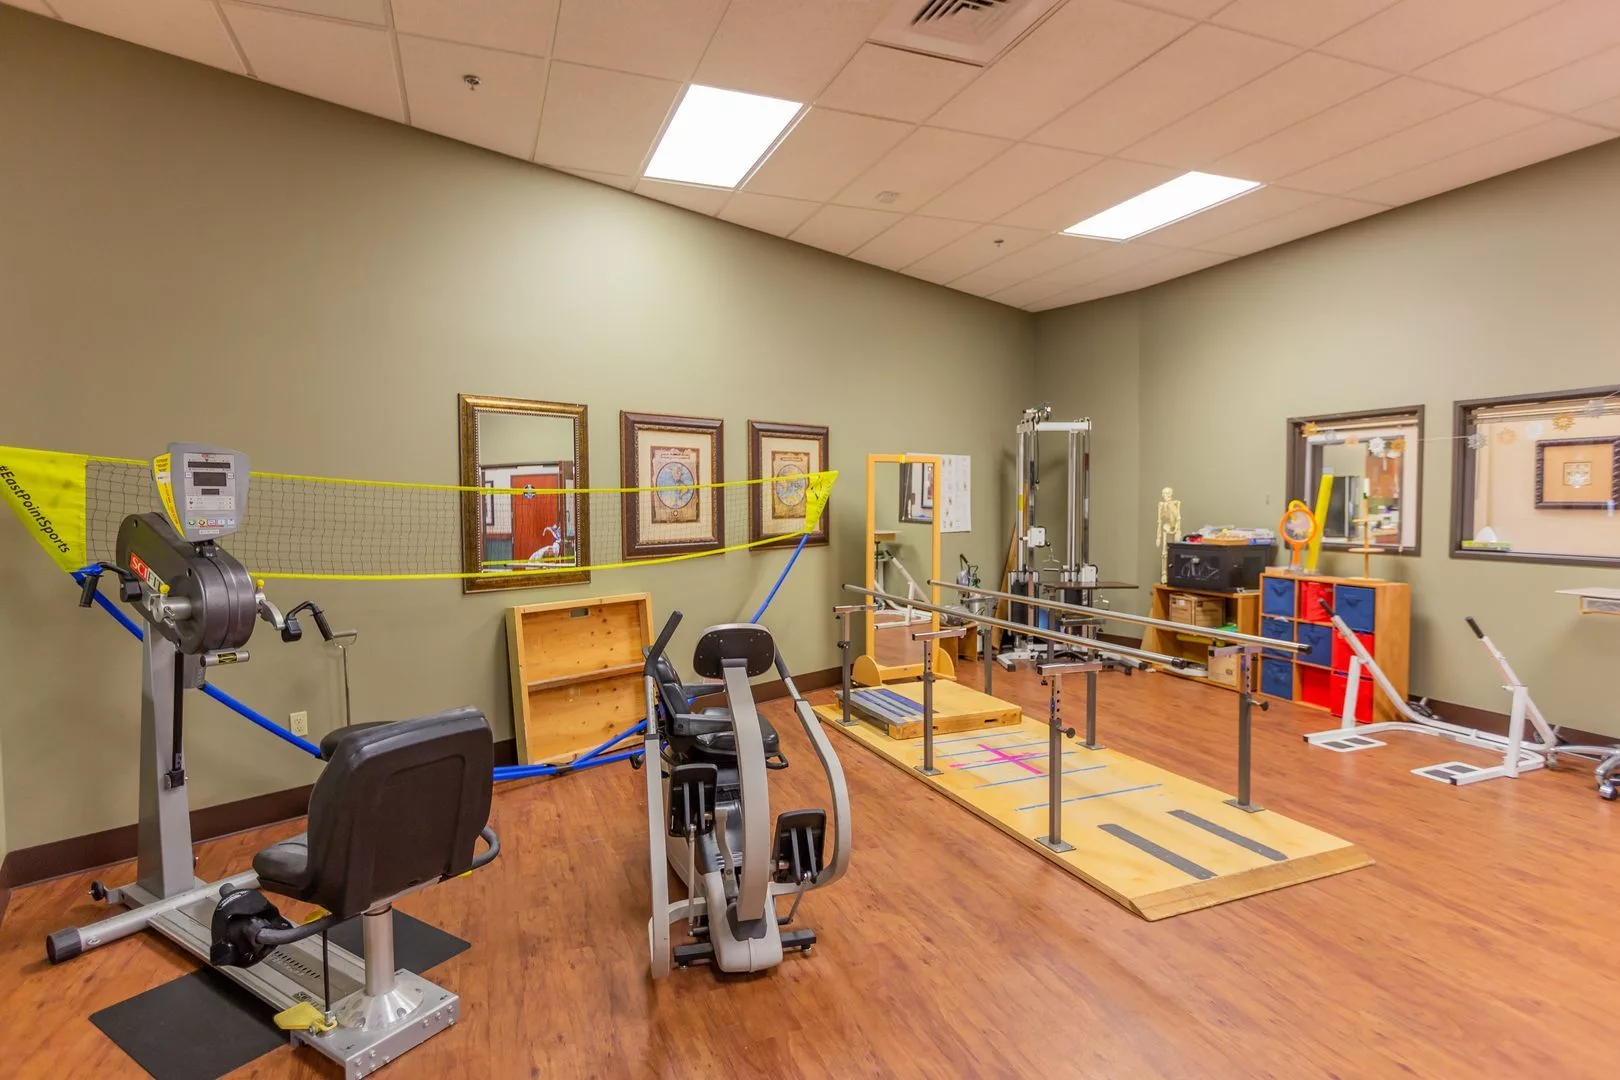
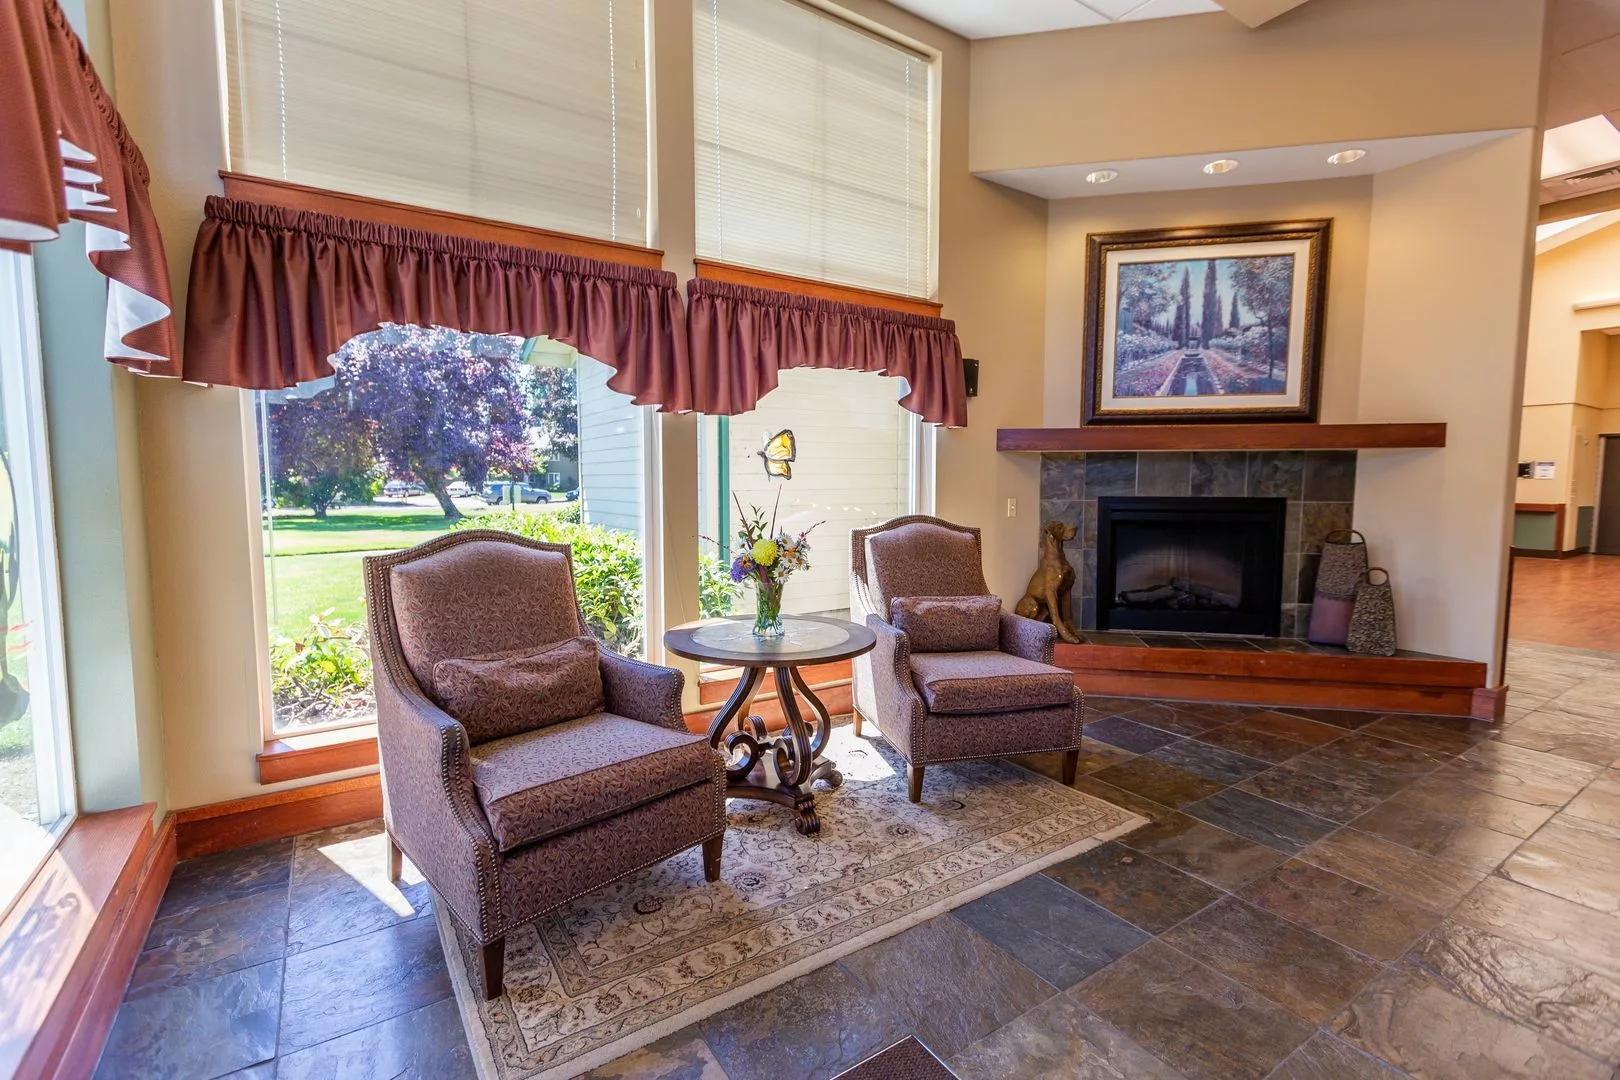
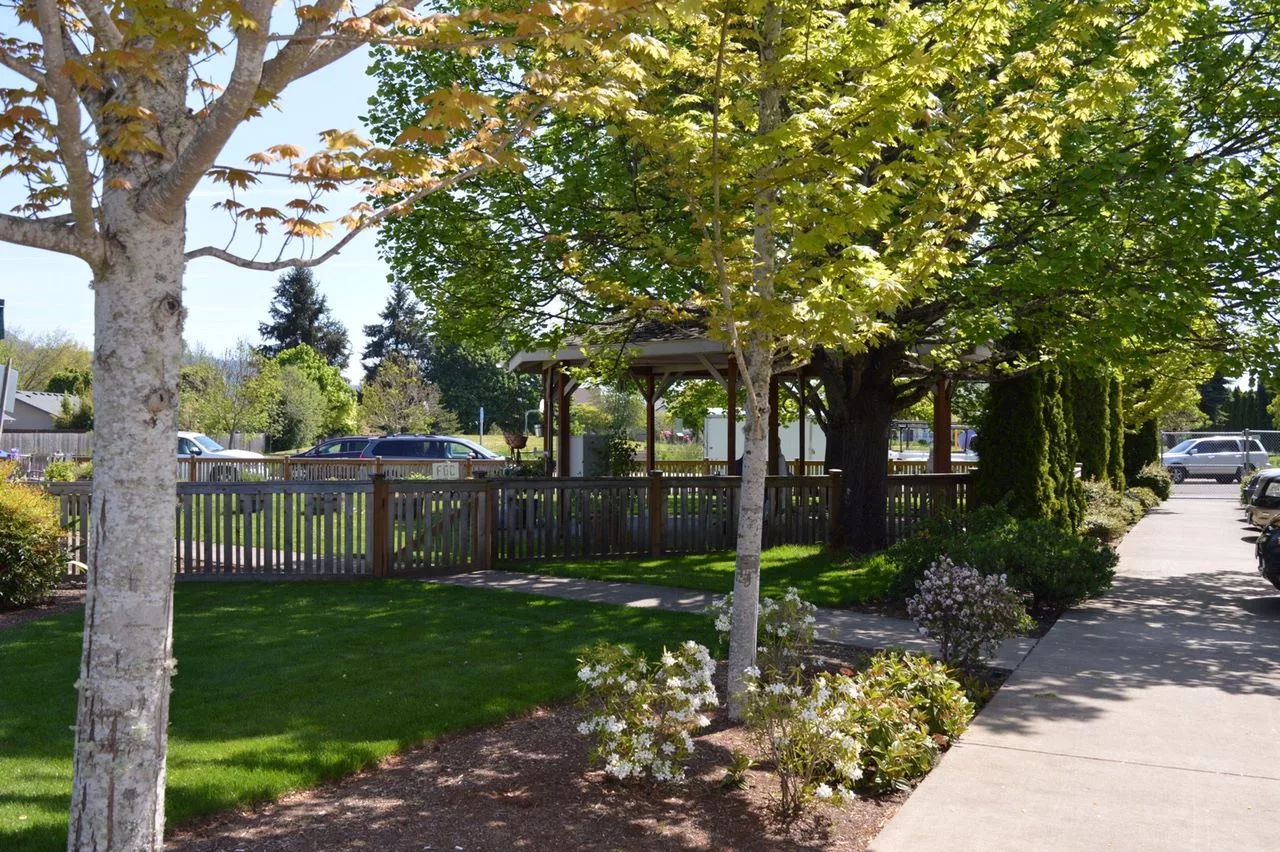
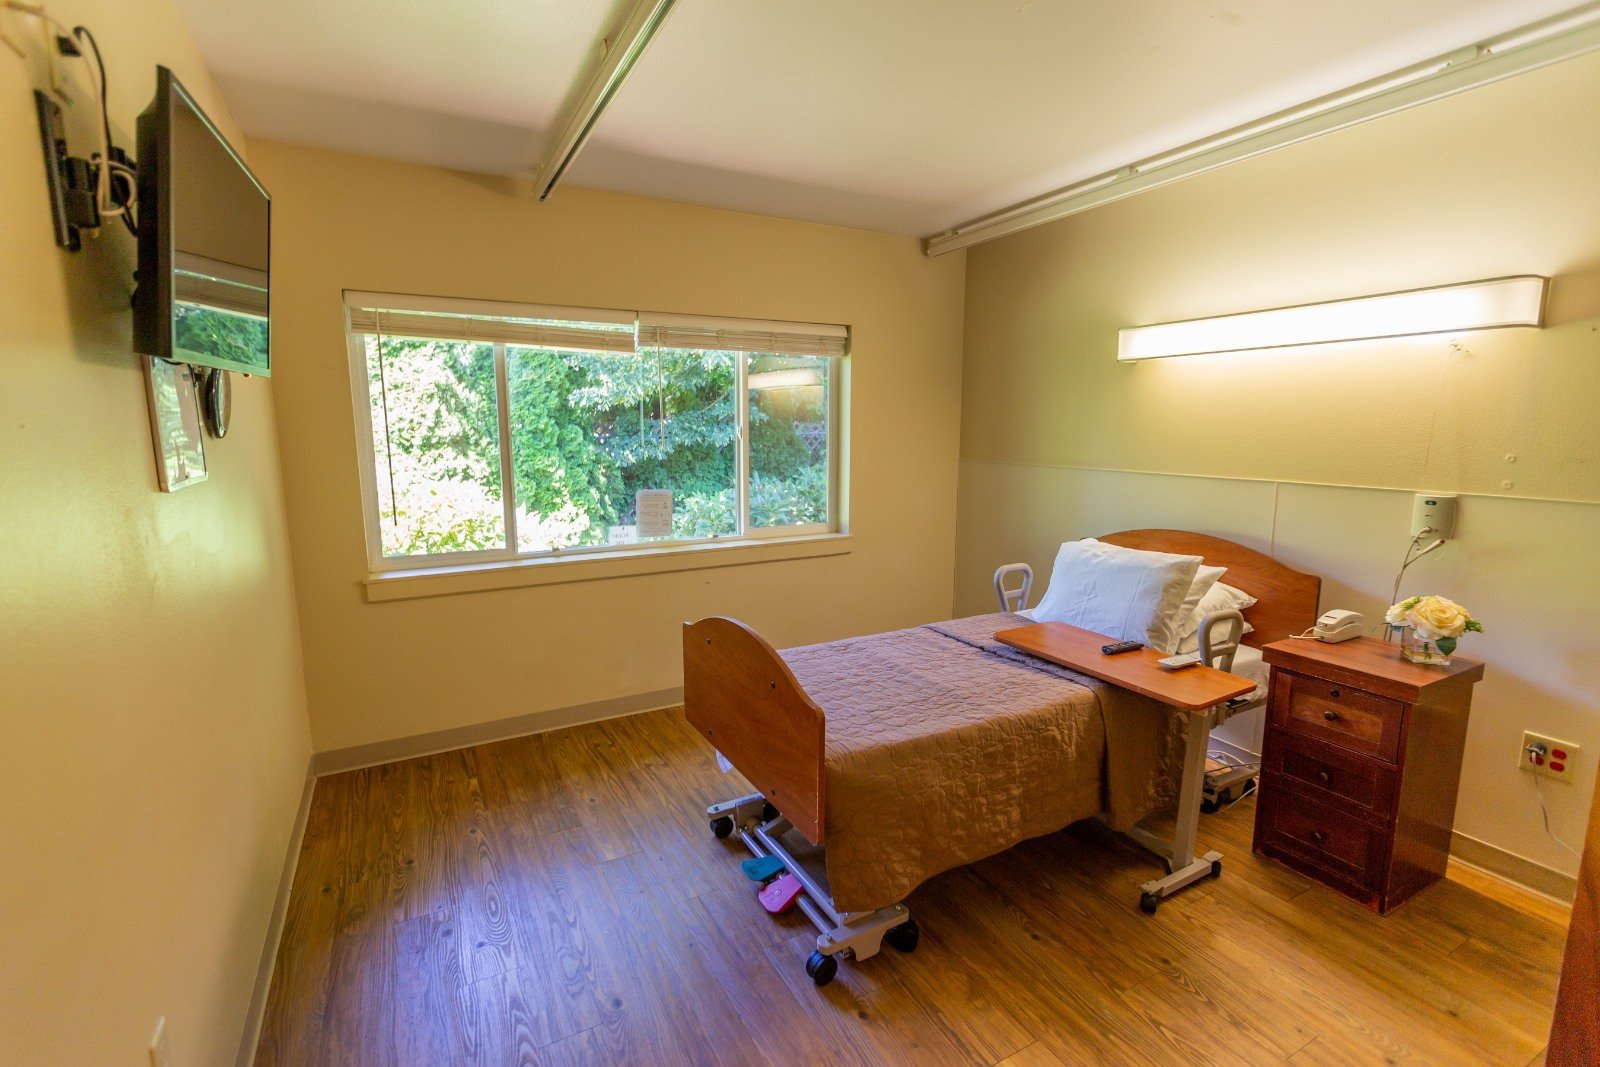
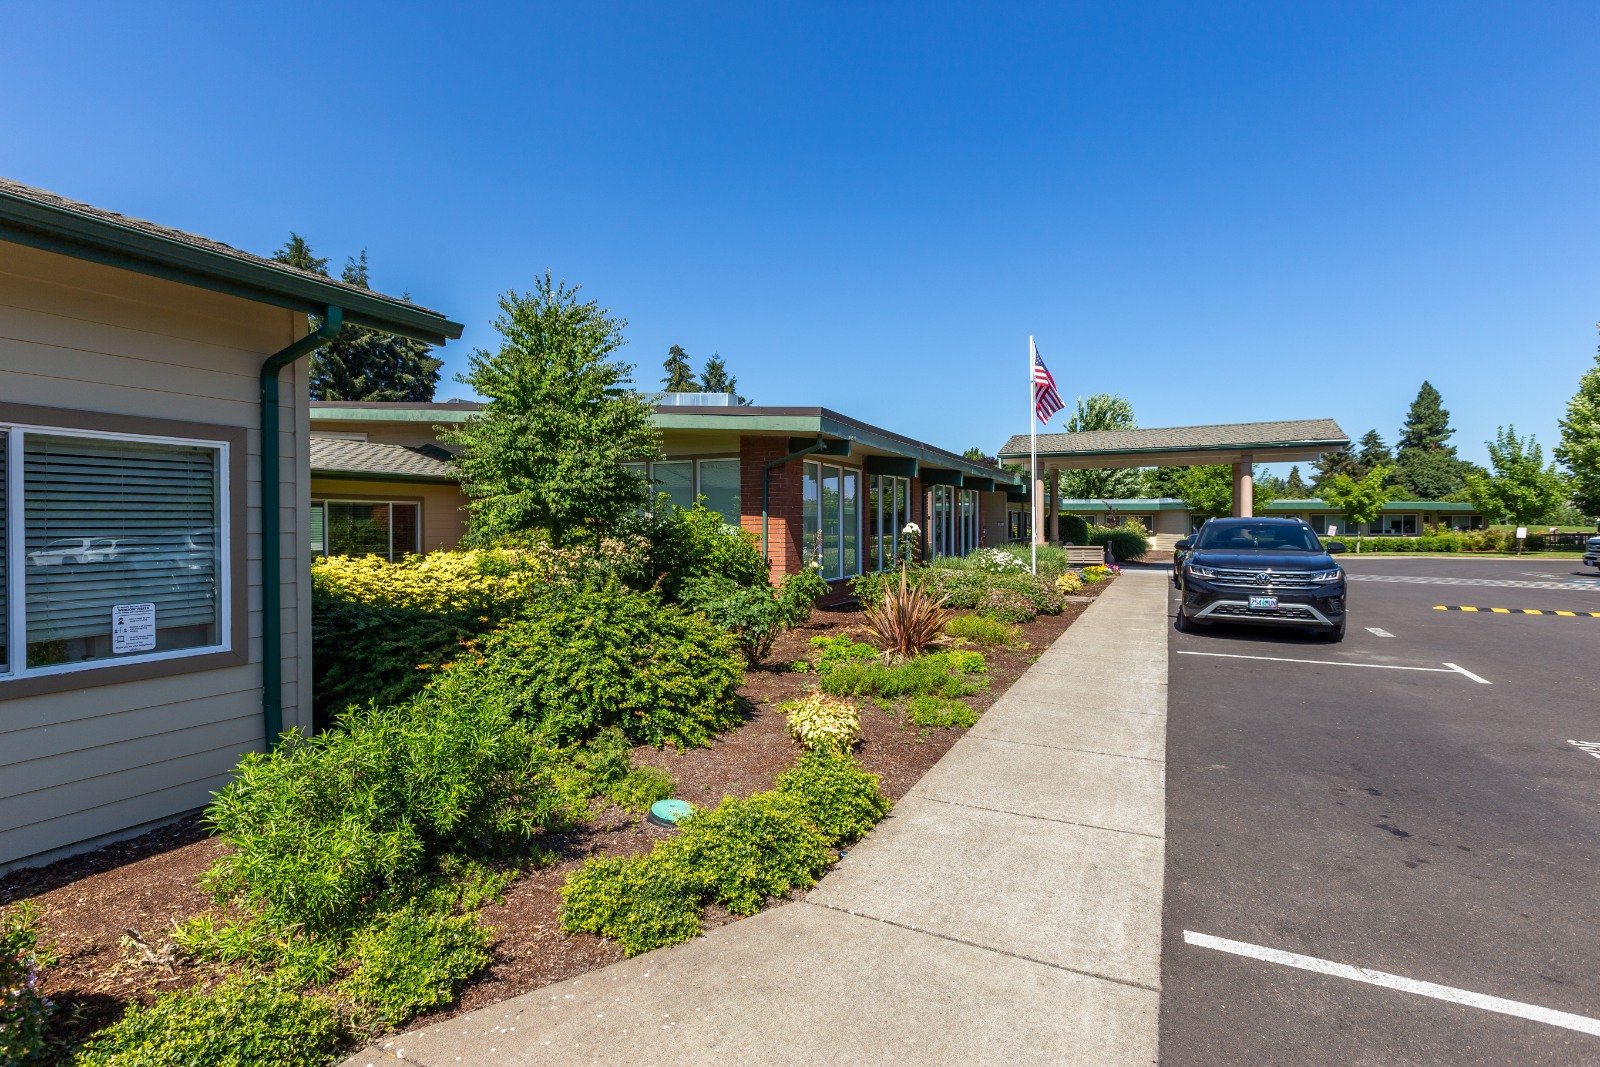
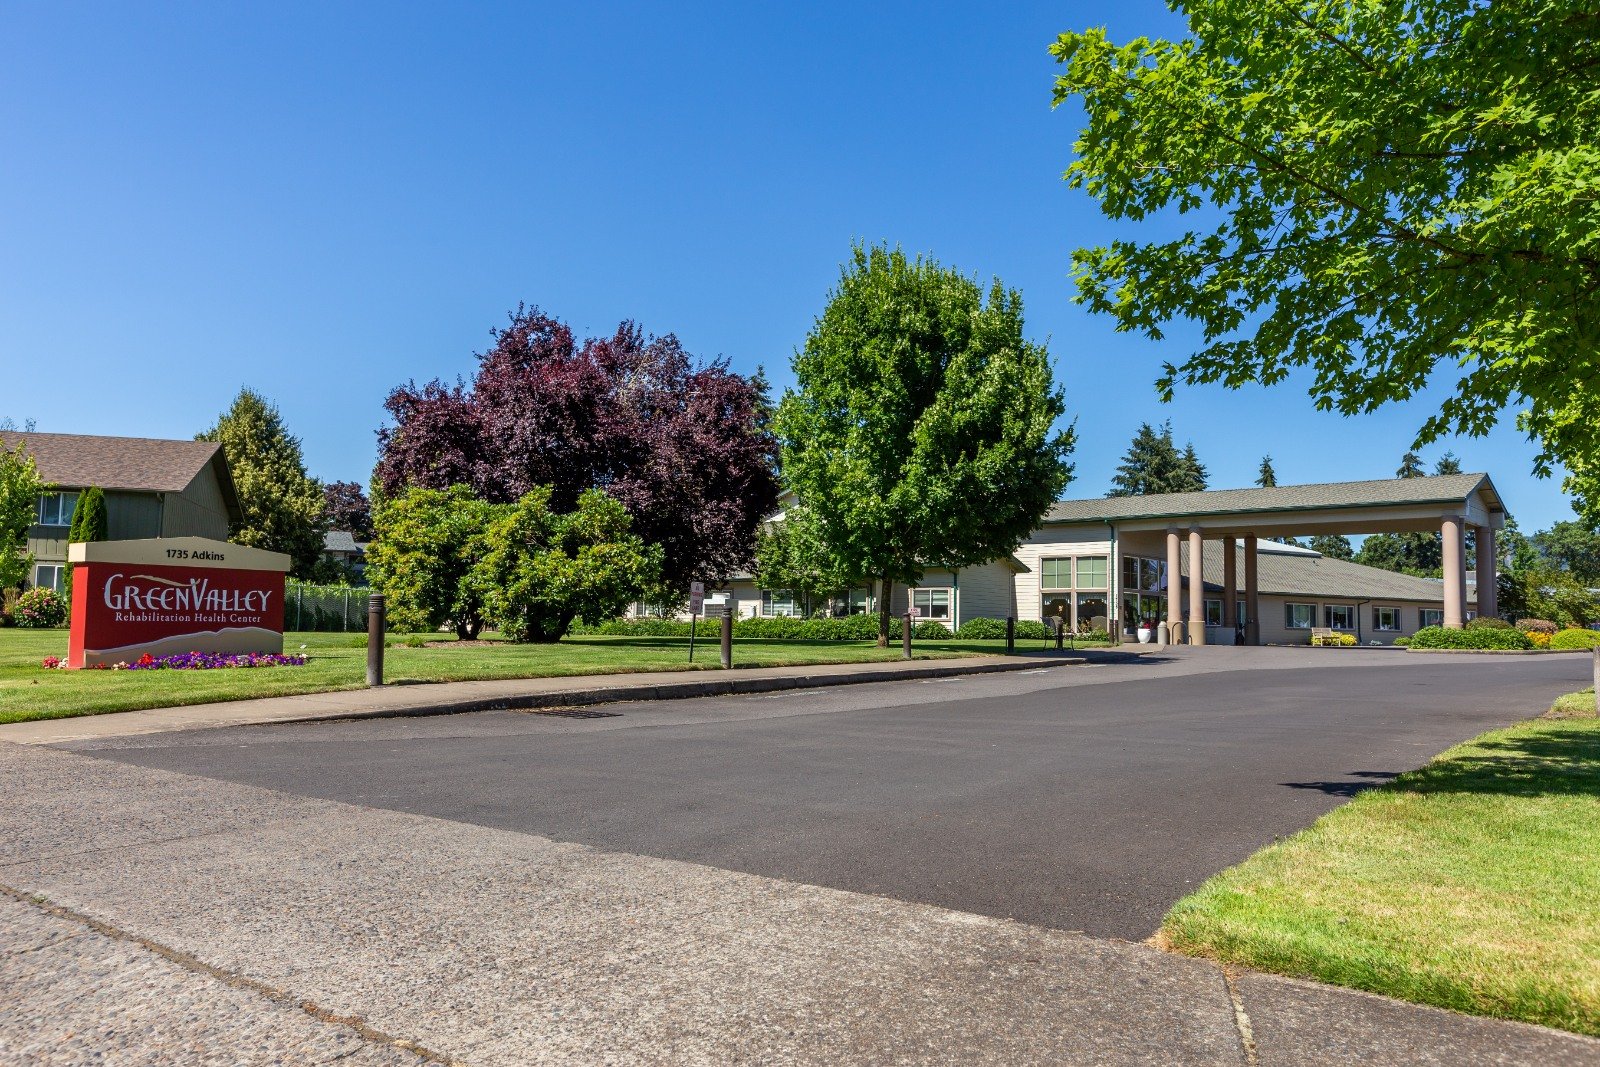
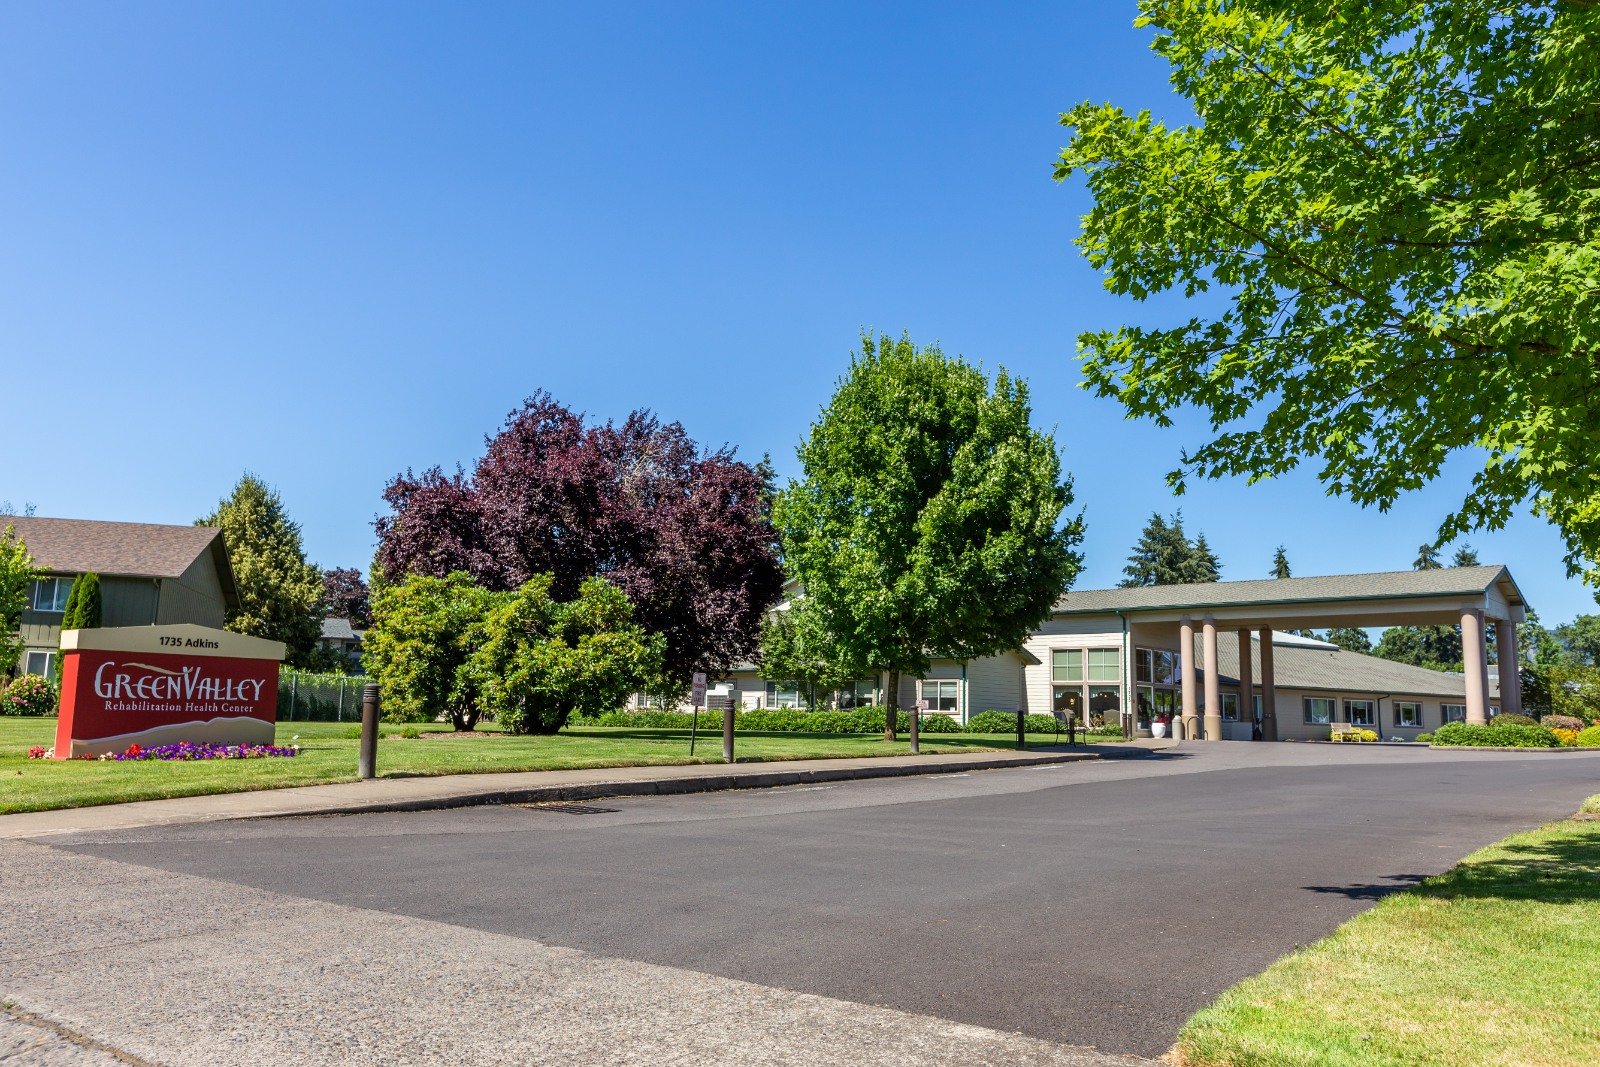
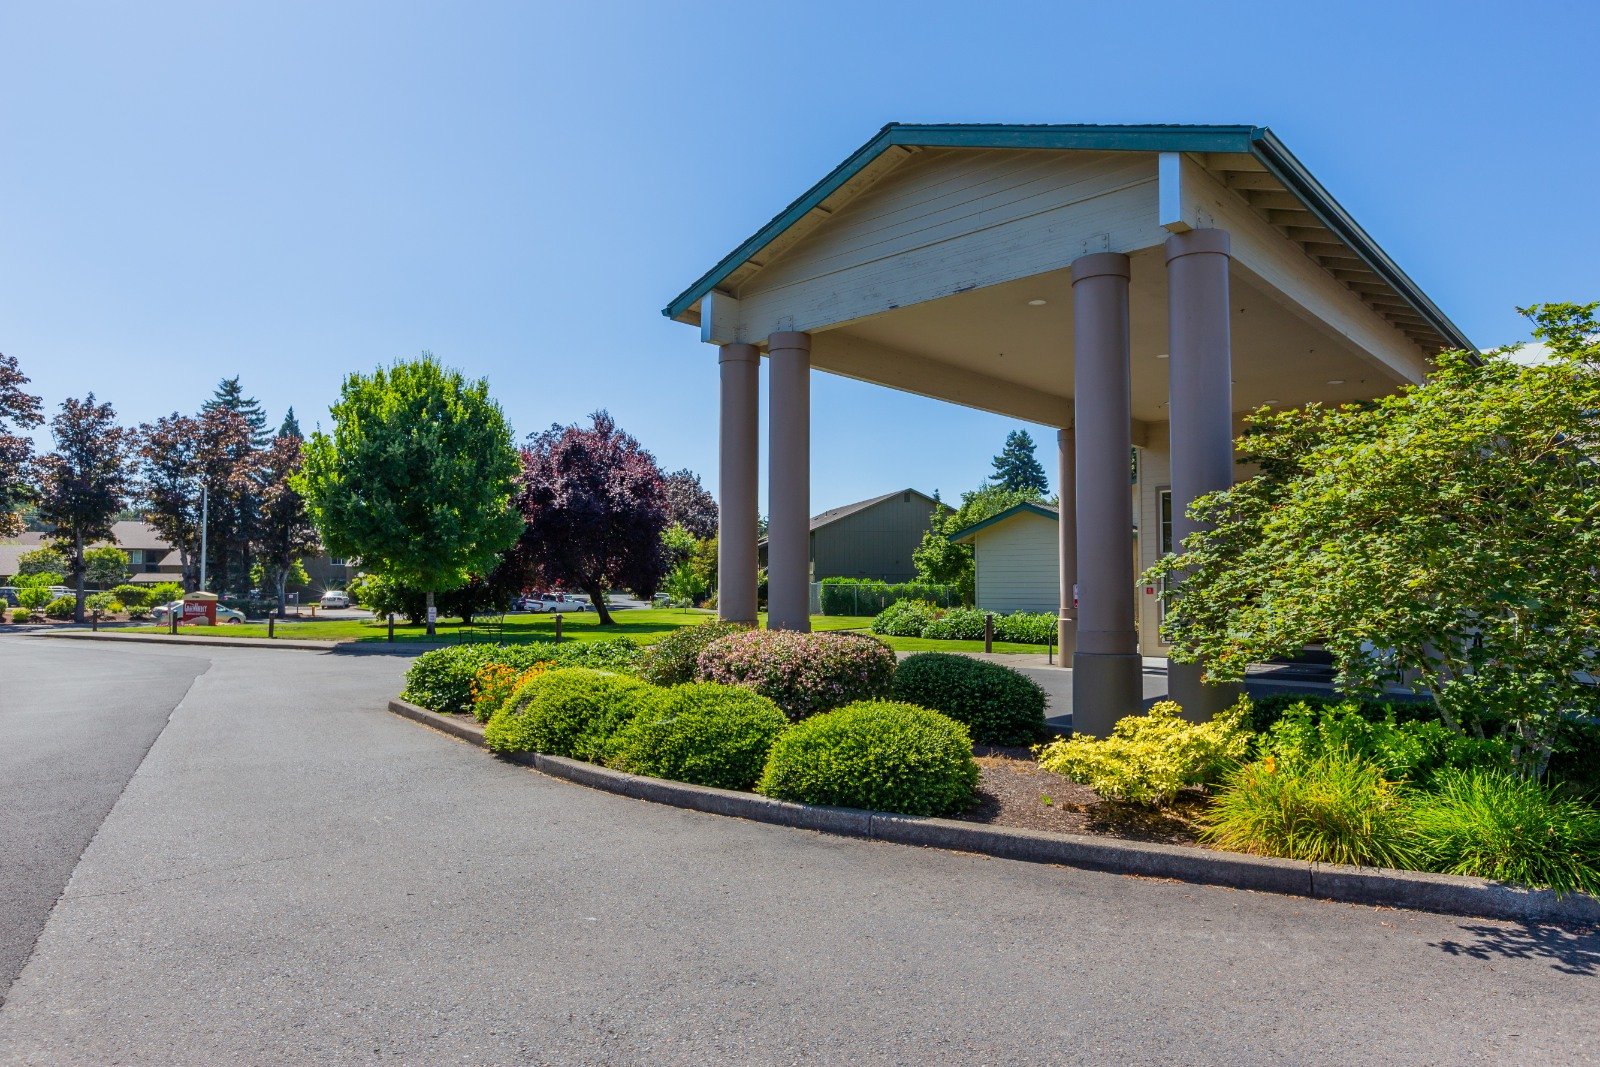
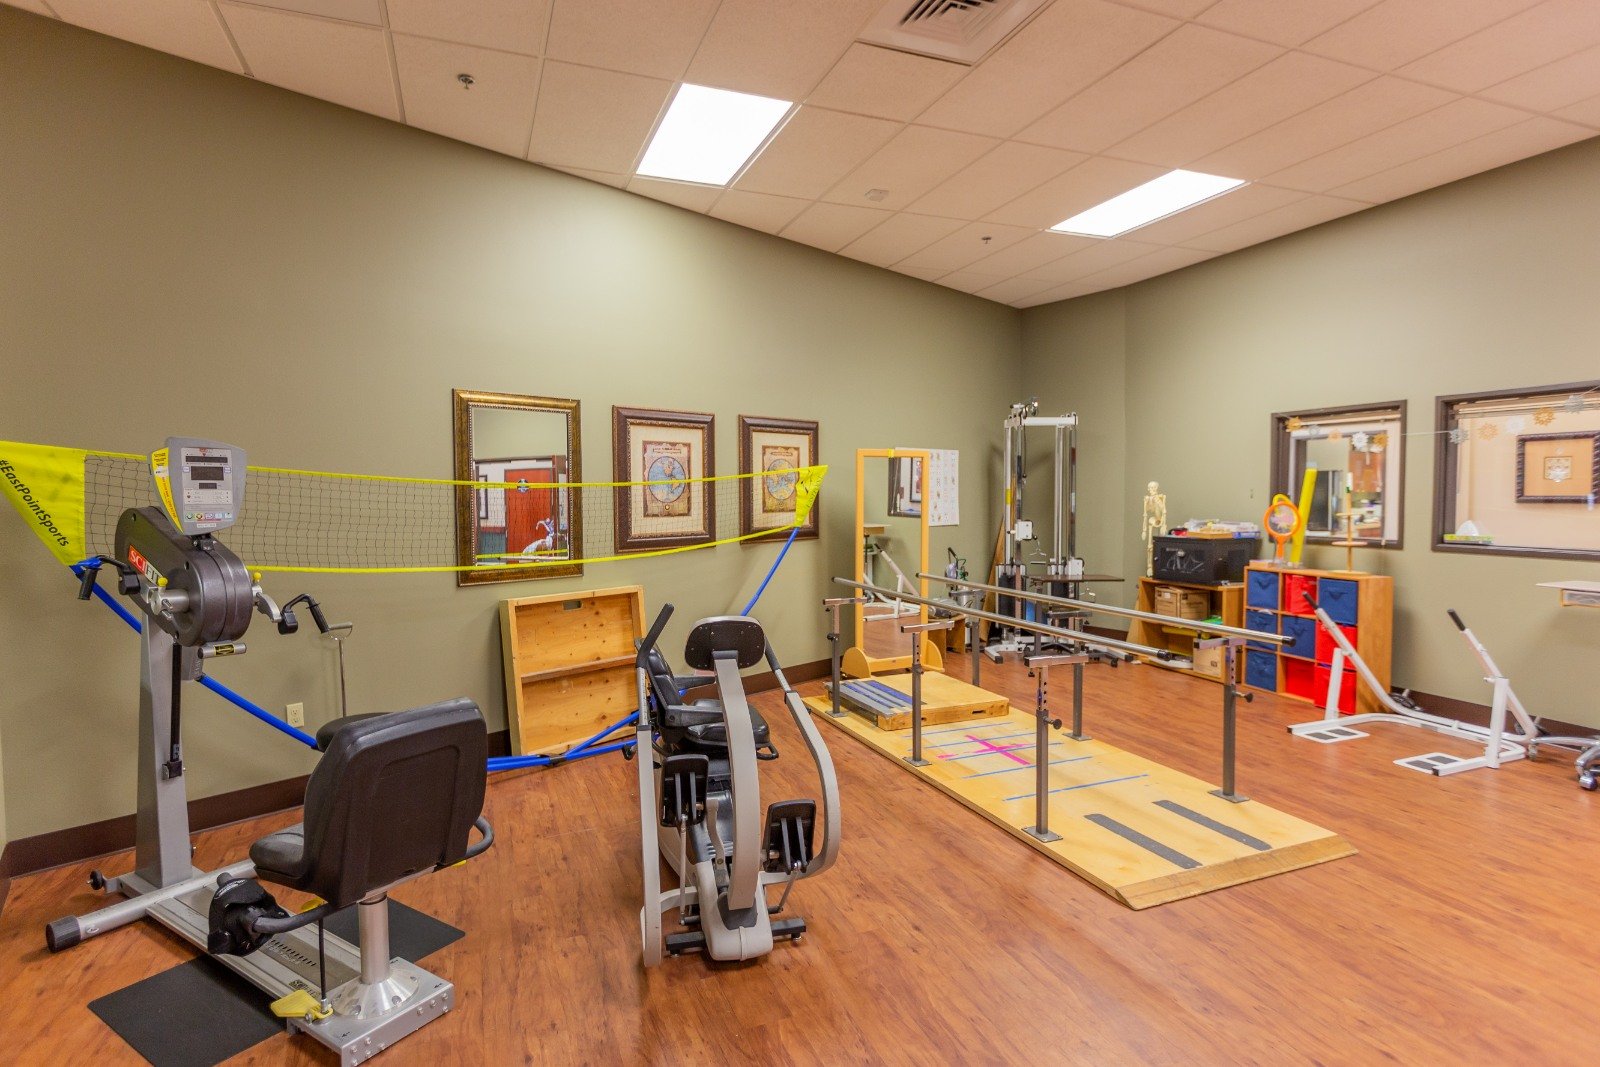
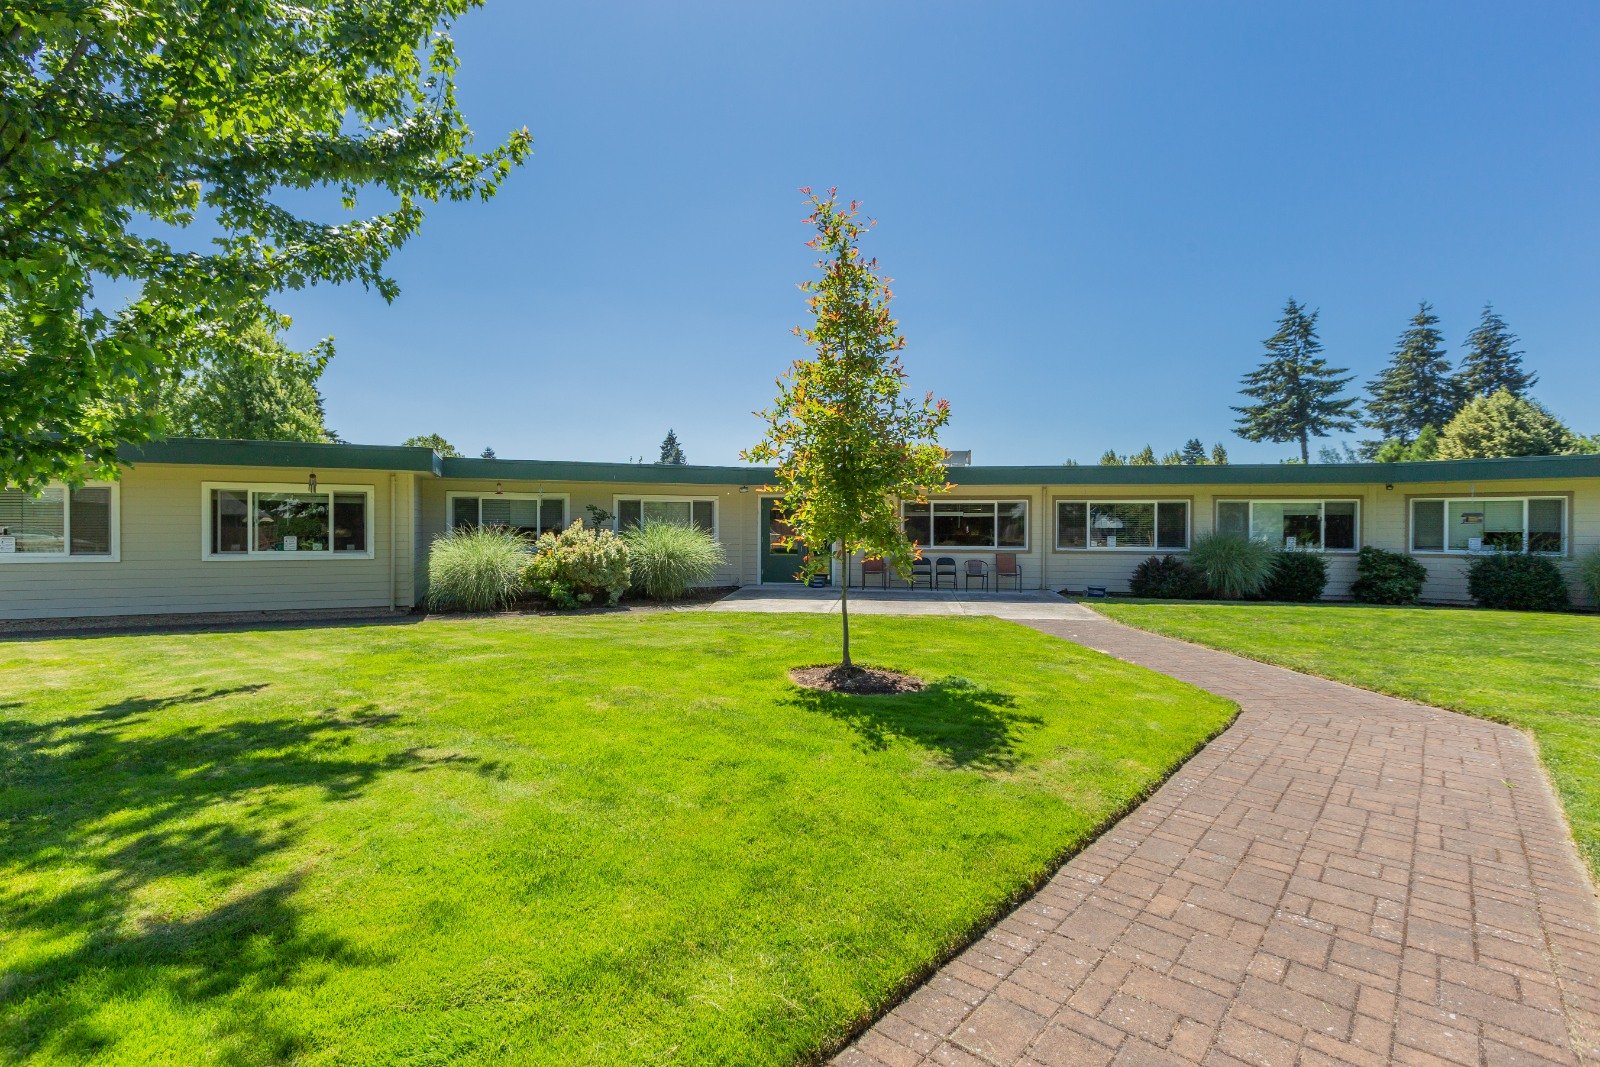
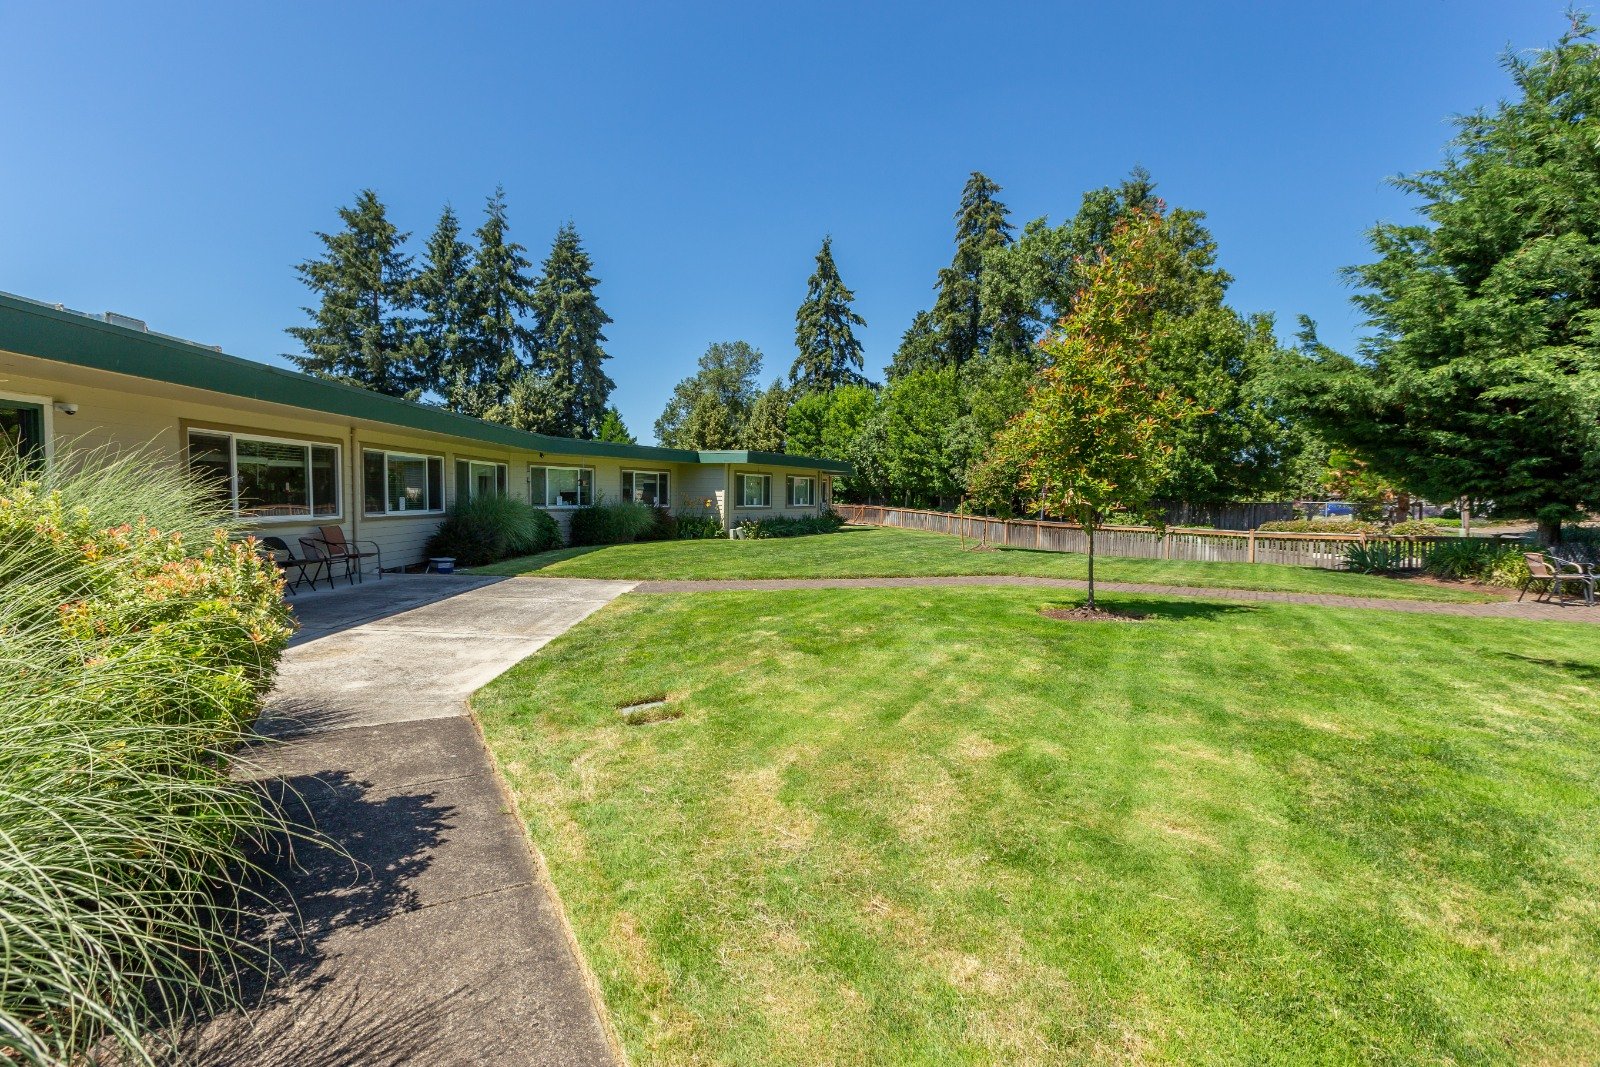
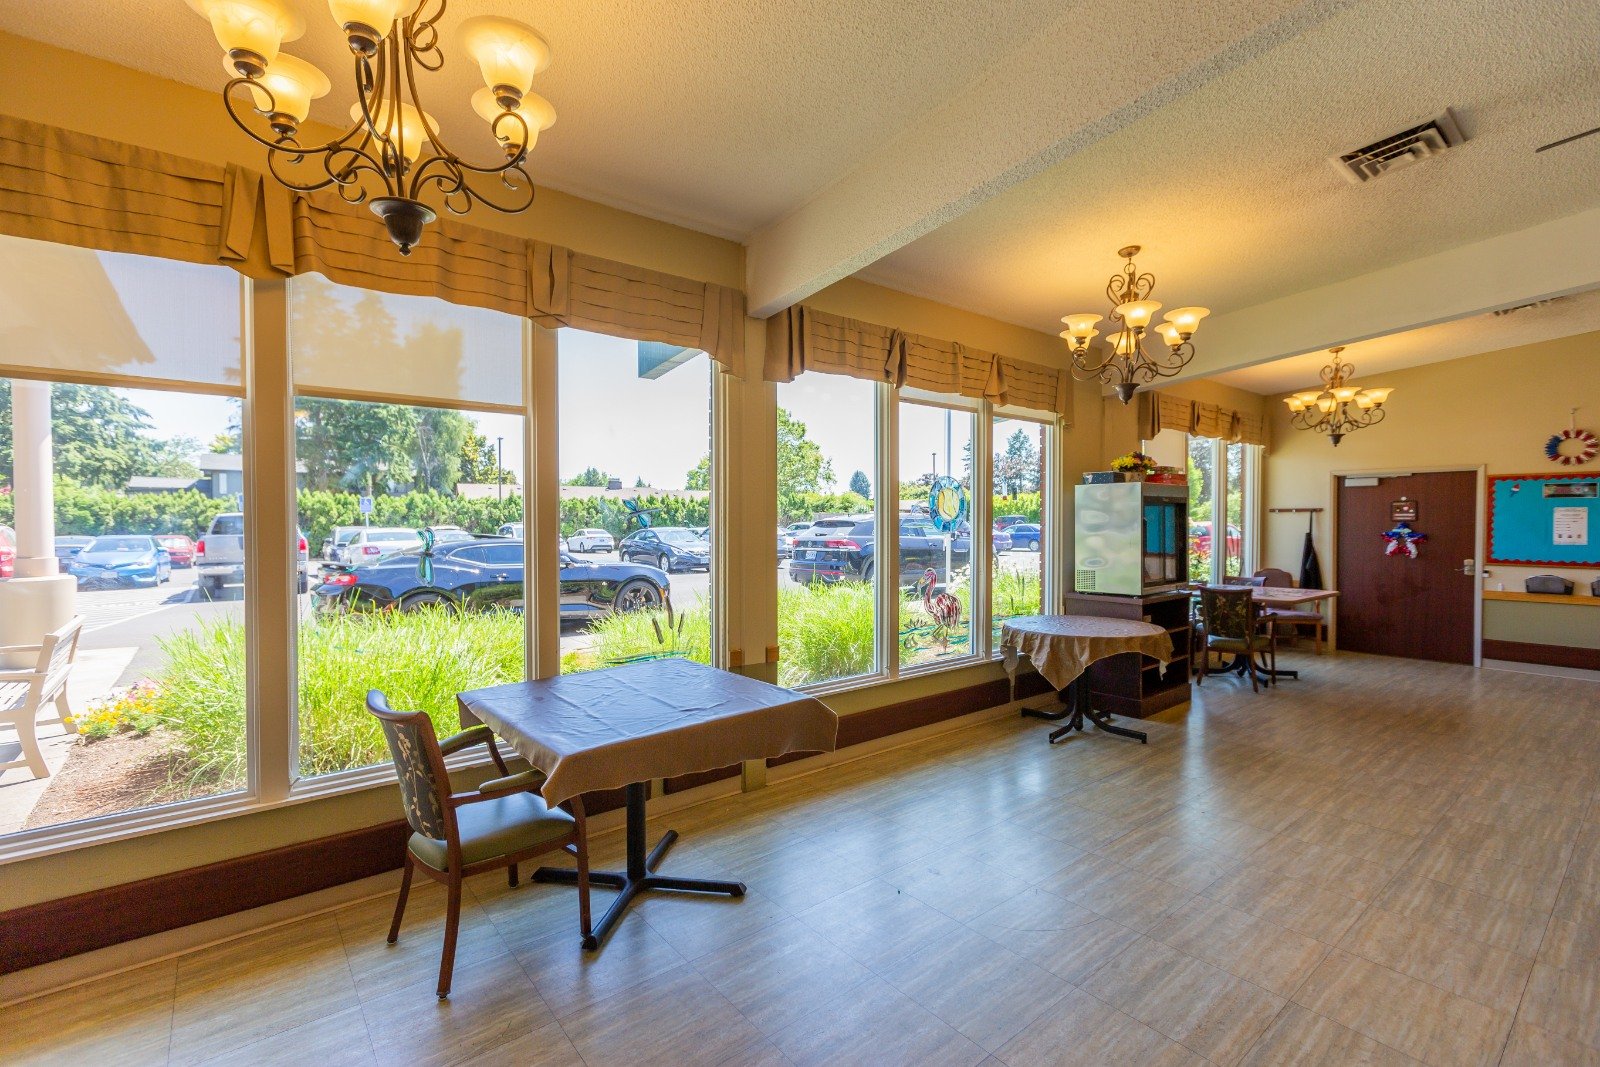
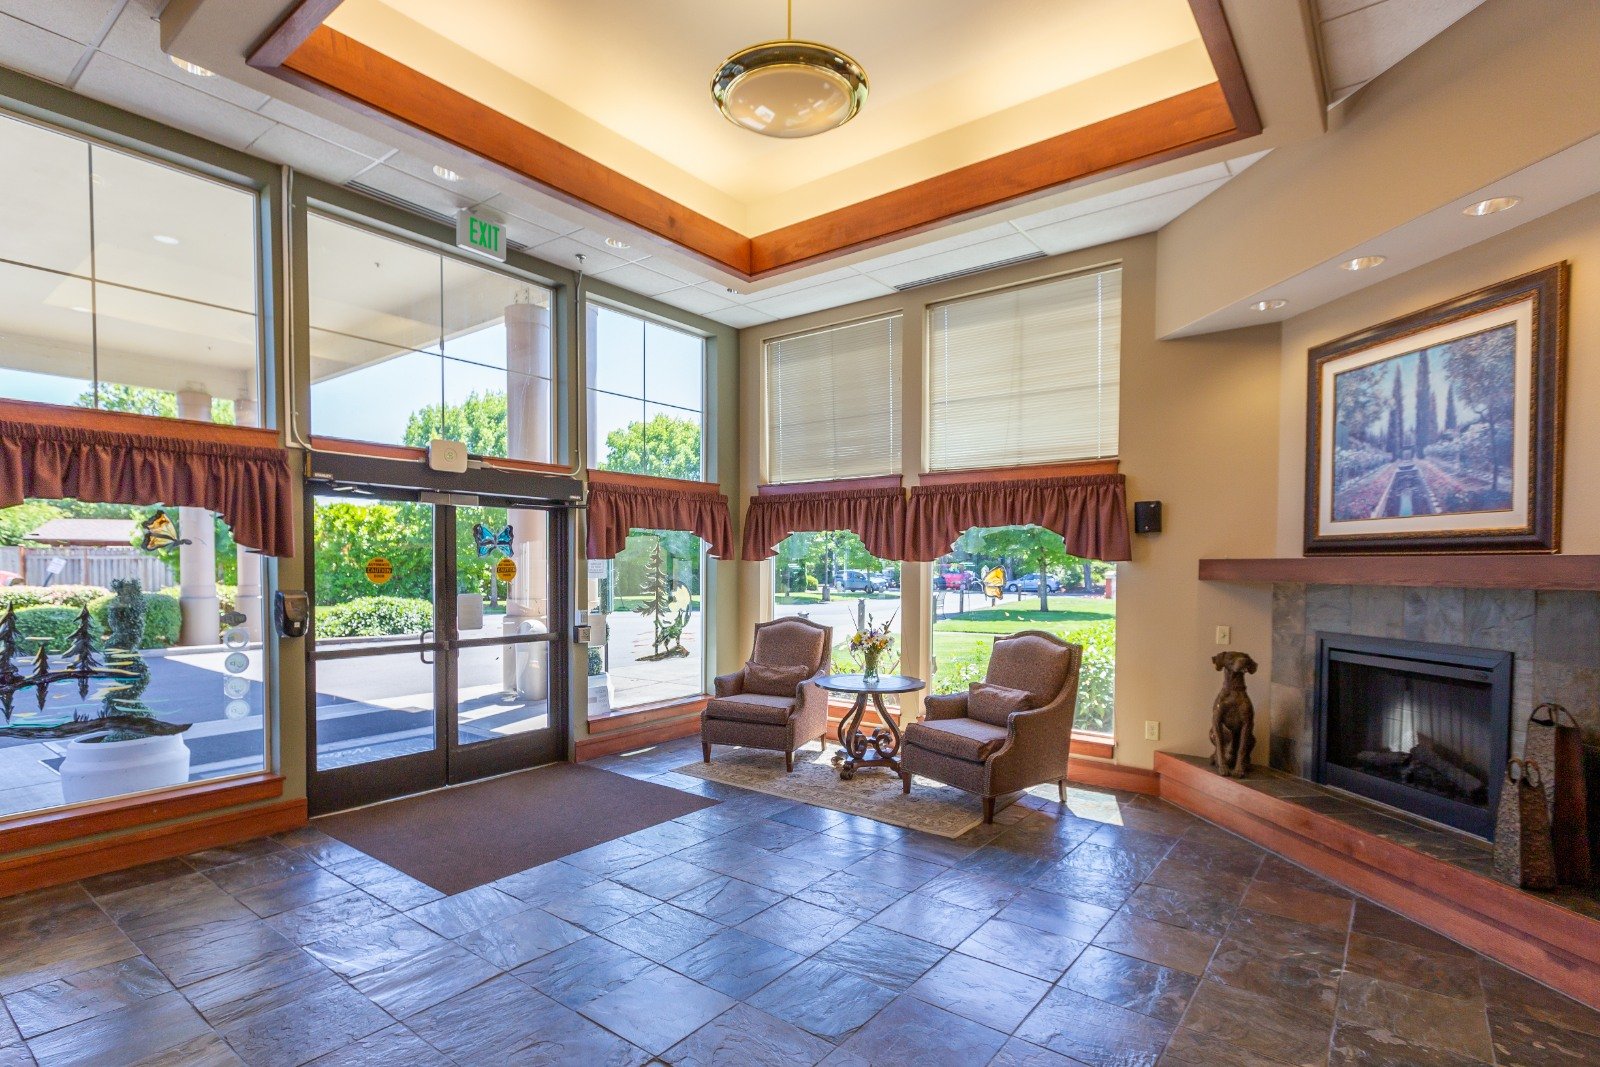
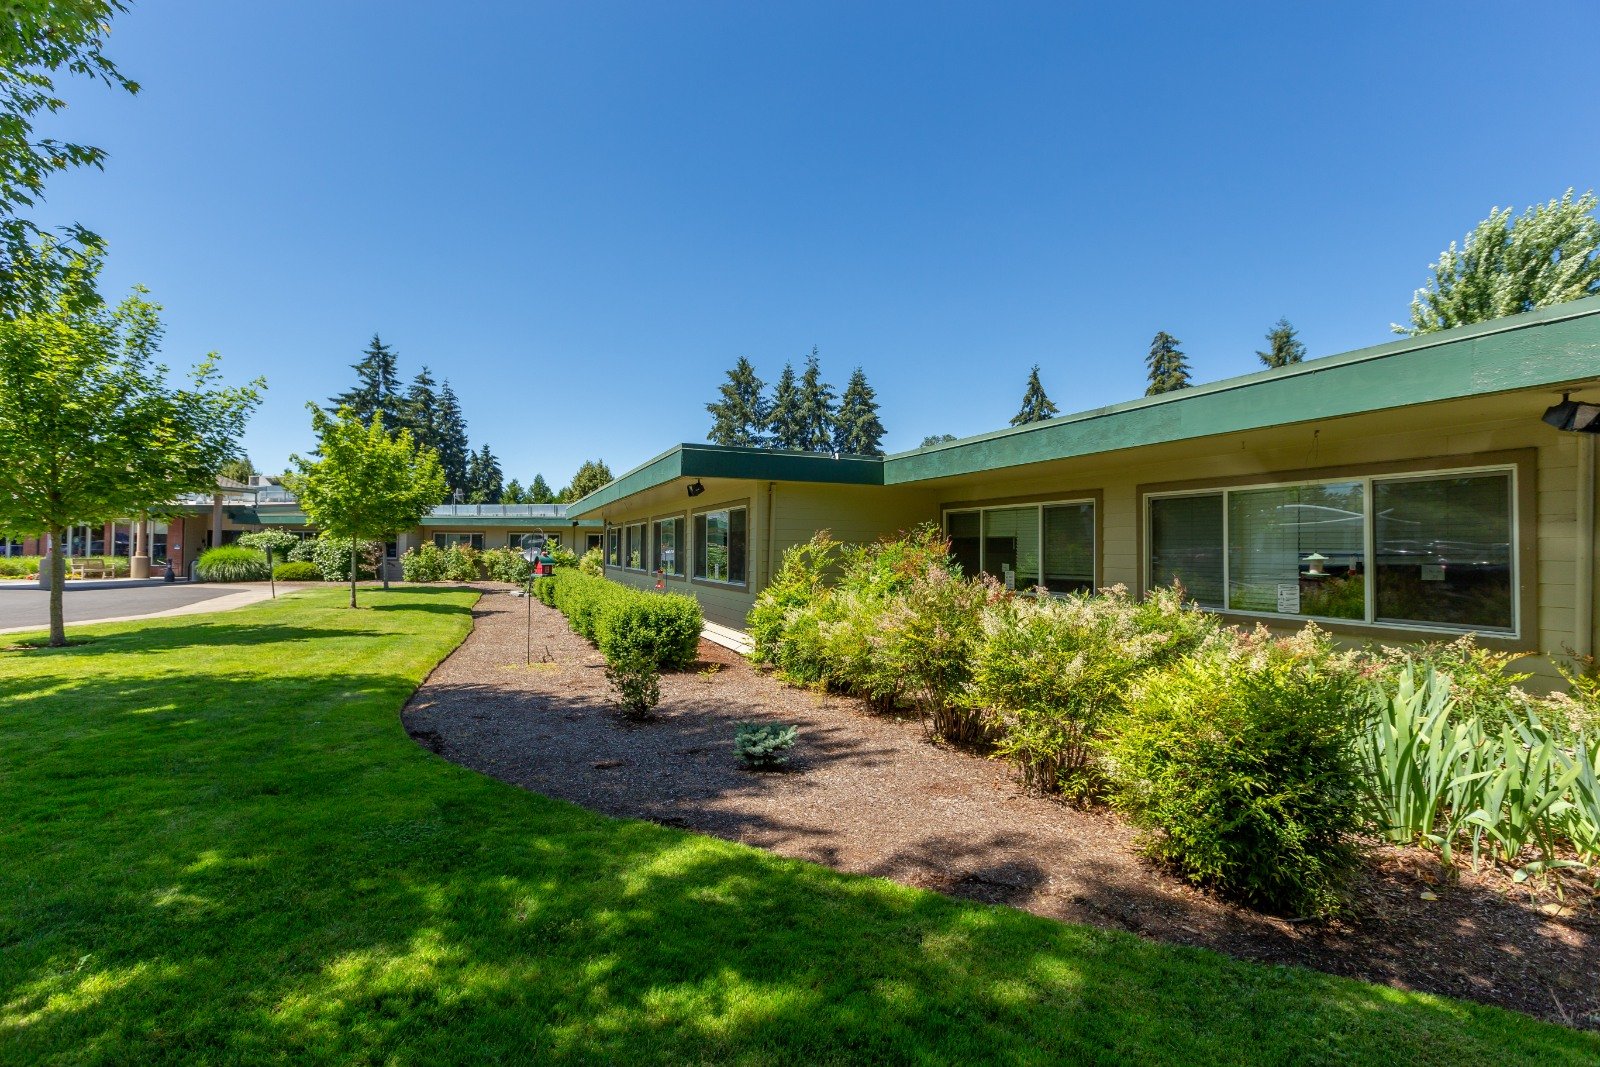
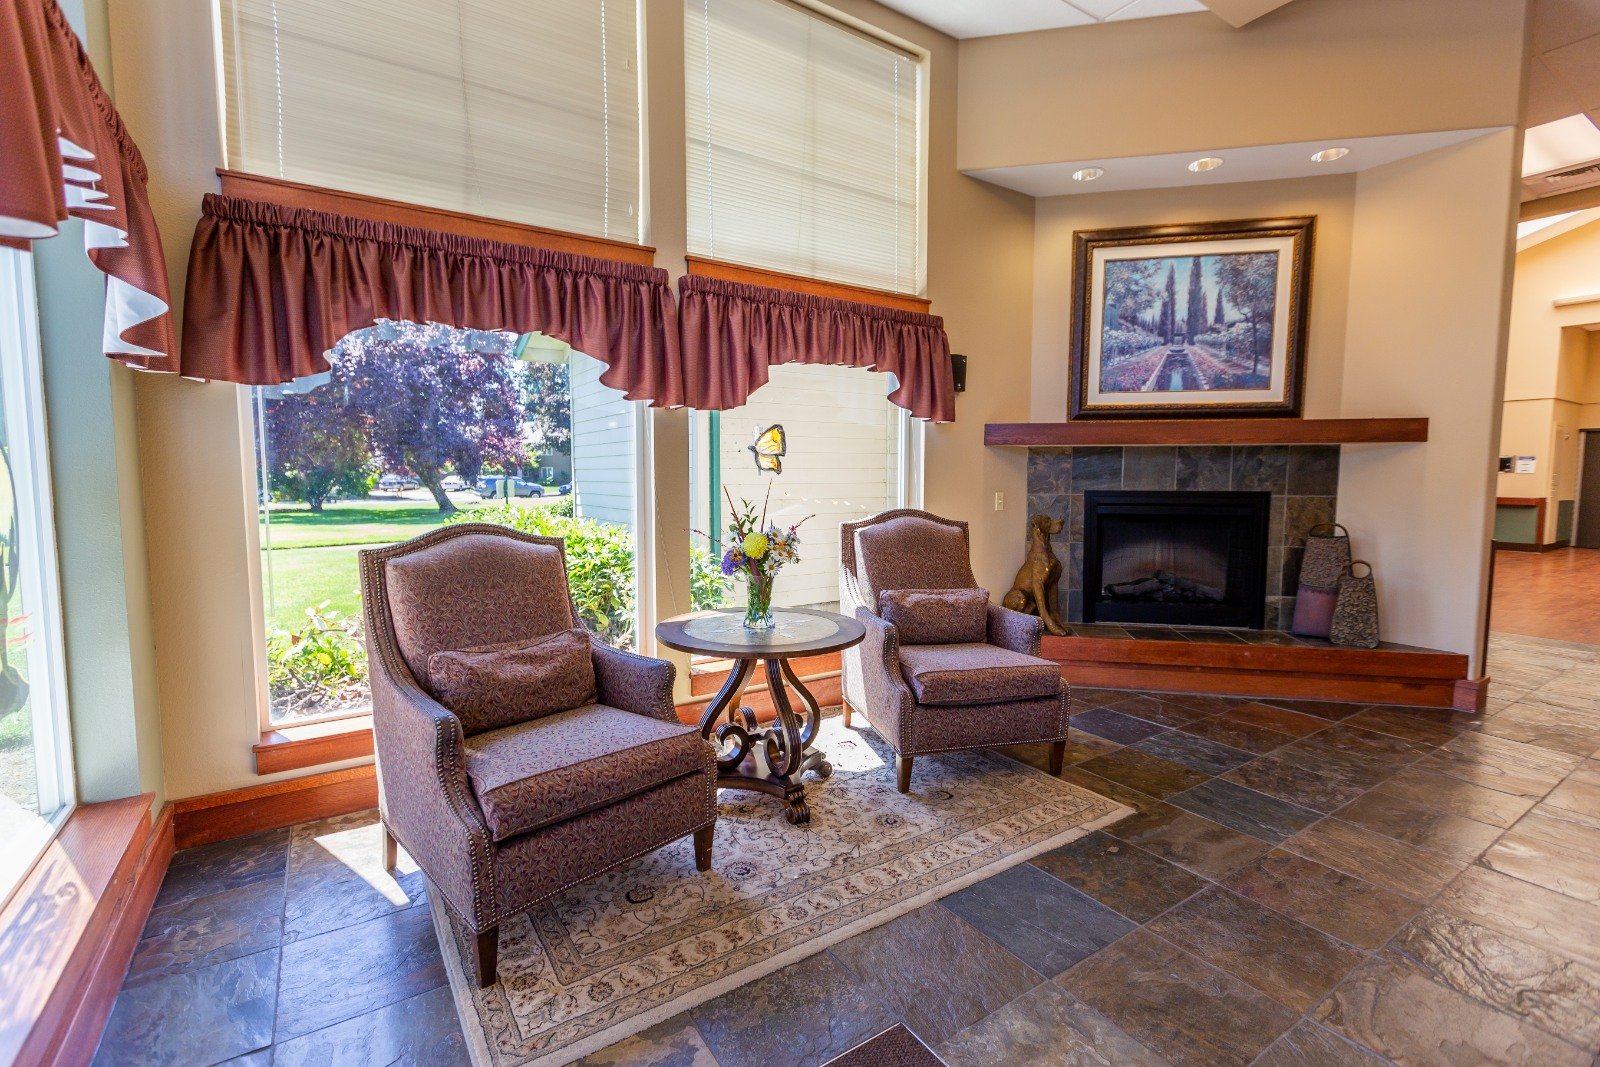
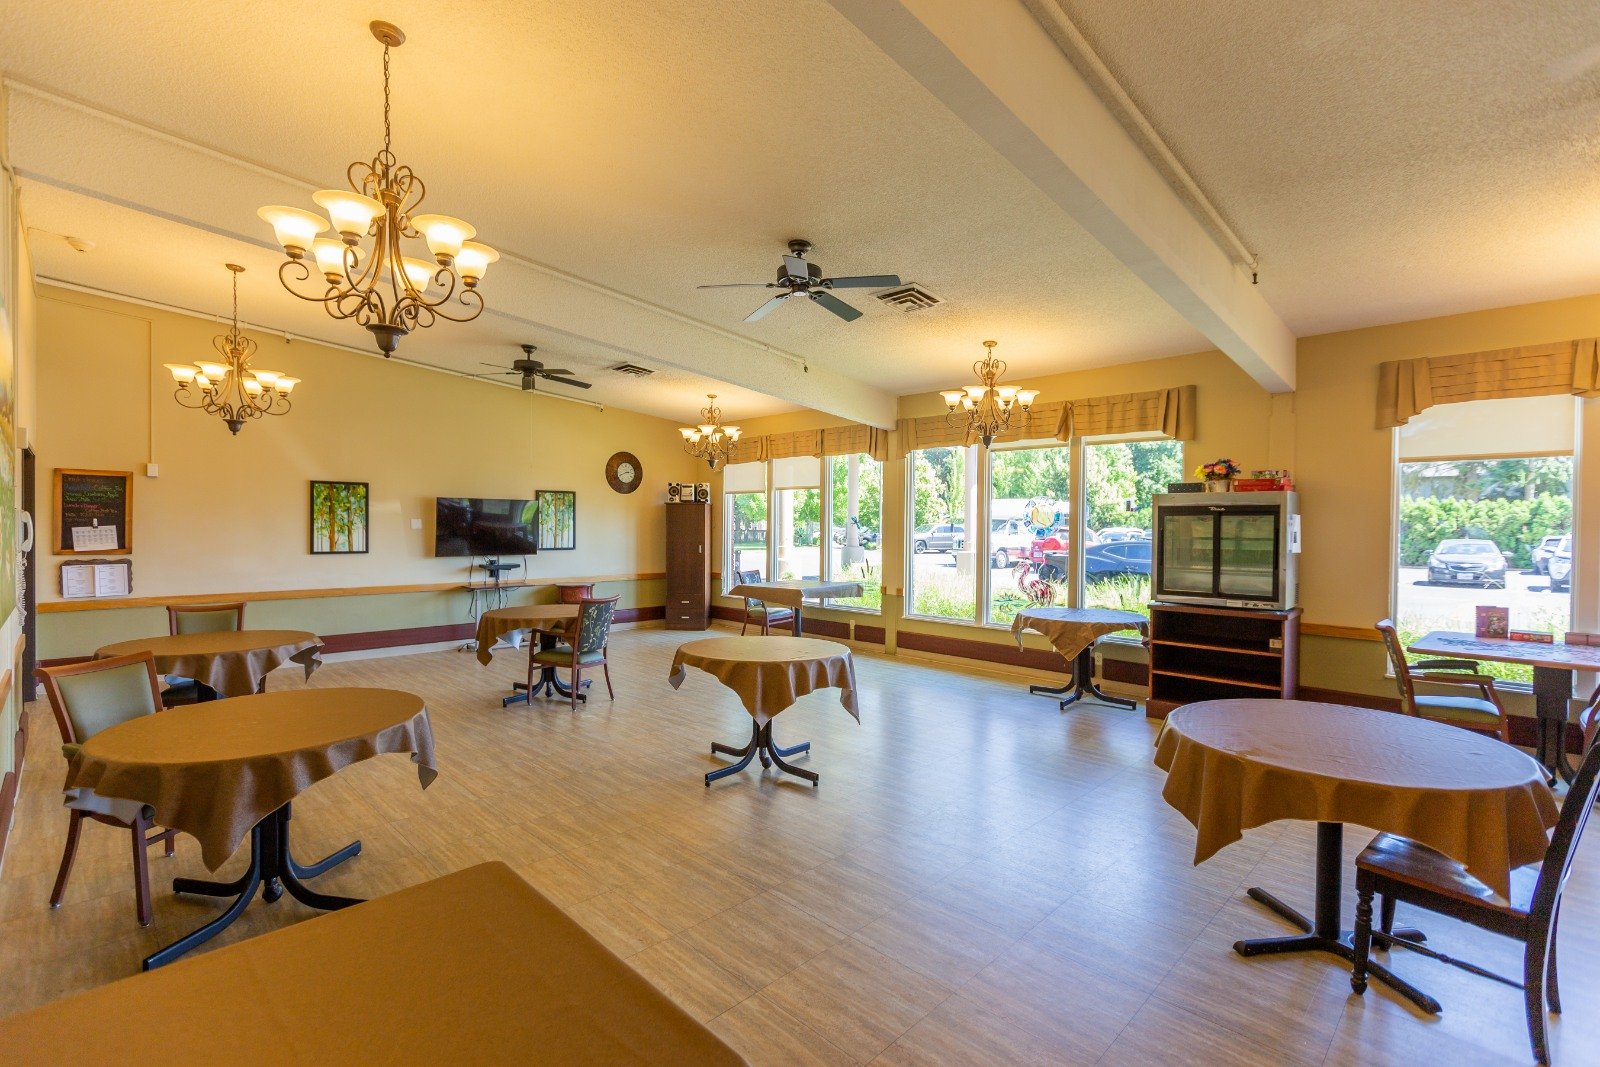
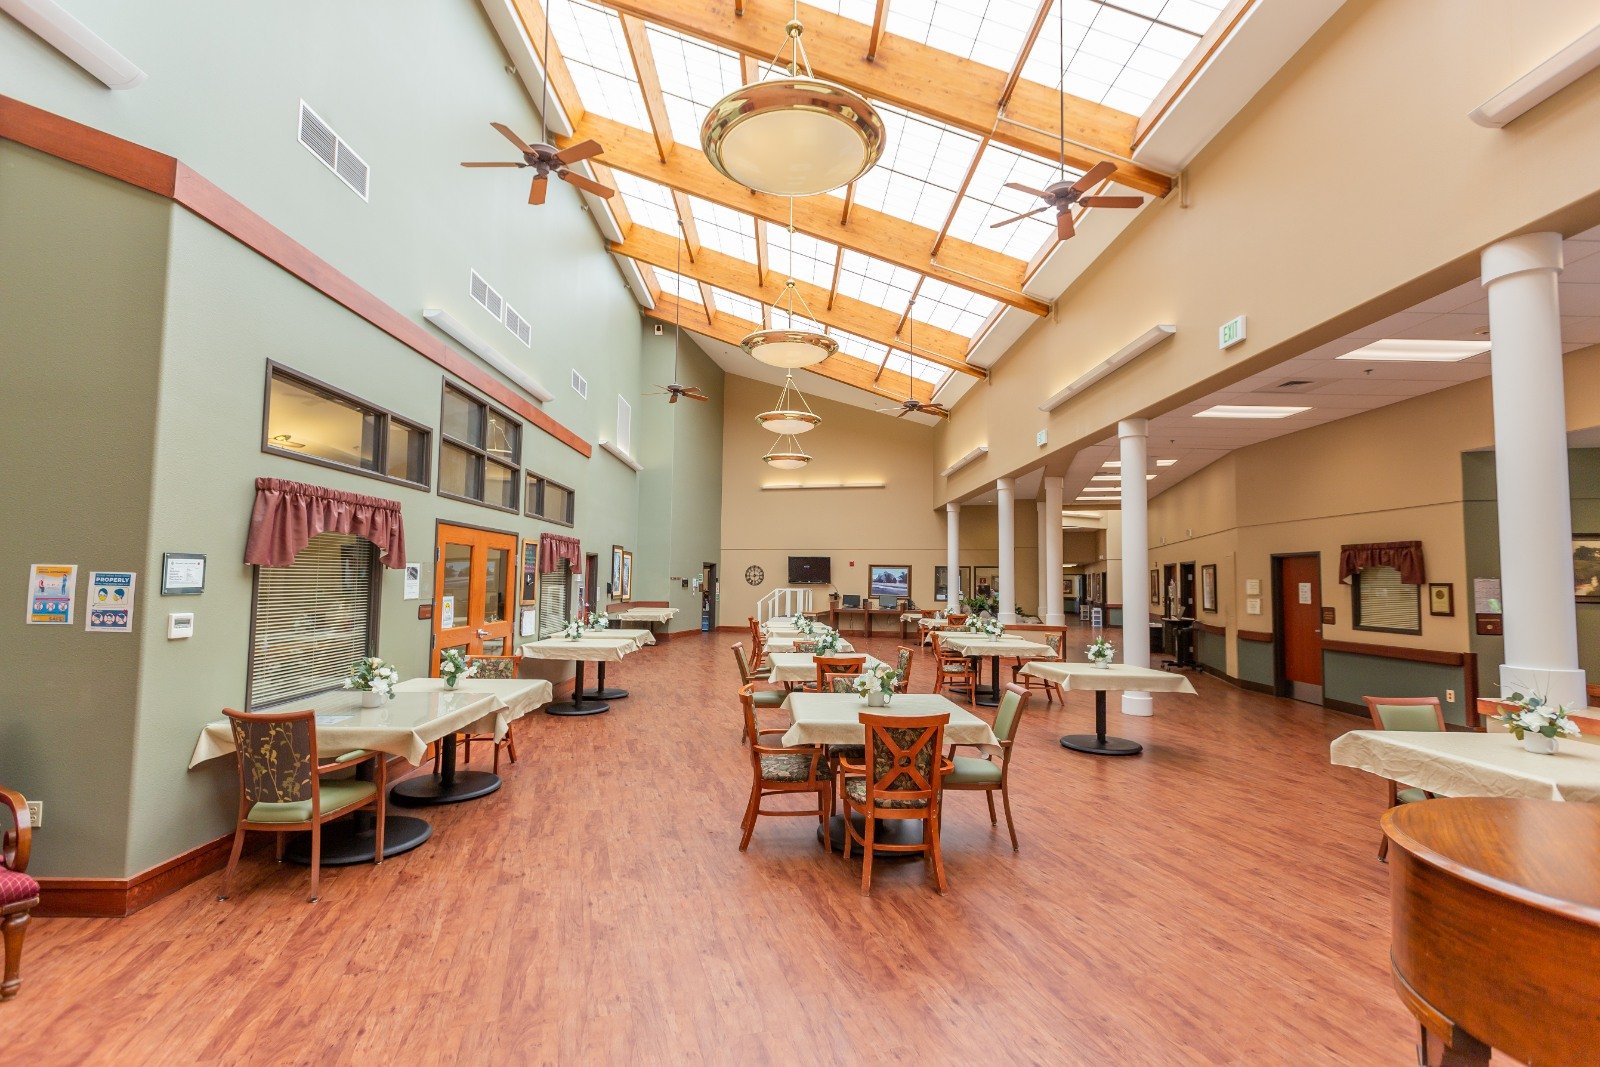
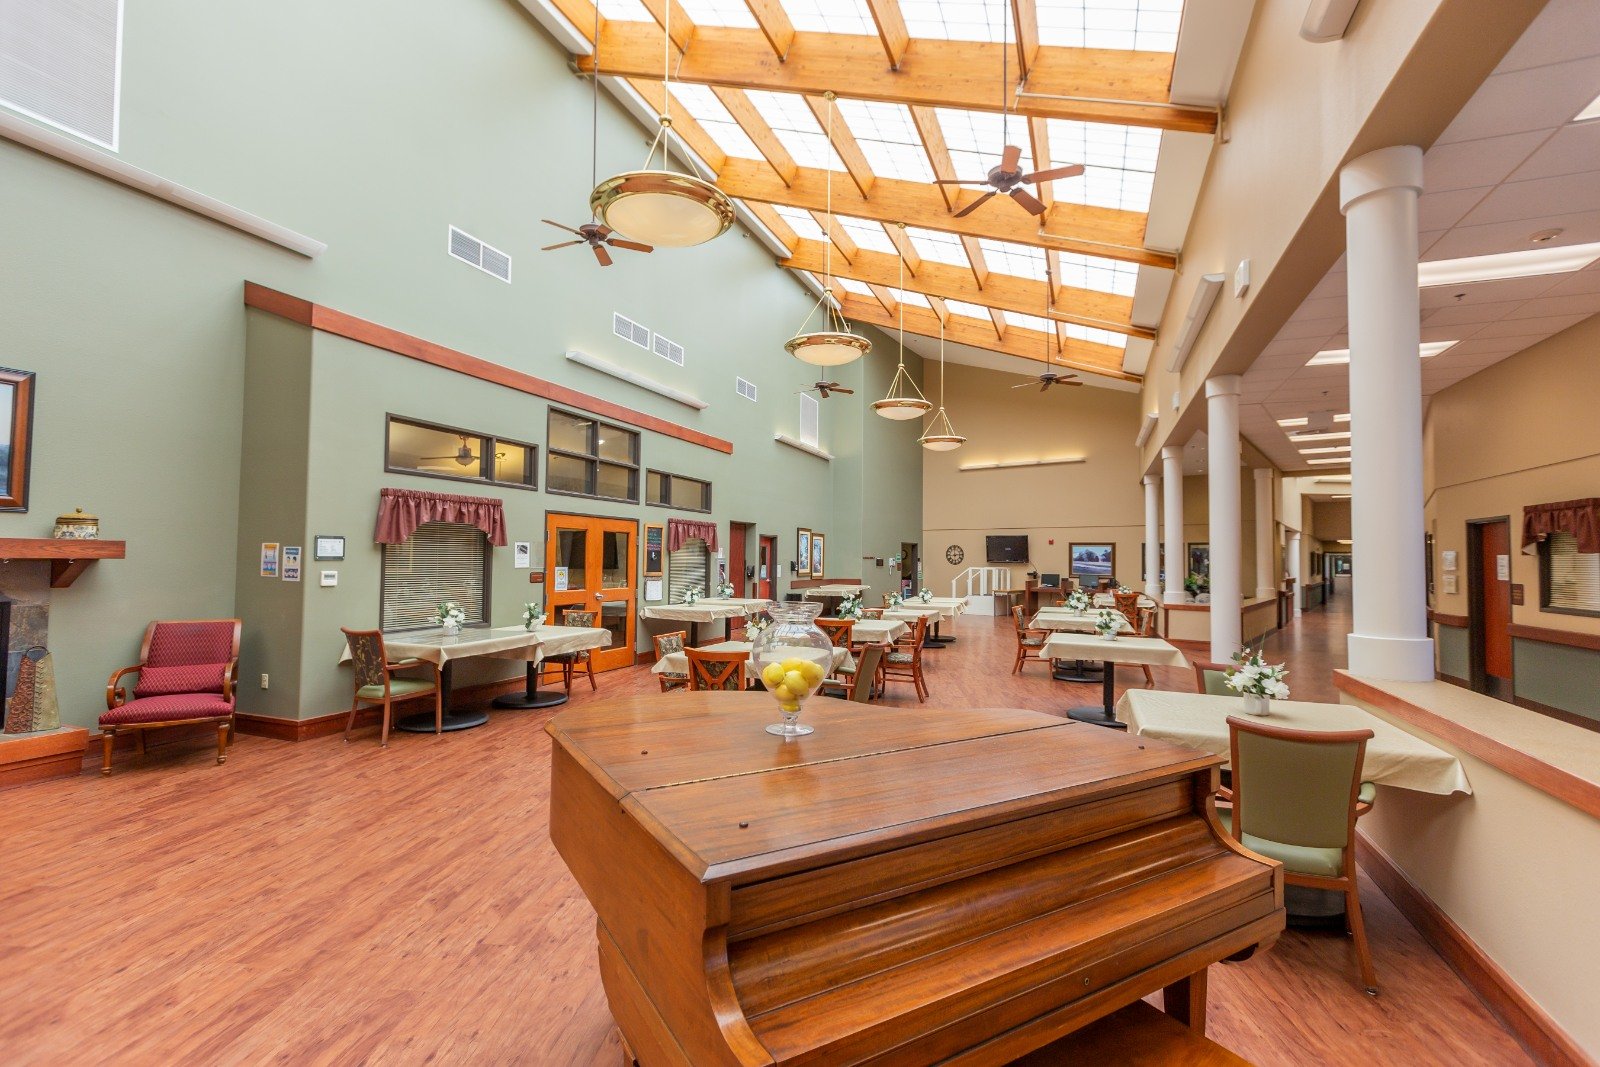
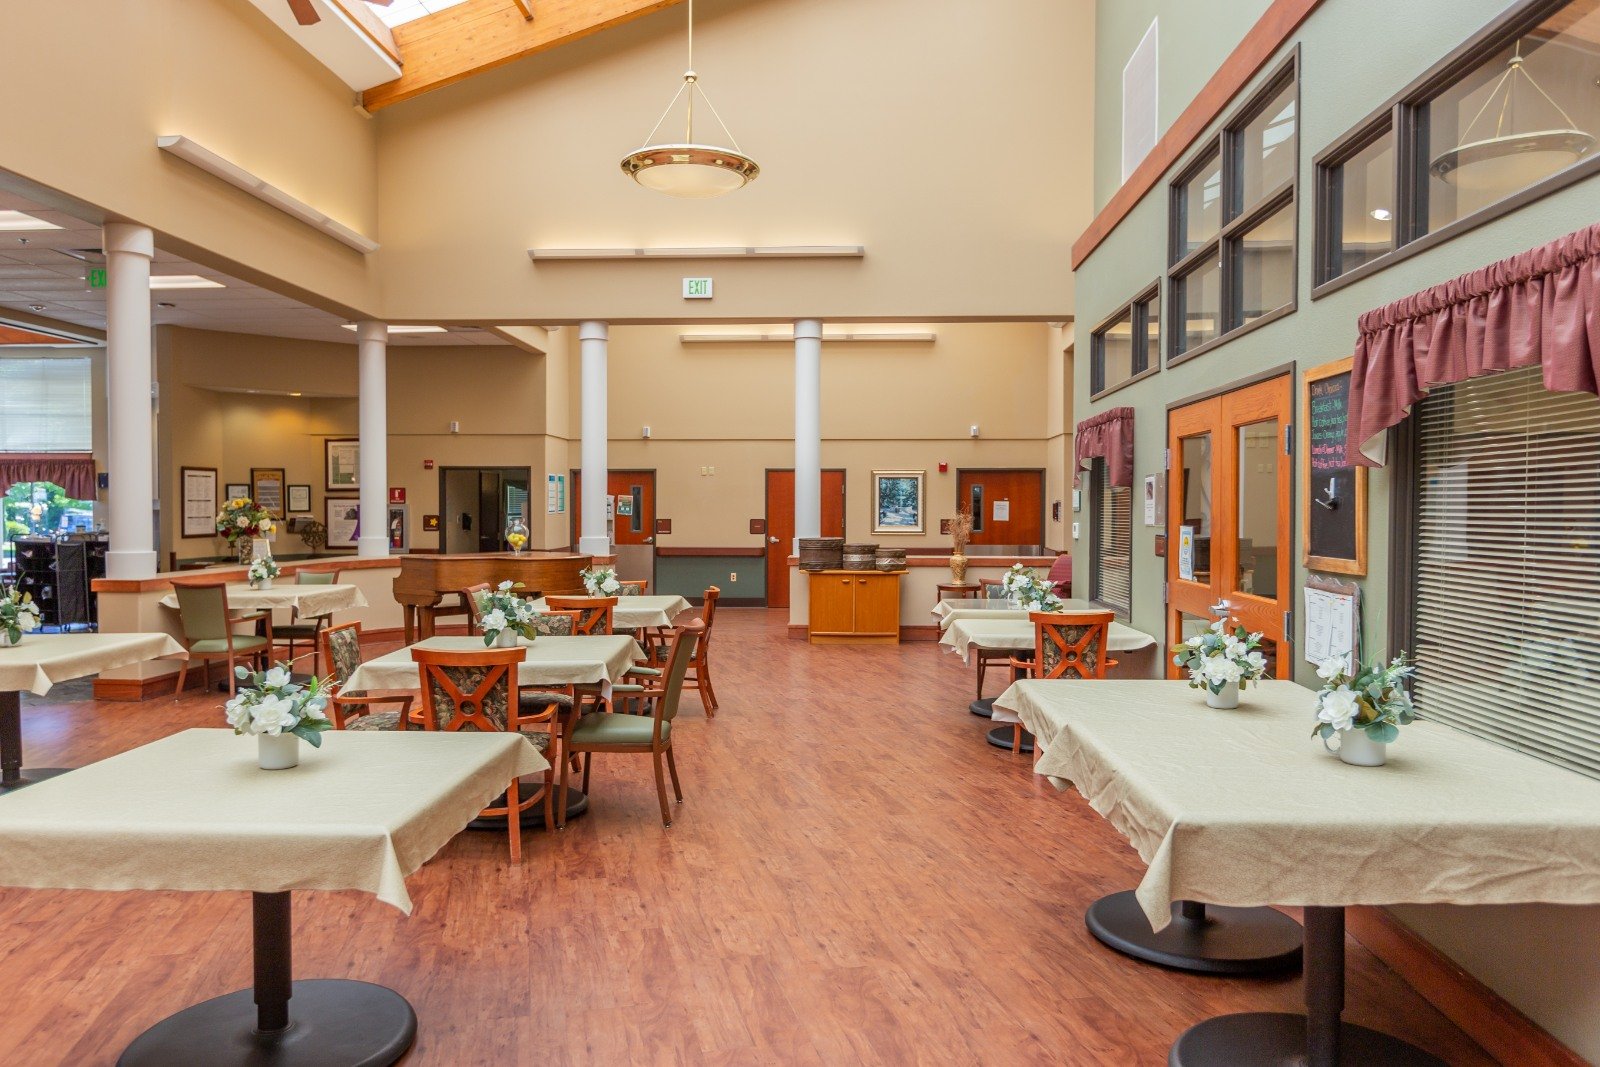
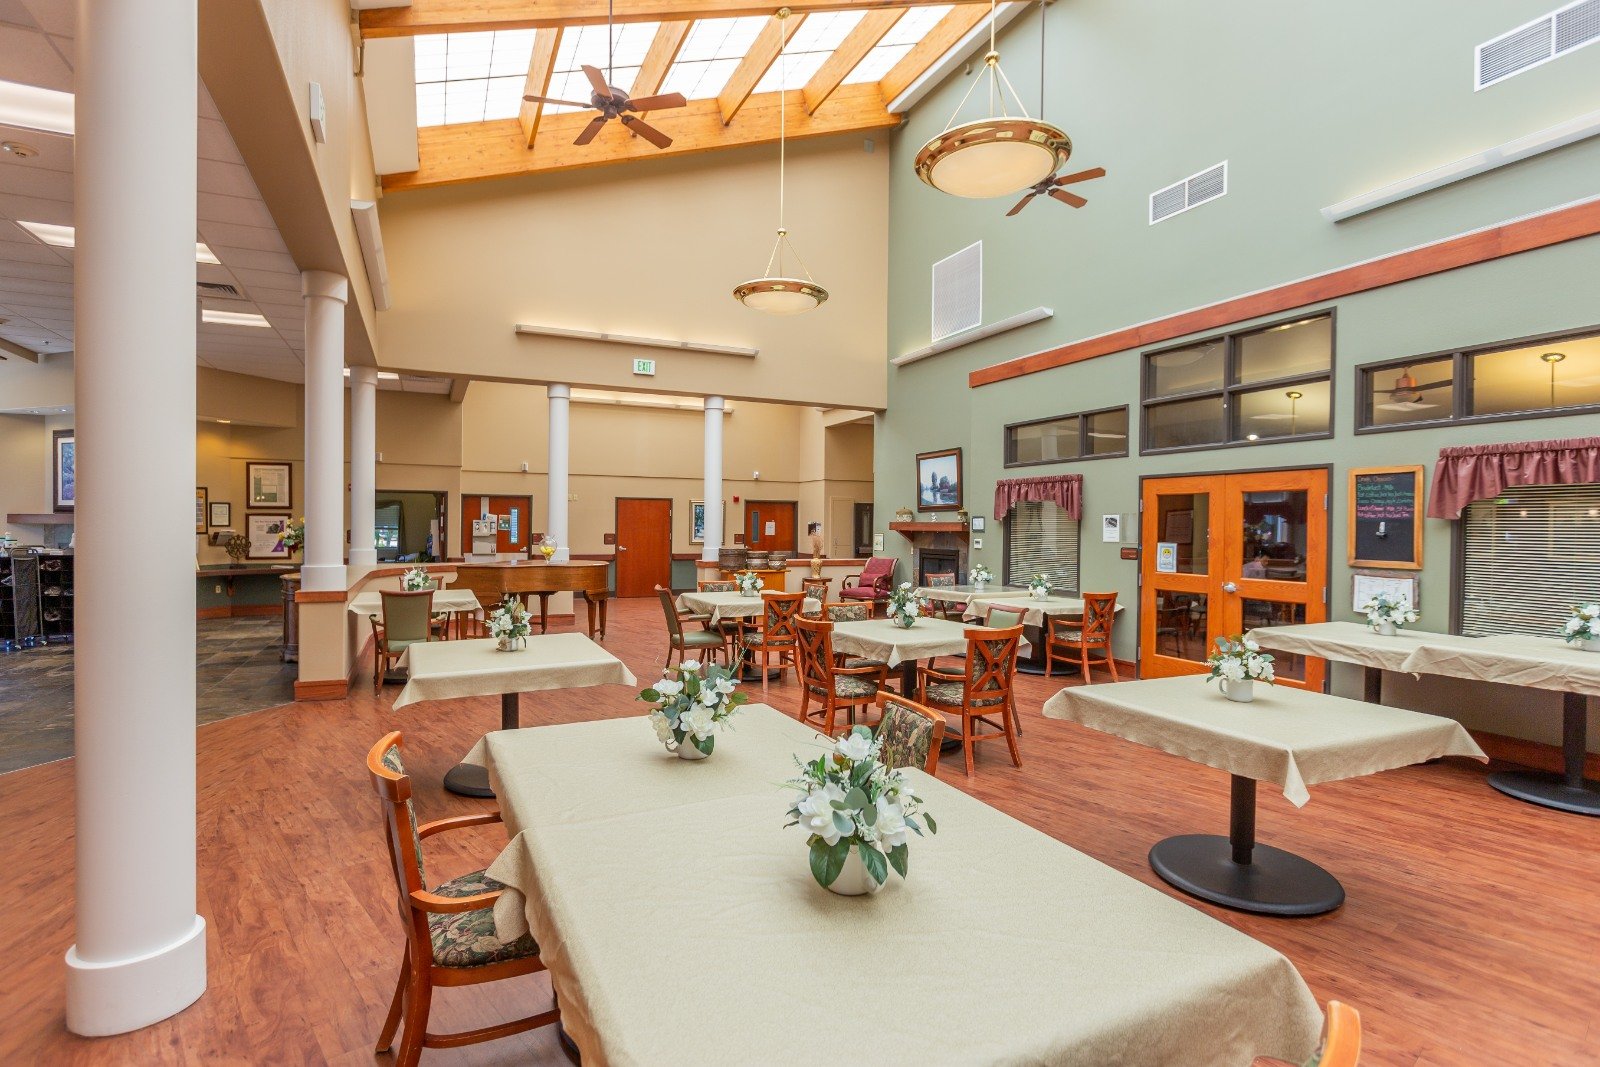
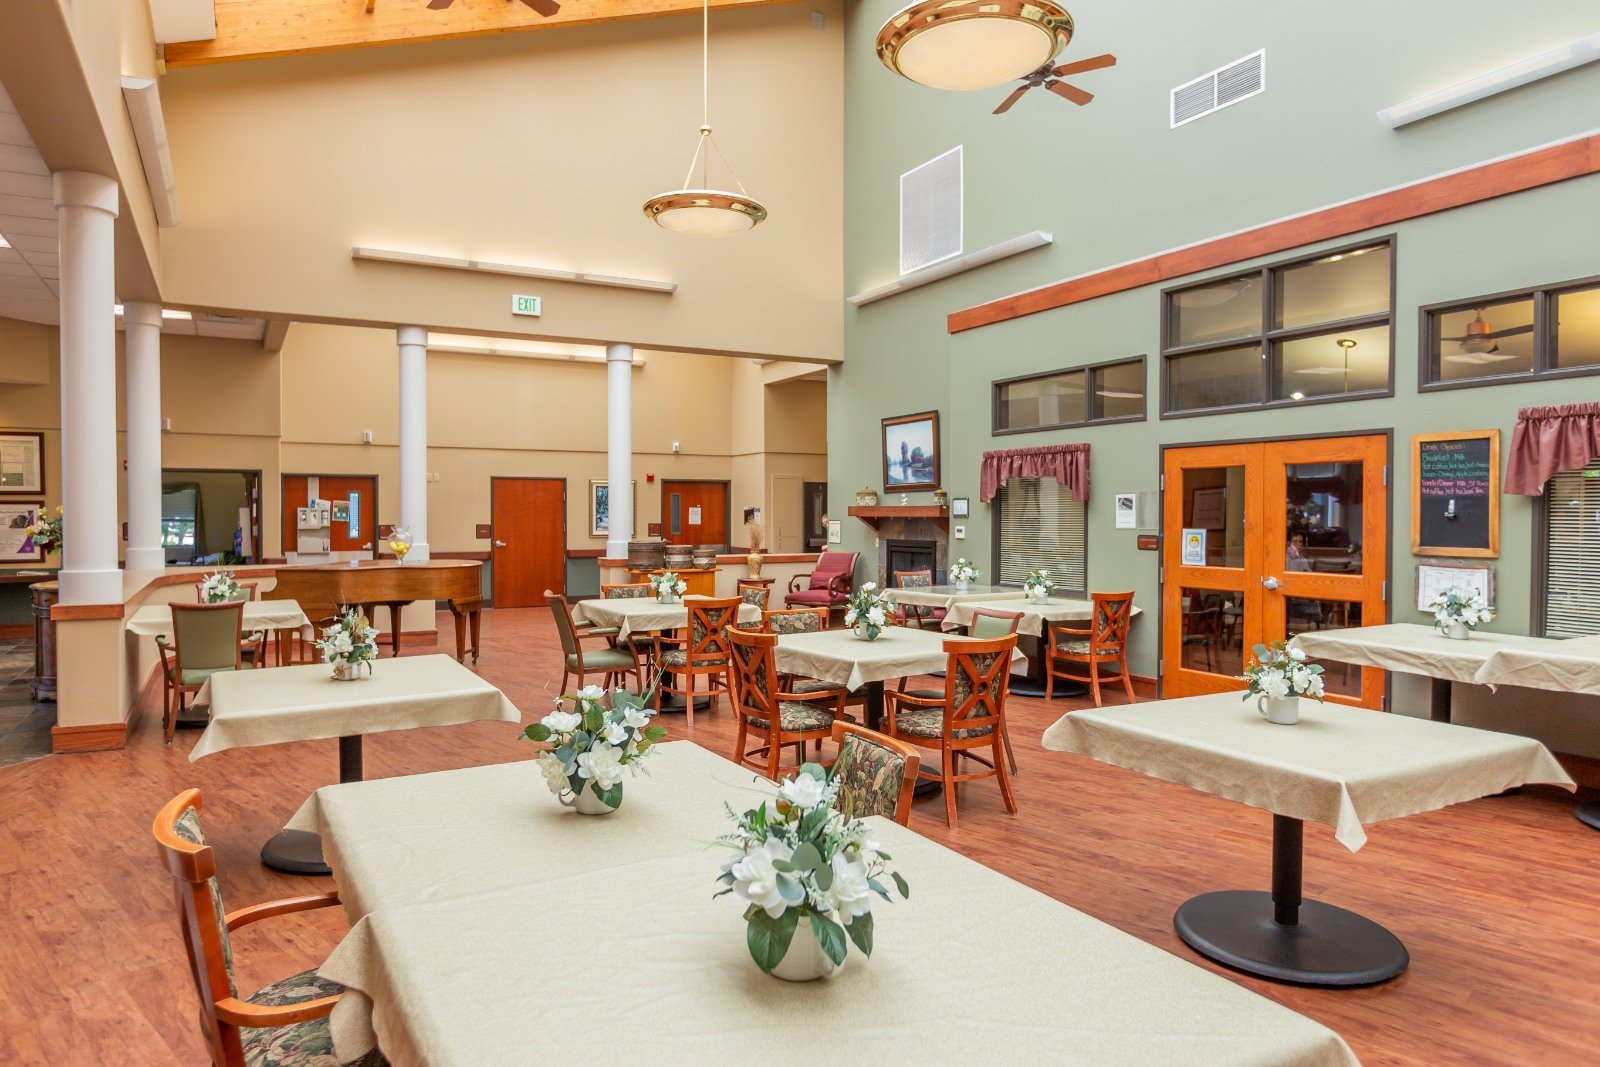
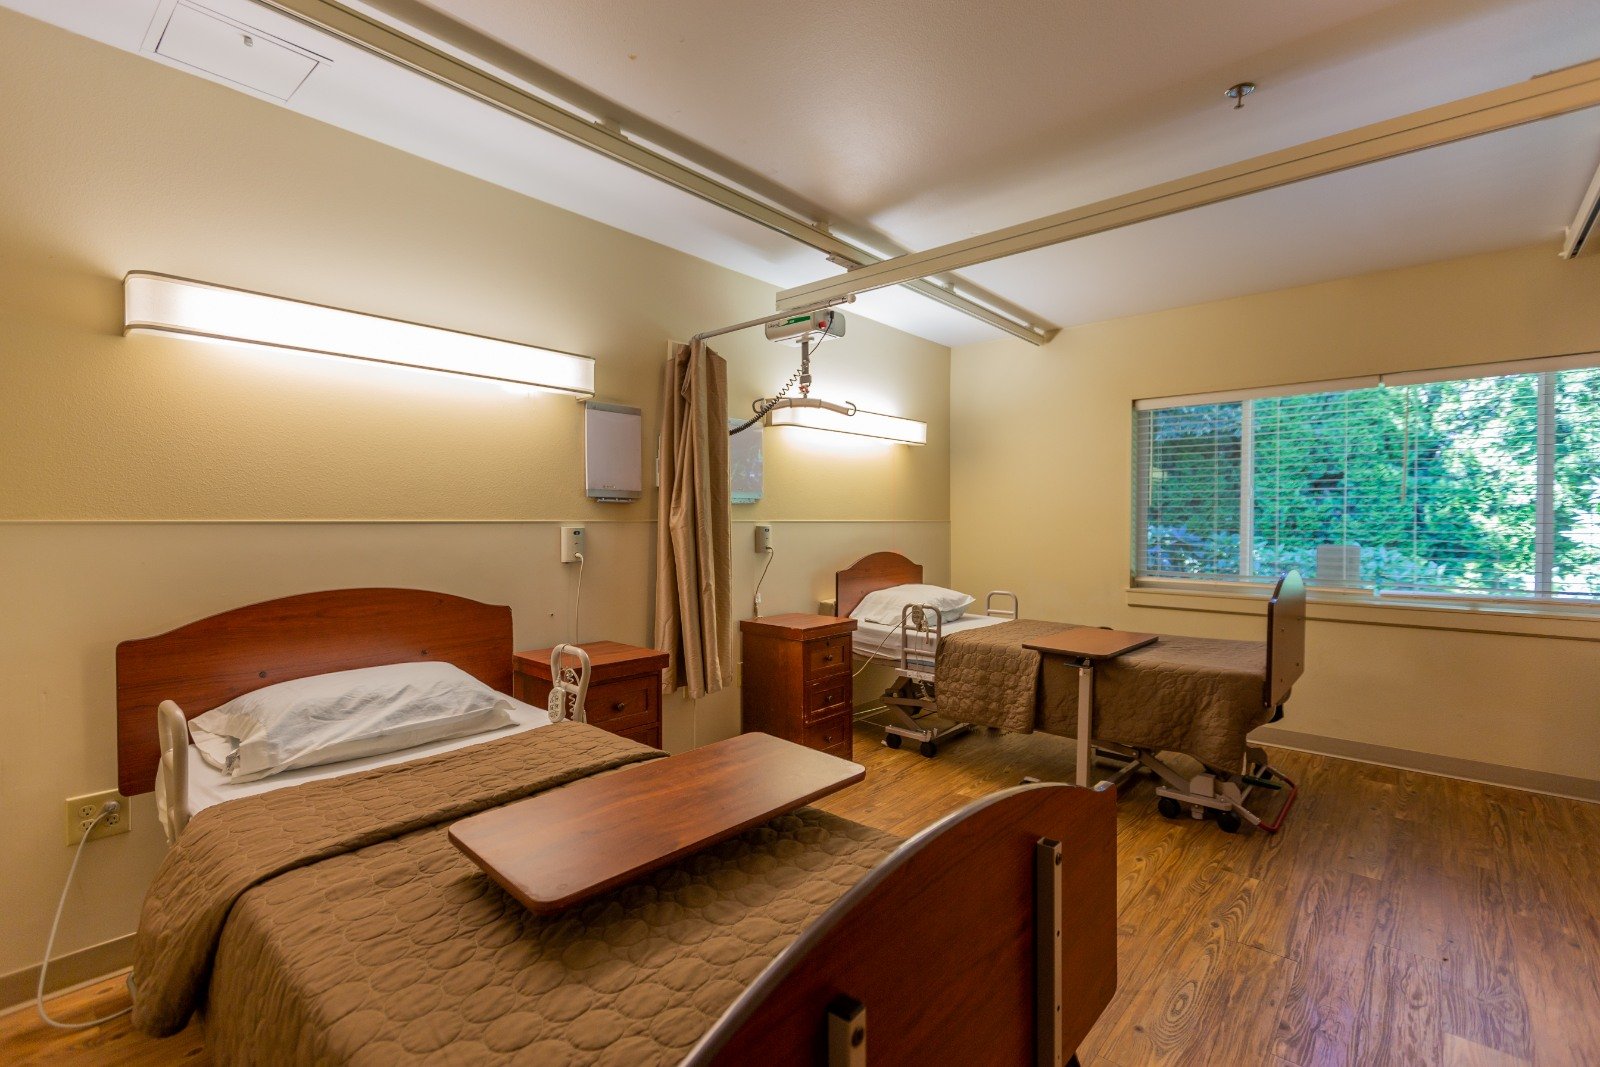
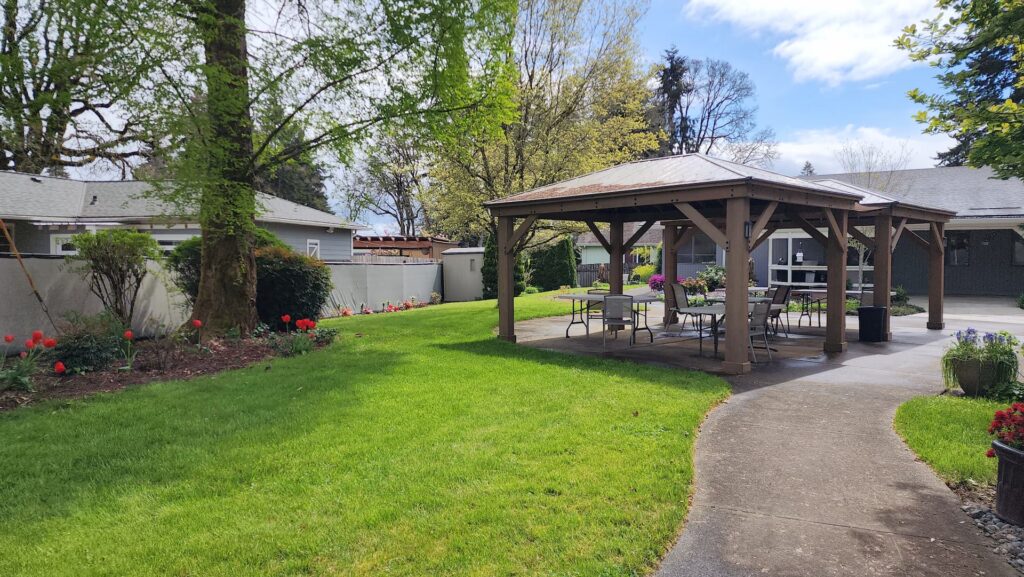
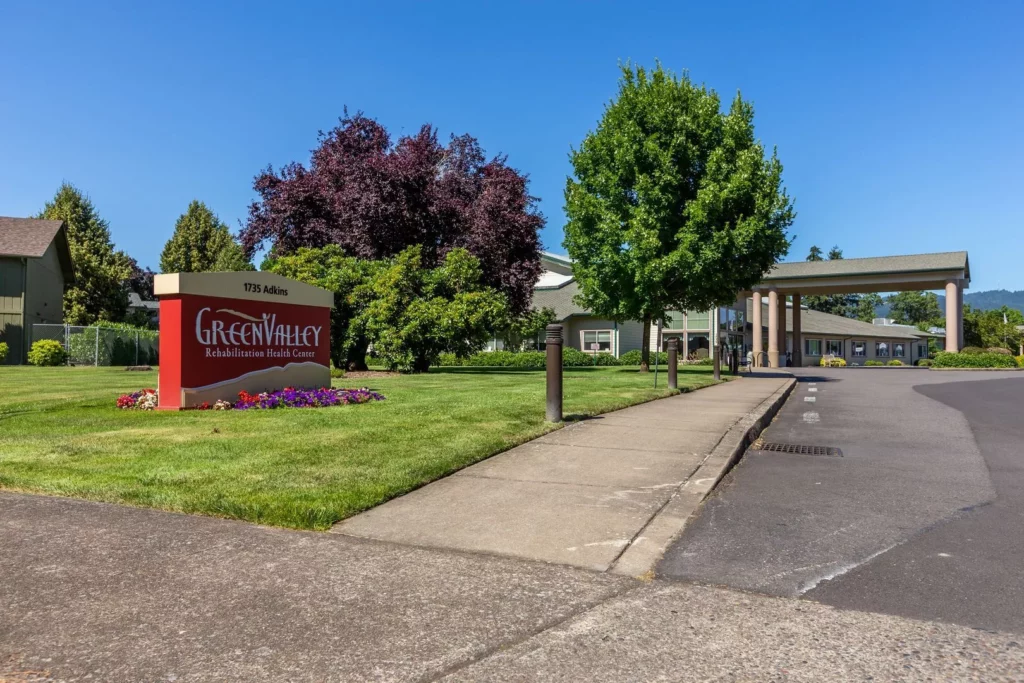
Exceptional care is the cornerstone of everything Green Valley Rehabilitation Health Center does. This remarkable facility is one of the best places in Eugene, Oregon, offering a warm and welcoming environment for retirees to spend their golden years. Here, residents can rest easy knowing that their well-being and happiness are top priorities. The staff are highly attentive, going above and beyond to provide personalized care that meets the unique needs of each resident. 
With beautiful amenities and a full-service dining room, the facility is designed to offer residents a comfortable and enjoyable living experience. Green Valley Rehabilitation Health Center takes cleanliness seriously, with constant sanitation ensuring a safe and pleasant environment for all residents. The facility is always smelling fresh and pleasant, making it an inviting and comfortable place to call home. Residents also enjoy delicious food and laundry services, making their stay as comfortable and convenient as possible. With exceptional care and attention to detail, residents feel right at home from the moment they arrive.

(541) 683-5032

Quality ratings

Measured by Centers for Medicare & Medicaid Services (CMS)

Overall rating Info The Overall CMS Rating combines results from health inspections, staffing levels and quality measures. Health inspections carry the most weight. Staffing and quality scores can increase or decrease the final rating based on performance compared to state and national standards.
2/5
Oregon average: 3.1/5
Health Inspection Info Based on the results of the facility's three most recent standard inspections and any complaint investigations. CMS reviews the number, scope, and severity of deficiencies, with more recent findings weighted more heavily.
1/5
Oregon average: 2.9/5
Staffing Info Measures average nursing staff hours per resident per day, including Registered Nurses (RNs) and total nursing staff. Ratings are adjusted based on the level of care residents require and are compared to state and national benchmarks.
2/5
Oregon average: 3.7/5
Quality Measures Info Based on clinical and physical health indicators reported to CMS, such as hospital readmissions, falls, pressure ulcers, and improvements in mobility. These measures reflect how well residents' health needs are being managed.
5/5
Oregon average: 3.4/5

Nursing care per resident

Info This shows how many total hours of nursing staff time are available per resident each day. Higher numbers usually mean more staff support.
5h 0m per day

This home provides 4% less nursing time per resident than the Oregon average.

Oregon average: 5h 13m per day

Staffing hours breakdown

Info Hours of care per resident per day, broken down by staff type. Data from CMS Medicare.
Staff type Facility State avg National avg
Registered Nurse (RN) Info Registered nurse hours per resident per day. 21m per day 41m per day 41m per day
Nurse Aide Info Nurse aide hours per resident per day. 3h 16m per day 3h 22m per day 2h 21m per day
Total Nursing (Weekend) Info Total number of nurse staff hours per resident per day on weekends. 4h 7m per day 4h 23m per day 3h 26m per day
Physical Therapist Info Physical therapist staff hours per resident per day. 4m per day 5m per day 4m per day
RN (Weekend) Info Registered nurse hours per resident per day on weekends. 6m per day 26m per day 29m per day

Capacity and availability

Medium-capacity home

Offers a balance of services and community atmosphere.

Total beds 120

This home usually has limited availability

Occupancy is moderate, suggesting balanced demand.

Similar demand to the Oregon average
Occupancy rate 91.8%
Residents per day (avg) 104
Occupancy rate
91.8%
Residents per day (avg)
104

Who this home usually serves

TYPE OF STAY

Primarily short stays

Residents typically stay for brief periods, with frequent admissions and discharges throughout the year.

Might be optimal for
Post-acute recovery Temporary care Transitional stays

Breakdown by payment type

Medicare

29% of new residents, usually for short-term rehab.

Typical stay 21 days

Private pay

62% of new residents, often for short stays.

Typical stay 26 days

Medicaid

9% of new residents, often for long-term daily care.

Typical stay 8 months

Finances and operations

Privately-owned community
Home revenue
$22.7M
Profit
$428.2K
Privately-owned community
Home revenue
$22,711,967.00
Profit
$428,172.00
Payroll costs Info The portion of the home's budget spent on staff, including nurses, caregivers, and other employees who support care and operations.
$6.5M
28.6% of revenue
Other operating costs Info All remaining costs needed to run the home, such as food, utilities, building maintenance, supplies and administrative expenses.
$15.8M
Total costs $22.3M
Bed community size
120-bed community
A larger shared setting that may offer more common spaces and organized community services.
Years in operation
24 years in operation
A longer operating history, which may indicate experience navigating regulations and delivering ongoing care.
Walk Score
Walk Score: 61 / 100
Moderately walkable. Some errands can be accomplished on foot, with a mix of nearby amenities.

About this community

License details

Facility type
Snf/nf Dual Cert
Status Active
Issuance March 1, 2023
County: Lane

Additional licensing details

CMS Certification Number: 385156

Ownership & operating entity

Green Valley Rehabilitation Health Center is legally operated by Kensington Rehabilitation Health Center, LLC, and administrated by Ryan Rose.

Type Of Units

Total
120 units
Total beds
120 units

Staffing

Key information about the people who lead and staff this community.

Leadership

Contact: Ms. Jamie Posey, Administrator

Care Services

Offers Alzheimer's Care
Nursing Services
Rehabilitation Services
Respite Care
Skilled Nursing
Licensed Nurses/CNAs
24-Hour Staffing
Short-Term Rehab

All Levels of Care

Short-Term Care
Long-Term Care
Hospice
Respite Care

Contact Information

Fax: (541) 683-5085

Additional Policies & Features

Pets Allowed
Smoking Allowed

Amenities & Lifestyle

Care coordination
Diabetes management services
Discharge planning
Housekeeping
In-house full time therapy
Laundry services
Medication management
Nutrition management
On-site pharmacy and lab services
On-site providers
Recreational programs
Transportation to medical appointments

Programs & Activities

Specific Programs
Short-Term Care, Long-Term Care, Specialty Services, Therapy, Hospice and Palliative Care

Dining & Nutrition

Food Description
The facility offers a variety of dining options tailored to residents' needs.
Contact Green Valley Rehabilitation Health Center

Access & Eligibility

Ways to qualify for care at this community, including accepted programs and payment options.

Medicaid Accepted

This facility is certified for eligible Medicaid services.

Medicare Accepted

This facility is certified for eligible Medicare services.

Payment & Funding Options

Private pay Medicaid Medicare Private Pay

Inspection History

In Oregon, the Department of Human Services, Aging and People with Disabilities performs unannounced surveys and regular inspections to ensure resident safety in all care settings.

10 visits/inspections

Latest inspection

Date:December 9, 2025
Survey deficiencies:2

20 licensing violations

Violations of state licensing requirements identified during facility inspections.

75 deficiencies

Deficiencies indicate regulatory issues. A higher number implies the facility had several areas requiring improvement.

Health Inspection History

Inspections
Total health inspections 6

Oregon average 5.1


Last Health inspection on Feb 2025

Total health citations 71

Oregon average 34

Citations per inspection
11.83

Oregon average 6.86


Health citations are formal notices following inspections when they fail to comply with safety and care standards.

37 of 71 citations resulted from standard inspections; 13 of 71 resulted from complaint investigations; and 21 of 71 came from combined inspections (standard and complaint).

Breakdown of citation severity (last 3 years)
Critical Health citations More info 0
100% better than Oregon average

Oregon average: 0.5


Serious Health citations More info 2
67% worse than Oregon average

Oregon average: 1.2

0 critical citations More info Oregon average: 0.5

2 serious citations More info Oregon average: 1.2

69 moderate citations More info Oregon average: 32.1

0 minor citations More info Oregon average: 0.2
Citations history (last 3 years)
Nursing Services moderate citation Info Issues related to the availability and quality of nursing staff and the care they provide. Feb 05, 2025
Corrected

Quality of Care moderate citation Info Issues related to how well residents receive appropriate treatment and support for their medical and daily care needs. Feb 05, 2025
Corrected

Abuse/Neglect serious citation Info Issues related to protecting resident's from harm, including abuse, neglect, or mistreatment. Sep 13, 2024
Corrected

Abuse/Neglect moderate citation Info Issues related to protecting resident's from harm, including abuse, neglect, or mistreatment. Sep 13, 2024
Corrected

Compare Nursing Homes around Eugene The information below is reported by the Oregon Department of Human Services, Aging and People with Disabilities.

5 facilities compared · CMS & OR Dept. of Health data · Updated Mar 2026

Avalon Care Center – Scappoose
NH

Nursing Home Licensed facility providing 24/7 skilled nursing care for residents with complex, ongoing medical needs. Staffed by RNs, LPNs, and CNAs. Inspected and star-rated annually by CMS. Accepts Medicare (short-term rehab) and Medicaid (long-term care).

AL

Assisted Living A licensed, long-term care setting for seniors or individuals with disabilities who need help with daily activities — like bathing, dressing, and medication management — but not 24-hour skilled nursing. Offers housing, meals, and around-the-clock support while aiming to maximize resident independence.

Scappoose
40
63.5%
-3%
4.77
-1%
-9%
0
12
1
31
-
-
Eea Company
-
-
-
385283
Avamere Court at Keizer
NH

Nursing Home Licensed facility providing 24/7 skilled nursing care for residents with complex, ongoing medical needs. Staffed by RNs, LPNs, and CNAs. Inspected and star-rated annually by CMS. Accepts Medicare (short-term rehab) and Medicaid (long-term care).

AL

Assisted Living A licensed, long-term care setting for seniors or individuals with disabilities who need help with daily activities — like bathing, dressing, and medication management — but not 24-hour skilled nursing. Offers housing, meals, and around-the-clock support while aiming to maximize resident independence.

Keizer
229
77.1%
+17%
4.47
-48%
-15%
0
18
0
52
-
76
Ari Cbc Llc
$14,1M
$5,3M
37.7%
385233
Green Valley Rehabilitation Health Center
NH

Nursing Home Licensed facility providing 24/7 skilled nursing care for residents with complex, ongoing medical needs. Staffed by RNs, LPNs, and CNAs. Inspected and star-rated annually by CMS. Accepts Medicare (short-term rehab) and Medicaid (long-term care).

AL

Assisted Living A licensed, long-term care setting for seniors or individuals with disabilities who need help with daily activities — like bathing, dressing, and medication management — but not 24-hour skilled nursing. Offers housing, meals, and around-the-clock support while aiming to maximize resident independence.

Eugene
110
91.8%
+40%
5.00
-61%
-5%
1
71
2
104
-
61
Kensington Rehabilitation Health Center, Llc
$22,7M
$6,5M
28.6%
385156
Alpine House Senior Skilled Care Living
-
NH

Nursing Home Licensed facility providing 24/7 skilled nursing care for residents with complex, ongoing medical needs. Staffed by RNs, LPNs, and CNAs. Inspected and star-rated annually by CMS. Accepts Medicare (short-term rehab) and Medicaid (long-term care).

AL

Assisted Living A licensed, long-term care setting for seniors or individuals with disabilities who need help with daily activities — like bathing, dressing, and medication management — but not 24-hour skilled nursing. Offers housing, meals, and around-the-clock support while aiming to maximize resident independence.

Portland
-
-
-
-
-
-
-
-
-
0
0
0
-
A+
41
-
-
-
-
-
Avamere at Seaside Residential Care Facility
-
NH

Nursing Home Licensed facility providing 24/7 skilled nursing care for residents with complex, ongoing medical needs. Staffed by RNs, LPNs, and CNAs. Inspected and star-rated annually by CMS. Accepts Medicare (short-term rehab) and Medicaid (long-term care).

AL

Assisted Living A licensed, long-term care setting for seniors or individuals with disabilities who need help with daily activities — like bathing, dressing, and medication management — but not 24-hour skilled nursing. Offers housing, meals, and around-the-clock support while aiming to maximize resident independence.

SEASIDE
40
-
-
-
-
-
-
-
-
0
0
0
-
-
-
-
-
-
-
-

Places of interest near Green Valley Rehabilitation Health Center

Address 2.5 miles from city center — 0.16 miles to nearest hospital (McKenzie Family Practice)

Address 1735 Adkins St, Eugene, OR 97401

Calculate Travel Distance to Green Valley Rehabilitation Health Center

Add your location

Address

Staffing Data (Q2 2025)

This data corresponds to Q2 2025 and is based on CMS Payroll-Based Journal.

Total staff 206
Employees 162
Contractors 44
Staff to resident ratio 2.22:1
24% worse than Oregon average

Oregon average ratio: 2.92:1

Avg staff/day 76
Average shift 7.7 hours
0% compared with Oregon average

Oregon average: 7.8 hours

Total staff hours (quarter) 53,374
Nursing staff breakdown
Registered Nurse

Manages medical care and health needs.

Total count 7
Average shift length Info Average shift length. Calculated as total hours divided by days worked and average staff per day. 8.1 hours

This role is partially covered by contractors.

Licensed Practical Nurse

Assists with medical care and medications.

Total count 29
Average shift length Info Average shift length. Calculated as total hours divided by days worked and average staff per day. 9.2 hours

This role is partially covered by contractors.

Certified Nursing Assistant

Helps with daily care and mobility.

Total count 94
Average shift length Info Average shift length. Calculated as total hours divided by days worked and average staff per day. 7.6 hours

This role is partially covered by contractors.

Contractor staffing

Total hours from contractors

9.6%

5,119 contractor hours this quarter

Certified Nursing Assistant: 27 Licensed Practical Nurse: 11 Occupational Therapy Aide: 3 Physical Therapy Aide: 1 Registered Nurse: 1 Medical Director: 1
Staff by category
Certified Nursing Assistant67279425,80891100%7.6
Licensed Practical Nurse1811299,14391100%9.2
Medication Aide/Technician140144,84791100%8.1
Speech Language Pathologist6061,9409099%7.4
Registered Nurse6171,6088998%8.1
Other Dietary Services Staff4041,2487077%7.3
Qualified Social Worker7071,1148290%6.1
Mental Health Service Worker4041,0686571%8
Physical Therapy Assistant6069797987%7.3
RN Director of Nursing4049526470%7.9
Clinical Nurse Specialist7079166774%7.6
Respiratory Therapy Technician3037128695%5.8
Nurse Practitioner2026646268%8
Physical Therapy Aide3146367987%6.6
Nurse Aide in Training9095136268%6.4
Occupational Therapy Aide0334486066%6.4
Dietitian1014245358%8
Administrator1013204044%8
Medical Director011361213%3
94 Certified Nursing Assistant
% of Days 100%
29 Licensed Practical Nurse
% of Days 100%
14 Medication Aide/Technician
% of Days 100%
6 Speech Language Pathologist
% of Days 99%
7 Registered Nurse
% of Days 98%
4 Other Dietary Services Staff
% of Days 77%
7 Qualified Social Worker
% of Days 90%
4 Mental Health Service Worker
% of Days 71%
6 Physical Therapy Assistant
% of Days 87%
4 RN Director of Nursing
% of Days 70%
7 Clinical Nurse Specialist
% of Days 74%
3 Respiratory Therapy Technician
% of Days 95%
2 Nurse Practitioner
% of Days 68%
4 Physical Therapy Aide
% of Days 87%
9 Nurse Aide in Training
% of Days 68%
3 Occupational Therapy Aide
% of Days 66%
1 Dietitian
% of Days 58%
1 Administrator
% of Days 44%
1 Medical Director
% of Days 13%

Facility Characteristics

Source: CMS Long-Term Care Facility Characteristics (Data as of Jan 2026)

Total census
93 residents
Residents by payment source
Medicare
24 residents (25.8%)
Medicaid
57 residents (61.3%)
Private pay or other
12 residents (12.9%)
Programs & Services
Residents' Group

Residents meet regularly to discuss policies, care quality, and activities

Nurse Aide Training

State-approved Nurse Aide Training and Competency Evaluation Program on-site

Active Resident Council

Organized group of residents that meets regularly to discuss facility policies, quality of life, and activities.

Quality of care over time

These measures show how residents usually do over time at this home, based on health outcomes and preventive care.

High-risk clinical events score Info A composite score based on pressure ulcers, falls with injury, weight loss, walking ability decline, and activities of daily living decline. 5.8
45% better than Oregon average

Oregon average: 10.5

Functional decline score Info A composite score based on activities of daily living decline, walking ability decline, and incontinence. 12.2
42% better than Oregon average

Oregon average: 21.1

Long-stay resident measures
Significantly above average Oregon avg: 3.6 Info CMS star rating based on long-stay quality measure performance. 5 stars = significantly above average, 1 star = significantly below average.
Need for Help with Daily Activities Increased Info Percent of long-stay residents whose need for help with daily activities has increased 7.9%
52% better than Oregon average

Oregon average: 16.3%

Walking Ability Worsened Info Percent of long-stay residents whose ability to move independently worsened 10.3%
59% better than Oregon average

Oregon average: 24.9%

Low Risk Residents with Bowel/Bladder Incontinence Info Percent of low risk long-stay residents who lose control of their bowels or bladder 18.4%
19% better than Oregon average

Oregon average: 22.6%

Falls with Major Injury Info Percent of long-stay residents experiencing one or more falls with major injury 1.9%
21% better than Oregon average

Oregon average: 2.4%

High Risk Residents with Pressure Ulcers Info Percent of long-stay high risk residents with pressure ulcers 7.7%
11% worse than Oregon average

Oregon average: 6.9%

Urinary Tract Infection Info Percent of long-stay residents with a urinary tract infection 1.1%
46% better than Oregon average

Oregon average: 2.1%

Lost Too Much Weight Info Percent of long-stay residents who lose too much weight 1.3%
75% better than Oregon average

Oregon average: 5.3%

Depressive Symptoms Info Percent of long-stay residents who have depressive symptoms 2.4%
49% better than Oregon average

Oregon average: 4.6%

Antipsychotic Use Info Percent of long-stay residents who received an antipsychotic medication 3.9%
70% better than Oregon average

Oregon average: 13.2%

Pneumococcal Vaccine Info Percent of long-stay residents assessed and appropriately given the pneumococcal vaccine 99.6%
In line with Oregon average

Oregon average: 95.7%

Influenza Vaccine Info Percent of long-stay residents assessed and appropriately given the seasonal influenza vaccine 100.0%
5% better than Oregon average

Oregon average: 95.2%

Short-stay resident measures
Significantly above average Oregon avg: 3.5 Info CMS star rating based on short-stay quality measure performance. 5 stars = much above average, 1 star = much below average.
Pneumococcal Vaccine Info Percent of short-stay residents assessed and appropriately given the pneumococcal vaccine 91.0%
6% better than Oregon average

Oregon average: 86.2%

Antipsychotic medication increase Info Percent of short-stay residents who newly received an antipsychotic medication 0.4%
77% better than Oregon average

Oregon average: 1.8%

Influenza Vaccine Info Percent of short-stay residents assessed and appropriately given the seasonal influenza vaccine 82.2%
In line with Oregon average

Oregon average: 81.2%

Re-hospitalized after SNF stay Info Percentage of short-stay residents who were re-hospitalized after their nursing home admission. 20.9%
In line with Oregon average

Oregon average: 21.6%

Emergency department visits Info Percentage of short-stay residents who had an outpatient emergency department visit. 19.1%
26% worse than Oregon average

Oregon average: 15.1%

Falls with major injury Info Percentage of SNF residents who experience falls with major injury during their stay. 0.7%
6% better than Oregon average

Oregon average: 0.8%

Ability to care for self at discharge Info Percentage of residents at or above expected ability to care for themselves at discharge. 59.0%
10% better than Oregon average

Oregon average: 53.7%

Successful return to home or community Info Rate of successful return to home or community from a skilled nursing facility. 56.5%
12% better than Oregon average

Oregon average: 50.6%

Penalties and fines

Federal penalties imposed by CMS for regulatory violations, including civil money penalties (fines) and denials of payment for new Medicare/Medicaid admissions.

Source: CMS Penalties Database (Data as of Jan 2026)

Total fines amount $53K
11% lower than Oregon average

Oregon average: $60K

Number of fines 1
41% fewer fines than Oregon average

Oregon average: 1.7

Payment Denials Info Serious action where Medicare and/or Medicaid temporarily stops payments for new residents until issues are fixed. 0
100% fewer payment denials than Oregon average

Oregon average: 0.1

Fines amount comparison
This facility $53K
Oregon average $60K
Penalty History

Penalties are imposed by CMS for violations of federal nursing home regulations.

Civil Money Penalty Info Fines imposed for noncompliance, which can be assessed per day or per instance of violation. Sep 13, 2024
$53K

Last updated: Jan 2026

Guides for Better Senior Living

Care Cost Calculator: See Prices in Your Area

Nursing Home Data Explorer

Don’t Wait Too Long: 7 Red Flag Signs Your Parent Needs Assisted Living Now

The True Cost of Assisted Living in 2025 – And How Families Are Paying For It

Understanding Senior Living Costs: Pricing Models, Discounts & Financial Assistance

Financial Aid for Oregon Seniors

Get financial aid guidance

Oregon Project Independence (OPI)

OPI

Age 60+, Oregon resident, at risk of nursing home but not Medicaid-eligible.

~$2,000/month (individual, varies).

$5,000 (individual).

Cost-sharing required; rural/urban balance.

Oregon Medicaid Community-Based Care

OR Medicaid CBC

Age 65+ or disabled, Oregon resident, Medicaid-eligible, nursing home-level care need.

~$2,829/month (300% FBR, individual).

$2,000 (individual), $3,000 (couple).

High demand in urban areas (e.g., Portland).

Program of All-Inclusive Care for the Elderly (PACE)

Oregon PACE (e.g., Providence ElderPlace)

Age 55+, OR resident (specific counties), NFLOC, safe with PACE support.

~$2,829/month (Medicaid-eligible); private pay option available.

$2,000 (individual), $3,000 (couple) for Medicaid enrollees.

Available in 11 counties (e.g., Multnomah, Washington); Providence ElderPlace dominant provider.

Medicare Savings Program (MSP)

Oregon Medicare Savings Program

Age 65+ or disabled, OR resident, Medicare Part A/B.

~$2,510/month (QMB), ~$3,380/month (SLMB), ~$3,598/month (QI)—individual.

$9,430 (individual), $14,130 (couple).

Three tiers; includes Extra Help for Part D; no waitlist.

Low-Income Home Energy Assistance Program (LIHEAP)

Oregon LIHEAP

Age 60+ prioritized, OR resident, low-income household.

~$3,970/month (individual, 185% FPL).

Not assessed; income-focused.

Covers gas, electric, oil; emergency aid via Oregon Energy Fund (OEF).

Family Caregiver Support Program (FCSP)

Oregon Family Caregiver Support Program

Caregivers of 60+ needing care or 55+ caregivers of others; OR resident; functional needs (2+ ADLs).

No strict cap; prioritizes low-income (~$24,980/year).

Not assessed; need-based.

15 regions; rural priority; includes grandparent caregivers.

Senior Community Service Employment Program (SCSEP)

Oregon SCSEP

Age 55+, unemployed, low-income, OR resident.

~$1,983/month (125% FPL).

Not specified; income-focused.

Priority for veterans, rural residents; Easterseals/AARP partnership.

VA Aid and Attendance (A&A) and Housebound Benefits

Oregon VA Aid and Attendance/Housebound

Age 65+ or disabled veteran/spouse, OR resident, wartime service, need for ADL help (A&A) or homebound.

Net income < ~$1,984/month (veteran with dependent, A&A); pension offsets income.

~$155,356 (net worth limit).

High veteran demand; Oregon Veterans’ Homes option.

Senior Property Tax Deferral Program

Oregon Property Tax Deferral for Disabled and Senior Citizens

Age 62+, OR resident, homeowner 5+ years, low-income.

~$58,000/year (household, adjusted annually).

Home value < county median; equity > 15%.

Deferred taxes accrue 6% interest; repaid upon sale/death.

Elderly Nutrition Program (ENP)

Oregon Elderly Nutrition Program

Age 60+, OR resident (or spouse of any age); no income limit.

None; donations encouraged.

Not assessed.

Includes Meals on Wheels; prioritizes homebound/low-income.