Guttenberg Care Center
Nursing Home & Assisted Living · Guttenberg, IA
CMS overall rating Info CMS (the Centers for Medicare & Medicaid Services) is the federal agency that rates nursing home quality. Its Overall Rating runs from 1 to 5 stars, combining health inspections, staffing, and quality measures, with inspections weighted most heavily.

Guttenberg Care Center

Nursing Home & Assisted Living · Guttenberg, IA
CMS overall rating Info CMS (the Centers for Medicare & Medicaid Services) is the federal agency that rates nursing home quality. Its Overall Rating runs from 1 to 5 stars, combining health inspections, staffing, and quality measures, with inspections weighted most heavily.
Calculator: See prices in your area
Guttenberg Care Center accepts Medicare, Medicaid, and private pay.

Overview of Guttenberg Care Center

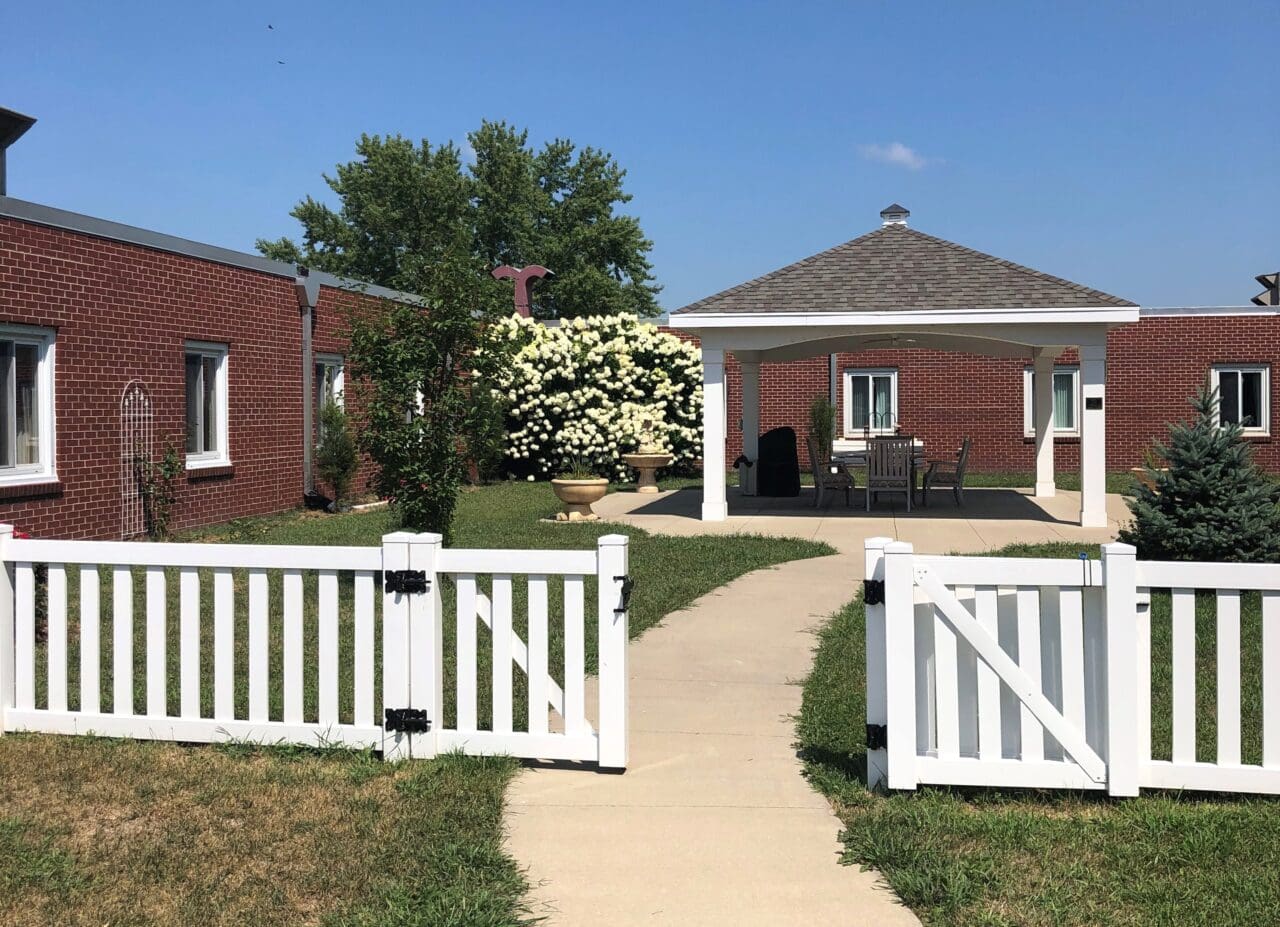
Guttenberg Care Center is a 92-bed nursing home in Guttenberg, Iowa, offering memory care in addition to skilled nursing. The facility is operated by ABCM Corporation and is committed to a person-directed care philosophy. It accepts Medicare, Medicaid, and private pay.

CMS rates Guttenberg Care Center at 5 out of 5 stars overall — the top rating in Iowa — driven by a 5-star Health Inspection score that sits 75% above the state average. The facility has recorded no federal fines or civil money penalties in the past three years, a clean enforcement record that helps explain the top inspection rating. Quality Measures are rated 2 out of 5 stars, placing the facility below the Iowa average on clinical outcome indicators; families evaluating long-term placement should weigh that alongside the strong compliance record.

Nurse staffing averages 3 hours and 32 minutes per resident per day, roughly 18% below Iowa’s average of 4 hours and 18 minutes — a meaningful gap for residents requiring frequent hands-on care. The facility holds a state-approved Nurse Aide Training and Competency Evaluation Program on-site, reflecting a commitment to staff development. Occupancy is around 39%, well below the Iowa average of 75%, suggesting current availability is not a barrier to admission.

Guttenberg Care Center suits families in Clayton County seeking a post-acute or long-term placement where inspection compliance and regulatory standing are primary considerations, and who are prepared to review the Quality Measures data alongside the facility’s strong oversight record.

Quality ratings

Measured by Centers for Medicare & Medicaid Services (CMS)

Overall rating Info The Overall CMS Rating combines results from health inspections, staffing levels and quality measures. Health inspections carry the most weight. Staffing and quality scores can increase or decrease the final rating based on performance compared to state and national standards.
Health Inspection Info Based on the results of the facility's three most recent standard inspections and any complaint investigations. CMS reviews the number, scope, and severity of deficiencies, with more recent findings weighted more heavily.
Staffing Info Measures average nursing staff hours per resident per day, including Registered Nurses (RNs) and total nursing staff. Ratings are adjusted based on the level of care residents require and are compared to state and national benchmarks.
Quality Measures Info Based on clinical and physical health indicators reported to CMS, such as hospital readmissions, falls, pressure ulcers, and improvements in mobility. These measures reflect how well residents' health needs are being managed.

Staffing hours breakdown

Info Daily nursing hours per resident by staff type, reported to CMS. Higher is generally better — compare this facility to state and national averages to see where staffing stands.

Hours per resident per day — compared to state averages

Total nursing care / resident Info Total adjusted nursing hours per resident per day, combining RN, LPN, and aide time. CMS adjusts this for case-mix so facilities can be fairly compared.
3h 32m per day
Rank #219 / 249Nurse hours — State benchmarkedThis home is ranked 219th out of 249 homes in Iowa. Shows adjusted nurse hours per resident per day benchmarked to the Iowa average, with a ranking across 249 Iowa facilities. More hours mean more direct care. The national average is about 3.5 hrs; below 3.0 is a red flag.Rankings are based only on facilities in Iowa that report data for that category. Facilities without available data are excluded from the ranking.Click the rank badge to see the full State ranking.Click here to see the full State ranking.
vs avg

5 of 6 metrics below state avg

Standout metric LPN / LVN is +17% above state avg
Staff typeHours / Day / Residentvs state avg
Registered Nurse (RN) Info RNs hold the highest nursing license and can assess residents, interpret test results, and direct care plans. More RN hours per day often signals stronger clinical oversight and faster response to health changes. 39m per day ▼ 11% State avg: 44m per day · National avg: 41m per day
LPN / LVN Info Licensed Practical Nurses (LPNs) or Licensed Vocational Nurses (LVNs) deliver routine hands-on care — medication administration, wound dressing, and monitoring vital signs. They work under RN supervision and make up a large share of daily bedside care. 40m per day ▲ 17% State avg: 34m per day · National avg: 52m per day
Nurse Aide Info Certified Nurse Aides (CNAs) provide the most direct day-to-day assistance: bathing, dressing, feeding, and mobility. Nurse aide hours are typically the largest staffing category and directly affect residents' quality of life. 2h 17m per day ▼ 10% State avg: 2h 32m per day · National avg: 2h 20m per day
Weekend Total Nursing Info Combined nursing hours (RN + LPN + Nurse Aide) per resident per day on weekends. Staffing often drops on weekends — this figure reveals whether the facility maintains adequate coverage outside of weekday hours. 3h 15m per day ▼ 3% State avg: 3h 21m per day · National avg: 3h 26m per day
Physical Therapist Info Hours per resident per day provided by licensed Physical Therapists (PTs) or PT Assistants. PT services help residents recover mobility after injury or illness and are especially important for post-acute (short-stay) rehabilitation. 1m per day ▼ 44% State avg: 2m per day · National avg: 4m per day
Weekend RN Info Registered nurse hours specifically on weekends. Facilities sometimes reduce RN presence on Saturdays and Sundays — a low weekend RN figure compared to weekday hours can indicate reduced clinical oversight when most administrative staff are absent. 24m per day ▼ 19% State avg: 30m per day · National avg: 28m per day

Capacity and availability

This home usually has availability

Lower occupancy than the state average
Occupancy rate
38.7% Rank #361 / 407Occupancy rate — State benchmarkedThis home is ranked 361st out of 407 homes in Iowa. Shows this facility's occupancy rate versus the Iowa average, with its Statewide rank out of 407. Higher occupancy signals strong local demand and financial stability.Rankings are based only on facilities in Iowa that report data for that category. Facilities without available data are excluded from the ranking.Click the rank badge to see the full State ranking.Click here to see the full State ranking.
Avg. Length of Stay Info Average number of days residents stay at this facility, based on CMS cost report data. Shorter stays often reflect post-acute or rehab care; longer stays reflect long-term care.
102 days
Bed community size
46-bed community Rank #274 / 407Bed count — State benchmarkedThis home is ranked 274th out of 407 homes in Iowa. Shows this facility's certified or reported bed count compared to other Iowa facilities. Larger communities may offer more amenities, programs, and on-site services for residents and families.Rankings are based only on facilities in Iowa that report data for that category. Facilities without available data are excluded from the ranking.Click the rank badge to see the full State ranking.Click here to see the full State ranking.
A moderately sized community that may balance personal attention with shared amenities and social activities.
Walk Score
Walk Score: 26 / 100 Rank #391 / 528Walk Score — State benchmarkedThis home is ranked 391st out of 528 homes in Iowa. Shows how walkable this facility's neighborhood is compared to the average Walk Score across Iowa facilities. Higher scores benefit residents, families, and staff.Rankings are based only on facilities in Iowa that report data for that category. Facilities without available data are excluded from the ranking.Click the rank badge to see the full State ranking.Click here to see the full State ranking.
Somewhat walkable. A few nearby services may be reachable on foot, but most trips require transportation.

Contact Guttenberg Care Center

Staffing Data

Reporting period: October 1 – December 31, 2025 (Q4 2025). Source: CMS Payroll-Based Journal report.

Total staff 83
Employees 61
Contractors 22
Staff to resident ratio 2.24 : 1
0% compared with State average

State average ratio: 0 : 0

Avg staff/day 22
Average shift 6.6 hours
0% compared with State average

State average: 0 hours

Total staff hours (quarter) 13,441

Nursing staff breakdown

Q4 2025 · Oct 1 – Dec 31 More info This data comes from the CMS Payroll-Based Journal report covering October 1 – December 31, 2025.
Registered Nurse

Manages medical care and health needs.

RN Staff Info 7 total: 5 full-time employees and 2 contractors. 7
Average shift length Info Average shift length. Calculated as total hours divided by days worked and average staff per day. 9.3 hours
Licensed Practical Nurse

Assists with medical care and medications.

LPN Staff Info 8 total: 6 full-time employees and 2 contractors. 8
Average shift length Info Average shift length. Calculated as total hours divided by days worked and average staff per day. 8.9 hours
Certified Nursing Assistant

Helps with daily care and mobility.

CNA Staff Info 46 total: 31 full-time employees and 15 contractors. 46
Average shift length Info Average shift length. Calculated as total hours divided by days worked and average staff per day. 6.7 hours

Contractor staffing

Q4 2025 · Oct 1 – Dec 31 More info This data comes from the CMS Payroll-Based Journal report covering October 1 – December 31, 2025.

Total hours from contractors

4.4%

585 contractor hours this quarter

Certified Nursing Assistant: 15 Licensed Practical Nurse: 2 Registered Nurse: 2 Medication Aide/Technician: 1 Occupational Therapy Assistant: 1 Medical Director: 1

Staff by category

Q4 2025 · Oct 1 – Dec 31 More info This data comes from the CMS Payroll-Based Journal report covering October 1 – December 31, 2025.
Certified Nursing Assistant3115467,09792100%6.7
Licensed Practical Nurse6282,06892100%8.9
Registered Nurse5271,2298693%9.3
Administrator1014605863%7.9
Nurse Practitioner1014445661%7.9
Dental Services Staff1014215964%7.1
Dietitian1013875661%6.9
Speech Language Pathologist1013805964%6.4
Clinical Nurse Specialist1013736267%6
Physical Therapy Aide1012626065%4.4
Other Dietary Services Staff404894852%1.8
Respiratory Therapy Technician303584347%1.3
Qualified Social Worker101533336%1.6
Therapeutic Recreation Specialist101362932%1.3
Occupational Therapy Aide1013078%4.3
Medication Aide/Technician1122444%6
Physical Therapy Assistant1011178%1.6
Occupational Therapy Assistant0111133%3.6
Medical Director011733%2.4
46 Certified Nursing Assistant
% of Days 100%
8 Licensed Practical Nurse
% of Days 100%
7 Registered Nurse
% of Days 93%
1 Administrator
% of Days 63%
1 Nurse Practitioner
% of Days 61%
1 Dental Services Staff
% of Days 64%
1 Dietitian
% of Days 61%
1 Speech Language Pathologist
% of Days 64%
1 Clinical Nurse Specialist
% of Days 67%
1 Physical Therapy Aide
% of Days 65%
4 Other Dietary Services Staff
% of Days 52%
3 Respiratory Therapy Technician
% of Days 47%
1 Qualified Social Worker
% of Days 36%
1 Therapeutic Recreation Specialist
% of Days 32%
1 Occupational Therapy Aide
% of Days 8%
2 Medication Aide/Technician
% of Days 4%
1 Physical Therapy Assistant
% of Days 8%
1 Occupational Therapy Assistant
% of Days 3%
1 Medical Director
% of Days 3%

Penalties and fines

Federal penalties imposed by CMS for regulatory violations, including civil money penalties (fines) and denials of payment for new Medicare/Medicaid admissions.

Source: CMS Penalties Database

No penalties in the past 3 years

No civil money penalties or payment denials were reported in the last 3 years.

Quality of care over time

These measures show how residents usually do over time at this home, based on health outcomes and preventive care.

High-risk clinical events score Info A composite score based on pressure ulcers, falls with injury, weight loss, walking ability decline, and activities of daily living decline. 10.4
In line with State average

State average: 10.2

Functional decline score Info A composite score based on activities of daily living decline, walking ability decline, and incontinence. 24.3
13% worse than State average

State average: 21.6

Long-stay resident measures
Below average State avg: 3.3 Info CMS star rating based on long-stay quality measure performance. 5 stars = significantly above average, 1 star = significantly below average.
Need for Help with Daily Activities Increased Info Percent of long-stay residents whose need for help with daily activities has increased 18.9%
In line with State average

State average: 18.8%

Walking Ability Worsened Info Percent of long-stay residents whose ability to move independently worsened 20.9%
6% worse than State average

State average: 19.7%

Low Risk Residents with Bowel/Bladder Incontinence Info Percent of low risk long-stay residents who lose control of their bowels or bladder 33.1%
26% worse than State average

State average: 26.2%

Falls with Major Injury Info Percent of long-stay residents experiencing one or more falls with major injury 4.8%
33% worse than State average

State average: 3.6%

High Risk Residents with Pressure Ulcers Info Percent of long-stay high risk residents with pressure ulcers 0.6%
87% better than State average

State average: 4.4%

Urinary Tract Infection Info Percent of long-stay residents with a urinary tract infection 2.4%
In line with State average

State average: 2.5%

Lost Too Much Weight Info Percent of long-stay residents who lose too much weight 6.7%
33% worse than State average

State average: 5.0%

Depressive Symptoms Info Percent of long-stay residents who have depressive symptoms 2.8%
28% better than State average

State average: 3.9%

Antipsychotic Use Info Percent of long-stay residents who received an antipsychotic medication 28.8%
52% worse than State average

State average: 19.0%

Pneumococcal Vaccine Info Percent of long-stay residents assessed and appropriately given the pneumococcal vaccine 98.4%
In line with State average

State average: 94.4%

Influenza Vaccine Info Percent of long-stay residents assessed and appropriately given the seasonal influenza vaccine 100.0%
5% better than State average

State average: 95.3%

Hospitalizations per 1,000 days Info Number of hospitalizations per 1,000 long-stay resident days. 2.42
64% worse than State average

State average: 1.48

ED visits per 1,000 days Info Number of outpatient emergency department visits per 1,000 long-stay resident days. 2.93
40% worse than State average

State average: 2.09

Short-stay resident measures
Pneumococcal Vaccine Info Percent of short-stay residents assessed and appropriately given the pneumococcal vaccine 88.9%
5% better than State average

State average: 85.1%

Antipsychotic medication increase Info Percent of short-stay residents who newly received an antipsychotic medication 0.0%
100% better than State average

State average: 1.8%

Influenza Vaccine Info Percent of short-stay residents assessed and appropriately given the seasonal influenza vaccine 91.7%
25% better than State average

State average: 73.3%

Breakdown by payment type

Medicare

21% of new residents, usually for short-term rehab.

Typical stay 26 days

Private pay

58% of new residents, often for short stays.

Typical stay 1 - 2 months

Medicaid

21% of new residents, often for long-term daily care.

Typical stay 9 months

Facility Characteristics

Source: CMS Long-Term Care Facility Characteristics (Data as of Jan 2026)

Total residents 37
Medicare
4
10.8% of residents
Medicaid
23
62.2% of residents
Private pay or other
10
27% of residents
Programs & Services
Nurse Aide Training

State-approved Nurse Aide Training and Competency Evaluation Program on-site

Finances and operations

Based on CMS SNF Cost Report for fiscal year ending in 12/2023.

For-profit
Operated by a single business entity.
Net patient revenue Info Net patient revenue — what the home actually collects for resident care, after contractual allowances, bad debt and discounts are subtracted from its gross charges (CMS cost report, Worksheet G-3). It covers resident care only; money the home earns from other sources is shown separately as "Other income."
$3.8M
Net patient income Info Net patient income: net patient revenue minus the home's total operating expenses. A positive figure means it earns more from resident care than it spends to deliver it; a negative figure means the opposite. It excludes non-operating "other income."
-$321.0K
For-profit Operated by a single business entity.
Net patient revenue Info Net patient revenue — what the home actually collects for resident care, after contractual allowances, bad debt and discounts are subtracted from its gross charges (CMS cost report, Worksheet G-3). It covers resident care only; money the home earns from other sources is shown separately as "Other income."
$3.8M Rank #216 / 251Revenue — State benchmarkedThis home is ranked 216th out of 251 homes in Iowa. Shows this facility's annual revenue compared to the Iowa average. Higher revenue generally means more resources for staffing and capital — read alongside Payroll %.Rankings are based only on facilities in Iowa that report data for that category. Facilities without available data are excluded from the ranking.Click the rank badge to see the full State ranking.Click here to see the full State ranking.
Net patient income Info Net patient income: net patient revenue minus the home's total operating expenses. A positive figure means it earns more from resident care than it spends to deliver it; a negative figure means the opposite. It excludes non-operating "other income."
-$321.0K
Other income Info Money the home earns outside of resident care — such as investments, grants, rentals and other non-operating sources (CMS cost report, Worksheet G-3). It is tracked separately from net patient revenue: it is not part of that figure, and it is not included in net patient income.
$50.6K
Payroll costs Info Staff salaries plus wage-related costs — benefits such as payroll taxes, health insurance and retirement — from the home's own accounting records (CMS cost report, Worksheet A). Contract or agency labor is counted separately, under other operating costs. Rank #198 / 251Payroll — State benchmarkedThis home is ranked 198th out of 251 homes in Iowa. Shows total annual staff payroll benchmarked to the Iowa average. Higher payroll investment relative to peers often signals better staffing and less reliance on cheaper contract labor.Rankings are based only on facilities in Iowa that report data for that category. Facilities without available data are excluded from the ranking.Click the rank badge to see the full State ranking.Click here to see the full State ranking.
$2.5M 64.2% of net patient revenue Info Payroll as a share of revenue: staff salaries and wage-related benefits divided by net patient revenue. A higher figure means more of each revenue dollar goes to staff pay. Rank #67 / 251Payroll % — State benchmarkedThis home is ranked 67th out of 251 homes in Iowa. Shows payroll as a percentage of revenue versus the Iowa average. Well-run Iowa facilities typically land around 61–69% — the top third Statewide. Below 25% may signal understaffing or heavy agency use — read with Staffing ratings.Rankings are based only on facilities in Iowa that report data for that category. Facilities without available data are excluded from the ranking.Click the rank badge to see the full State ranking.Click here to see the full State ranking.
Other operating costs Info Everything it costs to run the home apart from payroll — food, utilities, supplies, maintenance, contract labor and administration. Calculated as total operating expense minus payroll (staff salaries and wage-related benefits).
$1.7M
Total costs Info The home's total operating expense for the year — all the costs of running it, salaries included (CMS cost report, Worksheet G-3).
$4.2M

Who this home usually serves

TYPE OF STAY

Mix of rehab and long-term care

This home supports both short-term rehab and long-term care, with residents staying for a wide range of durations.

Most new residents arrive under private pay (58% of admissions), and a typical private pay stay runs around 1 - 2 months.

Admissions
135 total

Coverage residents most often arrive under.

Medicare 21%
Private pay 58%
Medicaid 21%
Discharges
129 total

Coverage residents most often leave under.

Medicare 11%
Private pay 71%
Medicaid 19%

Places of interest near Guttenberg Care Center

Address 0.0 miles from city center Info Estimated distance in miles from Guttenberg's city center to Guttenberg Care Center's address, calculated via Google Maps.

Calculate Travel Distance to Guttenberg Care Center

Add your location

Address

Compare Nursing Homes around the area

The information below is reported by the Iowa Department of Inspections, Appeals, and Licensing.

Sunrise Retirement Community
NH
AL
IL
MC
RC
SNF
Sioux City -74 A+ 22 Studio
Green Hills Retirement Community
NH
AL
IL
MC
SNF
Ames (Hamilton Drive) -56 - 18 1 Bed / 2 Bed
Mill Pond
NH
AL
IL
MC
SNF
Ankeny -60 - 16 Studio / 1 Bed / 2 Bed
Meth Wick Community
NH
AL
IL
MC
RC
SNF
Cedar Rapids (The Meth-Wick Community) -69 - 23 -
Guttenberg Care Center
NH
AL
Guttenberg -46 - 26 -

Frequently Asked Questions about Guttenberg Care Center

Is Guttenberg Care Center in a walkable area?

Guttenberg Care Center has a walk score of 26. Somewhat walkable. A few nearby services may be reachable on foot, but most trips require transportation.

What is the occupancy rate at Guttenberg Care Center?

Guttenberg Care Center's occupancy is 38.7%.

Does Guttenberg Care Center operate as a for-profit or non-profit?

Guttenberg Care Center is registered as a for-profit.

Are there photos of Guttenberg Care Center?

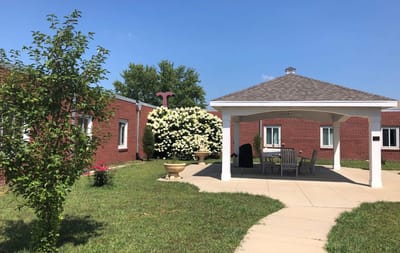
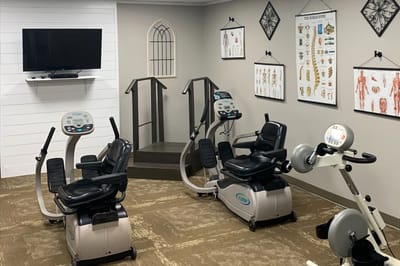
Yes — there are 3 photos of Guttenberg Care Center in the photo gallery on this page.

What is the address of Guttenberg Care Center?

Guttenberg Care Center is located at 1315 Acre Street, Guttenberg, Ia 520529603.

What is the phone number of Guttenberg Care Center?

(563) 252-2281 will put you in contact with the team at Guttenberg Care Center.

Is Guttenberg Care Center Medicare or Medicaid certified?

Yes — Guttenberg Care Center is a CMS-certified provider of Medicare and Medicaid.

Guides for Better Senior Living

Care Cost Calculator: See Prices in Your Area

Nursing Home Data Explorer

Don’t Wait Too Long: 7 Red Flag Signs Your Parent Needs Assisted Living Now

The True Cost of Assisted Living in 2025 – And How Families Are Paying For It

Understanding Senior Living Costs: Pricing Models, Discounts & Financial Assistance