Hale Malamalama
Nursing Home, Hospice Care & Nursing Care · Honolulu, HI
CMS overall rating Info CMS (the Centers for Medicare & Medicaid Services) is the federal agency that rates nursing home quality. Its Overall Rating runs from 1 to 5 stars, combining health inspections, staffing, and quality measures, with inspections weighted most heavily.

Hale Malamalama

Nursing Home, Hospice Care & Nursing Care · Honolulu, HI
CMS overall rating Info CMS (the Centers for Medicare & Medicaid Services) is the federal agency that rates nursing home quality. Its Overall Rating runs from 1 to 5 stars, combining health inspections, staffing, and quality measures, with inspections weighted most heavily.

Overview of Hale Malamalama

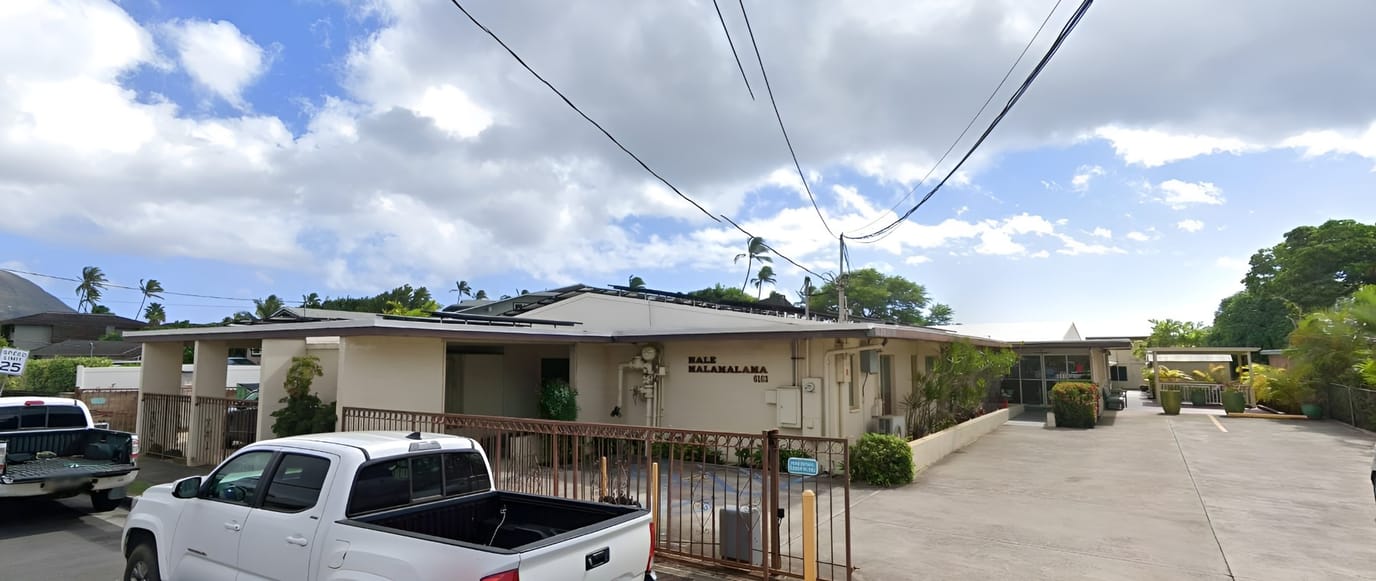
Beautifully set near Kuli’ou Beach Park and Maunalua Bay Beach Park in Summer Street, Honolulu, HI, Hale Malamalama ICF is a blissful haven that offers iskilled nursing and hospice services. With its purposely designed and welcoming accommodations, the community strives to provide exceptional care around the clock for up to 41 residents to ensure comfort and safety. Founded in 1957, the community continuously promotes a warm and nurturing environment for residents to thrive and live up to their potential.

Prioritzing holistic wellness, fun recreational activities and engaging programs are conducted, highlighting their interests and capabilities. Freshly prepared meals are served to satisfy residents’ dietary needs and preferences. The community is Medicaid and Medicare approved, ensuring up-to-standard care without financial constraints. Residents are guaranteed to enjoy their best years with the community’s exceptional services and state-of-the-art amenities.

Quality ratings

Measured by Centers for Medicare & Medicaid Services (CMS)

Overall rating Info The Overall CMS Rating combines results from health inspections, staffing levels and quality measures. Health inspections carry the most weight. Staffing and quality scores can increase or decrease the final rating based on performance compared to state and national standards.
▼ 41.8% Below HI avg. ▼ 41.8% Below HI avg.HI average: 3.4Click the badge to see the full State ranking.Click here to see the full State ranking.
Health Inspection Info Based on the results of the facility's three most recent standard inspections and any complaint investigations. CMS reviews the number, scope, and severity of deficiencies, with more recent findings weighted more heavily.
▼ 65.3% Below HI avg. ▼ 65.3% Below HI avg.HI average: 2.9Click the badge to see the full State ranking.Click here to see the full State ranking.
Staffing Info Measures average nursing staff hours per resident per day, including Registered Nurses (RNs) and total nursing staff. Ratings are adjusted based on the level of care residents require and are compared to state and national benchmarks.
▲ 25.0% Above HI avg. ▲ 25.0% Above HI avg.HI average: 4.0Click the badge to see the full State ranking.Click here to see the full State ranking.
Quality Measures Info Based on clinical and physical health indicators reported to CMS, such as hospital readmissions, falls, pressure ulcers, and improvements in mobility. These measures reflect how well residents' health needs are being managed.
▲ 18.5% Above HI avg. ▲ 18.5% Above HI avg.HI average: 4.2Click the badge to see the full State ranking.Click here to see the full State ranking.

Staffing hours breakdown

Info Daily nursing hours per resident by staff type, reported to CMS. Higher is generally better — compare this facility to state and national averages to see where staffing stands.

Hours per resident per day — compared to Hawaii state averages

Total nursing care / resident Info This home is ranked 22nd out of 33 homes in Hawaii for nurse hours. Total adjusted nursing hours per resident per day, combining RN, LPN, and aide time. CMS adjusts this for case-mix so facilities can be fairly compared.
3h 47m per day
Rank #22 / 33Nurse hours — State benchmarkedThis home is ranked 22nd out of 33 homes in Hawaii. Shows adjusted nurse hours per resident per day benchmarked to the Hawaii average, with a ranking across 33 Hawaii facilities. More hours mean more direct care. The national average is about 3.5 hrs; below 3.0 is a red flag.Rankings are based only on facilities in Hawaii that report data for that category. Facilities without available data are excluded from the ranking.Click the rank badge to see the full State ranking.Click here to see the full State ranking.
This facility Hawaii avg (4h 12m per day)
vs Hawaii avg
-10%

5 of 6 metrics below state avg

Staff typeHours / Day / Residentvs state avg
Registered Nurse (RN) Info RNs hold the highest nursing license and can assess residents, interpret test results, and direct care plans. More RN hours per day often signals stronger clinical oversight and faster response to health changes. 1h 22m per day ▼ 16% State avg: 1h 38m per day · National avg: 41m per day
LPN / LVN Info Licensed Practical Nurses (LPNs) or Licensed Vocational Nurses (LVNs) deliver routine hands-on care — medication administration, wound dressing, and monitoring vital signs. They work under RN supervision and make up a large share of daily bedside care. 6m per day ▼ 74% State avg: 21m per day · National avg: 52m per day
Nurse Aide Info Certified Nurse Aides (CNAs) provide the most direct day-to-day assistance: bathing, dressing, feeding, and mobility. Nurse aide hours are typically the largest staffing category and directly affect residents' quality of life. 2h 41m per day ■ Avg State avg: 2h 44m per day · National avg: 2h 20m per day
Weekend Total Nursing Info Combined nursing hours (RN + LPN + Nurse Aide) per resident per day on weekends. Staffing often drops on weekends — this figure reveals whether the facility maintains adequate coverage outside of weekday hours. 3h 46m per day ▼ 10% State avg: 4h 11m per day · National avg: 3h 26m per day
Physical Therapist Info Hours per resident per day provided by licensed Physical Therapists (PTs) or PT Assistants. PT services help residents recover mobility after injury or illness and are especially important for post-acute (short-stay) rehabilitation. 0m per day ▼ 97% State avg: 5m per day · National avg: 4m per day
Weekend RN Info Registered nurse hours specifically on weekends. Facilities sometimes reduce RN presence on Saturdays and Sundays — a low weekend RN figure compared to weekday hours can indicate reduced clinical oversight when most administrative staff are absent. 54m per day ▼ 27% State avg: 1h 14m per day · National avg: 28m per day

Capacity and availability

This home usually has limited availability

Higher occupancy than the Hawaii average: 74.2%
Occupancy rate
93.5% Rank #3 / 28Occupancy rate — State benchmarkedThis home is ranked 3rd out of 28 homes in Hawaii. Shows this facility's occupancy rate versus the Hawaii average, with its Statewide rank out of 28. Higher occupancy signals strong local demand and financial stability.Rankings are based only on facilities in Hawaii that report data for that category. Facilities without available data are excluded from the ranking.Click the rank badge to see the full State ranking.Click here to see the full State ranking.
Bed community size
40-bed community Rank #30 / 87Bed count — State benchmarkedThis home is ranked 30th out of 87 homes in Hawaii. Shows this facility's certified or reported bed count compared to other Hawaii facilities. Larger communities may offer more amenities, programs, and on-site services for residents and families.Rankings are based only on facilities in Hawaii that report data for that category. Facilities without available data are excluded from the ranking.Click the rank badge to see the full State ranking.Click here to see the full State ranking.
A moderately sized community that may balance personal attention with shared amenities and social activities.
Walk Score
Walk Score: 23 / 100 Rank #131 / 178Walk Score — State benchmarkedThis home is ranked 131st out of 178 homes in Hawaii. Shows how walkable this facility's neighborhood is compared to the average Walk Score across Hawaii facilities. Higher scores benefit residents, families, and staff.Rankings are based only on facilities in Hawaii that report data for that category. Facilities without available data are excluded from the ranking.Click the rank badge to see the full State ranking.Click here to see the full State ranking.
Car-dependent. Most errands require a car, with limited nearby walkable options.

About this community

License Details

CMS Certification Number125050

Staffing

Key information about the people who lead and staff this community.

Leadership

ContactMrs. Pauline Fukumura, Administrator

Contact Hale Malamalama

Inspection History

In Hawaii, the Department of Health, Office of Health Care Assurance performs regular inspections and unannounced surveys to verify that healthcare facilities maintain high standards of resident care.

Since 2022 · 4 years of data 43 deficiencies 4 inspections

Inspection Scorecard Info This scorecard compares key inspection, deficiency, and complaint metrics at this facility against the Hawaii state average. Metrics rated ≥15% worse than average are highlighted in red; those ≥15% better are highlighted in green.

Since 2022 vs. Hawaii state average
Overall vs. HI average 3 Worse Metrics worse than Hawaii average:
• Total deficiencies (72% above)
• Deficiencies per year (71% above)
• Deficiencies per inspection (71% above)
1 At Avg Metrics at Hawaii average:
• Total inspections (at HI avg)
0 Better No metrics in this bucket.
Latest Inspection January 31, 2025 Complaint Investigation

Deficiencies Info Deficiencies are formal regulatory issues recorded during state inspections.

This FacilityHI Averagevs. HI Avg
Total deficiencies Info Formal regulatory issues recorded by inspectors across all inspection types. 4325 This facility has 72% more total deficiencies than a typical Hawaii assisted living residence (43 vs. HI avg 25).↑ 72% worse
Deficiencies per year Info Average deficiencies per year since 2022. 10.86.3 This facility has 71% more deficiencies per year than a typical Hawaii assisted living residence (10.8 vs. HI avg 6.3).↑ 71% worse
Deficiencies per inspection Info Average deficiencies per inspection. 10.86.3 This facility has 71% more deficiencies per inspection than a typical Hawaii assisted living residence (10.8 vs. HI avg 6.3).↑ 71% worse

Inspections Info State inspections evaluate whether the facility meets health and safety standards.

This FacilityHI Averagevs. HI Avg
Total inspections Info Combined count of all routine and focused inspections. Excludes complaint investigations. 44 This facility has total inspections in line with the Hawaii average (4 vs. HI avg 4).— At avg

Health Inspection History

Inspections since 2022
Total health inspections 4

Hawaii average 4.4


Last Health inspection on Jan 2025

Total health citations
43 Rank #26 / 34Health citations — State benchmarkedThis home is ranked 26th out of 34 homes in Hawaii. Shows this facility's total health deficiency citations benchmarked to the Hawaii State average, with a ranking across all 34 HI facilities. Lower citation counts earn a better rank.Rankings are based only on facilities in Hawaii that report data for that category. Facilities without available data are excluded from the ranking.Click the rank badge to see the full State ranking.Click here to see the full State ranking.

Hawaii average 35.5

Citations per inspection
10.75 Rank #30 / 34Citations per inspection — State benchmarkedThis home is ranked 30th out of 34 homes in Hawaii. Shows average deficiency citations per CMS inspection for this facility versus the Hawaii mean across 34 facilities with citation data. Lower is better.Rankings are based only on facilities in Hawaii that report data for that category. Facilities without available data are excluded from the ranking.Click the rank badge to see the full State ranking.Click here to see the full State ranking.

Hawaii average 8.23


Health citations are formal notices following inspections when they fail to comply with safety and care standards.

37 of 43 citations resulted from standard inspections; and 6 of 43 resulted from complaint investigations.

Breakdown of citation severity (last 4 years)
Critical health citations
0
100% better than Hawaii average

Hawaii average: 0.1


Serious health citations
3
200% worse than Hawaii average

Hawaii average: 1

0 critical citations Hawaii average: 0.1

3 serious citations Hawaii average: 1

40 moderate citations Hawaii average: 34.2

0 minor citations Hawaii average: 0.1
Citations history (last 4 years)
Abuse/Neglect serious citation Jan 31, 2025
Corrected

Abuse/Neglect moderate citation Jan 31, 2025
Corrected

Abuse/Neglect moderate citation Jan 31, 2025
Corrected

Quality of Care moderate citation Jan 31, 2025
Corrected

Staffing Data

Reporting period: October 1 – December 31, 2025 (Q4 2025). Source: CMS Payroll-Based Journal report.

Total staff 59
Employees 25
Contractors 34
Staff to resident ratio 1.74 : 1
5% more staff per resident than Hawaii average
Hawaii average ratio: 1.65 : 1 Hawaii average ratio: 1.65 : 1See full Hawaii ranking
Avg staff/day 20
Average shift 8.9 hours
14% better than Hawaii average
Hawaii average: 7.8 hours Hawaii average shift: 7.8 hoursSee full Hawaii ranking
Total staff hours (quarter) 16,393

Nursing staff breakdown

Q4 2025 · Oct 1 – Dec 31 More info This data comes from the CMS Payroll-Based Journal report covering October 1 – December 31, 2025.
Registered Nurse

Manages medical care and health needs.

RN Staff Info 8 total: 5 full-time employees and 3 contractors. 8
Average shift length Info Average shift length. Calculated as total hours divided by days worked and average staff per day. 8.9 hours
Licensed Practical Nurse

Assists with medical care and medications.

LPN Staff Info All 2 LPN Staff are contractors. 2
Average shift length Info Average shift length. Calculated as total hours divided by days worked and average staff per day. 8 hours
Certified Nursing Assistant

Helps with daily care and mobility.

CNA Staff Info 28 total: 11 full-time employees and 17 contractors. 28
Average shift length Info Average shift length. Calculated as total hours divided by days worked and average staff per day. 9.4 hours

Contractor staffing

Q4 2025 · Oct 1 – Dec 31 More info This data comes from the CMS Payroll-Based Journal report covering October 1 – December 31, 2025.

Total hours from contractors

27.5%

4,501 contractor hours this quarter

Certified Nursing Assistant: 17 Qualified Social Worker: 4 Registered Nurse: 3 Licensed Practical Nurse: 2 Physical Therapy Assistant: 2 Medical Director: 1 Occupational Therapy Aide: 1 Occupational Therapy Assistant: 1 Respiratory Therapy Technician: 1 Physical Therapy Aide: 1 Speech Language Pathologist: 1

Staff by category

Q4 2025 · Oct 1 – Dec 31 More info This data comes from the CMS Payroll-Based Journal report covering October 1 – December 31, 2025.
Certified Nursing Assistant1117288,61692100%9.4
Registered Nurse5382,87292100%8.9
Administrator3031,4856672%7.5
Clinical Nurse Specialist2021,0317076%9.9
Dental Services Staff1016886470%10.7
Nurse Practitioner1014886571%7.5
Dietitian1014115358%7.8
Other Dietary Services Staff1013504448%7.9
Licensed Practical Nurse0222963740%8
Occupational Therapy Aide011571314%4.4
Medical Director011281415%2
Speech Language Pathologist011191415%1.3
Physical Therapy Aide011171314%1.3
Occupational Therapy Assistant0111233%4
Qualified Social Worker0441178%1.3
Respiratory Therapy Technician011955%1.8
Physical Therapy Assistant022633%1.8
28 Certified Nursing Assistant
% of Days 100%
8 Registered Nurse
% of Days 100%
3 Administrator
% of Days 72%
2 Clinical Nurse Specialist
% of Days 76%
1 Dental Services Staff
% of Days 70%
1 Nurse Practitioner
% of Days 71%
1 Dietitian
% of Days 58%
1 Other Dietary Services Staff
% of Days 48%
2 Licensed Practical Nurse
% of Days 40%
1 Occupational Therapy Aide
% of Days 14%
1 Medical Director
% of Days 15%
1 Speech Language Pathologist
% of Days 15%
1 Physical Therapy Aide
% of Days 14%
1 Occupational Therapy Assistant
% of Days 3%
4 Qualified Social Worker
% of Days 8%
1 Respiratory Therapy Technician
% of Days 5%
2 Physical Therapy Assistant
% of Days 3%

Penalties and fines

Includes penalties issued in 2023-2025

Federal penalties imposed by CMS for regulatory violations, including civil money penalties (fines) and denials of payment for new Medicare/Medicaid admissions.

Source: CMS Penalties Database (Data as of Jan 2026)

Total fines amount $87K Rank #32 / 34Federal fines — State benchmarkedThis home is ranked 32nd out of 34 homes in Hawaii. Shows this facility's cumulative CMS federal fine dollars versus the Hawaii average among facilities with fines, and where it ranks among 34 facilities in the pool. Lower total dollars mean a better rank.Rankings are based only on facilities in Hawaii that report data for that category. Facilities without available data are excluded from the ranking.Click the rank badge to see the full State ranking.Click here to see the full State ranking.
130% higher than Hawaii average

Hawaii average: $38K

Number of fines 2
32% more fines than Hawaii average

Hawaii average: 1.5

Payment Denials Info Serious action where Medicare and/or Medicaid temporarily stops payments for new residents until issues are fixed. 0
100% fewer payment denials than Hawaii average

Hawaii average: 0.1

Fines amount comparison
This facility $87K
Hawaii average $38K
Penalty History

Penalties are imposed by CMS for violations of federal nursing home regulations.

2 penalties in the past 3 years

Multiple penalties were reported in the last 3 years.

Civil Money Penalty Info Fines imposed for noncompliance, which can be assessed per day or per instance of violation. Jan 31, 2025
$72K
Civil Money Penalty Info Fines imposed for noncompliance, which can be assessed per day or per instance of violation. Sep 15, 2023
$15K

Last updated: Jan 2026

Quality of care over time

These measures show how residents usually do over time at this home, based on health outcomes and preventive care.

High-risk clinical events score Info A composite score based on pressure ulcers, falls with injury, weight loss, walking ability decline, and activities of daily living decline. 7.4
28% better than Hawaii average

Hawaii average: 10.2

Functional decline score Info A composite score based on activities of daily living decline, walking ability decline, and incontinence. 16.5
17% better than Hawaii average

Hawaii average: 20.0

Long-stay resident measures
Significantly above average Hawaii avg: 4.4 Info CMS star rating based on long-stay quality measure performance. 5 stars = significantly above average, 1 star = significantly below average.
Need for Help with Daily Activities Increased Info Percent of long-stay residents whose need for help with daily activities has increased 13.3%
24% better than Hawaii average

Hawaii average: 17.6%

Walking Ability Worsened Info Percent of long-stay residents whose ability to move independently worsened 22.2%
14% better than Hawaii average

Hawaii average: 25.8%

Low Risk Residents with Bowel/Bladder Incontinence Info Percent of low risk long-stay residents who lose control of their bowels or bladder 14.0%
24% better than Hawaii average

Hawaii average: 18.3%

Falls with Major Injury Info Percent of long-stay residents experiencing one or more falls with major injury 0.0%
100% better than Hawaii average

Hawaii average: 2.1%

High Risk Residents with Pressure Ulcers Info Percent of long-stay high risk residents with pressure ulcers 1.3%
65% better than Hawaii average

Hawaii average: 3.6%

Urinary Tract Infection Info Percent of long-stay residents with a urinary tract infection 0.0%
100% better than Hawaii average

Hawaii average: 2.4%

Lost Too Much Weight Info Percent of long-stay residents who lose too much weight 0.0%
100% better than Hawaii average

Hawaii average: 4.7%

Depressive Symptoms Info Percent of long-stay residents who have depressive symptoms 0.0%
100% better than Hawaii average

Hawaii average: 1.5%

Antipsychotic Use Info Percent of long-stay residents who received an antipsychotic medication 9.9%
In line with Hawaii average

Hawaii average: 10.1%

Pneumococcal Vaccine Info Percent of long-stay residents assessed and appropriately given the pneumococcal vaccine 98.5%
In line with Hawaii average

Hawaii average: 96.3%

Influenza Vaccine Info Percent of long-stay residents assessed and appropriately given the seasonal influenza vaccine 100.0%
5% better than Hawaii average

Hawaii average: 95.4%

Hospitalizations per 1,000 days Info Number of hospitalizations per 1,000 long-stay resident days. 1.55
16% worse than Hawaii average

Hawaii average: 1.34

ED visits per 1,000 days Info Number of outpatient emergency department visits per 1,000 long-stay resident days. 0.65
27% better than Hawaii average

Hawaii average: 0.89

Short-stay resident measures
Pneumococcal Vaccine Info Percent of short-stay residents assessed and appropriately given the pneumococcal vaccine 77.4%
7% worse than Hawaii average

Hawaii average: 83.4%

Facility Characteristics

Source: CMS Long-Term Care Facility Characteristics (Data as of Jan 2026)

Total residents 34
Medicaid
12
35.3% of residents
Private pay or other
22
64.7% of residents
Programs & Services
Residents Group

Residents meet regularly to discuss policies, care quality, and activities

Active Resident Council

Organized group of residents that meets regularly to discuss facility policies, quality of life, and activities.

What does this home offer?

Housing options icon

Housing Options: Private / Shared Rooms

Building type icon
Building type icon

Building Type: Single-story

Housekeeping icon
Housekeeping icon

Housekeeping Services

Social and recreational activities icon

Social and Recreational Activities

Exercise program icon

Exercise Programs

Places of interest near Hale Malamalama

Address 9.8 miles from city center Info Estimated distance in miles from Honolulu's city center to Hale Malamalama's address, calculated via Google Maps.

Calculate Travel Distance to Hale Malamalama

Add your location

Address

Compare Assisted Living around Honolulu

The information below is reported by the Hawaii Department of Health, Office of Health Care Assurance.

Hale Malamalama
AL
HC
NC
NH
Honolulu (Kuliouou - Kalani Iki) -
40
Facility 40
HI AVG 43
Rank #30 / 87
-
23
Facility 23
HI AVG 49
Rank #131 / 178
Private / Shared Rooms
15 Craigside
AL
ADC
HC
IL
NH
Honolulu (Nuuanu - Punchbowl) -
45
Facility 45
HI AVG 43
Rank #26 / 87
A+
50
Facility 50
HI AVG 49
Rank #85 / 178
Studio / 1 Bed
Avalon Care Center – Honolulu
AL
NH
Honolulu (Kalihi Valley) -
108
Facility 108
HI AVG 43
Rank #10 / 87
A+
47
Facility 47
HI AVG 49
Rank #93 / 178
-
Arcadia Retirement Residence
AL
ADC
HC
IL
NC
NH
Honolulu (Makiki/Lower/ Punchbowl/Tantalus) -
91
Facility 91
HI AVG 43
Rank #18 / 87
A+
86
Facility 86
HI AVG 49
Rank #27 / 178
-
Kalākaua Gardens
AL
IL
MC
NH
RC
Honolulu (Ala Moana) -
49
Facility 49
HI AVG 43
Rank #24 / 87
-
98
Facility 98
HI AVG 49
Rank #3 / 178
Studio / 1 Bed

Financial Assistance for
Assisted Living in Hawaii

Hale Malamalama is located in Honolulu, Hawaii.
Here are the financial assistance programs available to residents in Hawaii.

Get Financial aid guidance

QUEST Integration

Hawaii Medicaid QUEST Integration

Age 65+ or disabled
General Hawaii resident, Medicaid-eligible, long-term care need.
Income Limits (2025) ~$2,829/month 300% FBR, individual
Asset Limits $2,000 (individual), $3,000 (couple).
HI

High cost of living adjustments.

Benefits
In-home care (6-8 hours/day) Nursing home Respite (240 hours/year) Medical services

Kupuna Care

Hawaii Kupuna Care

Age 60+
General Hawaii resident, unable to perform 2+ ADLs.
Income Limits No strict limit; prioritizes low-income.
Asset Limits Not applicable.
HI

Limited funding; island-specific delivery.

Benefits
In-home care (3-5 hours/week) Adult day care (~$70/day) Transportation (~5 trips/month)

Program of All-Inclusive Care for the Elderly (PACE)

Hawaii Medicaid PACE

Age 55+
General Hawaii resident, nursing home-level care need, safe with PACE support.
Income Limits (2025) ~$2,829/month 300% FBR
Asset Limits $2,000 (individual), $3,000 (couple).
HI

Limited to Oahu (e.g., Maluhia in Honolulu); few providers.

Benefits
Personal care (5-7 hours/day) Medical care Meals Transportation Therapy Respite

Medicare Savings Program (MSP)

Hawaii Medicare Savings Program

Age 65+ or disabled
General Hawaii resident, Medicare Part A/B.
Income Limits (2025) ~$2,510/month (QMB), ~$3,380/month (SLMB), ~$3,598/month (QI)—individual, adjusted annually.
Asset Limits $9,430 (individual), $14,130 (couple).
HI

Three tiers; no waitlist.

Benefits
Covers Part B premiums ($174.70/month) Deductibles ($240/year) Copays (~20%)

National Family Caregiver Support Program (NFCSP) Respite

Hawaii NFCSP Respite Care

Age
General Caregivers of 60+ needing care or 55+ caregivers of others; Hawaii resident; functional needs (2+ ADLs).
Income Limits (2025) Prioritizes ~$24,980/year (individual); no strict cap.
Asset Limits Not assessed; need-based.
HI

Four county AAAs; prioritizes low-income.

Benefits
Respite (4-6 hours/week or 5 days/year) Adult day care ($80/day) Counseling

VA Aid and Attendance (A&A) and Housebound Benefits

Hawaii VA Aid and Attendance/Housebound

Age 65+ or disabled veteran/surviving spouse
General Hawaii resident, wartime service, need for aid with ADLs (A&A) or homebound status.
Income Limits (2025) Net income < ~$1,984/month (veteran with dependent, A&A); pension offsets income.
Asset Limits ~$155,356 2025 net worth limit
HI

Applies statewide; high demand due to veteran population.

Benefits
Cash (~$1,433-$2,642/month veteran, ~$951-$1,318 spouse) for care costs (e.g., in-home, assisted living)

Senior Companion Program (SCP)

Hawaii Senior Companion Program

Age
General Volunteers: 55+, low-income, Hawaii resident, able to work 20 hours/week. Recipients: Frail elders needing companionship.
Income Limits (2025) Volunteers: ~$24,980/year (200% FPL); recipients: no limit.
Asset Limits Not specified for volunteers; need-based for recipients.
HI

Statewide; managed by DHS Social Services.

Benefits
Volunteers paid ~$4/hour for companionship (~20 hours/week); recipients get free support (~4-6 hours/week)

Frequently Asked Questions about Hale Malamalama

What neighborhood is Hale Malamalama in?

Hale Malamalama is in the Kuliouou - Kalani Iki neighborhood of Honolulu.

Is Hale Malamalama in a walkable area?

Hale Malamalama has a walk score of 23. Car-dependent. Most errands require a car, with limited nearby walkable options.

What is the occupancy rate at Hale Malamalama?

Hale Malamalama's occupancy is 93.5%.

Does Hale Malamalama operate as a for-profit or non-profit?

Hale Malamalama is registered as a for-profit in HI.

Are there photos of Hale Malamalama?

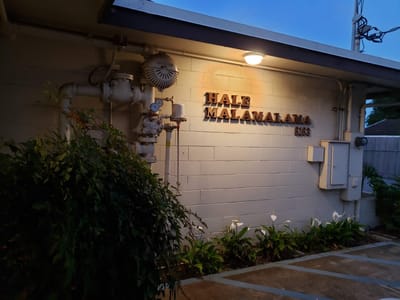
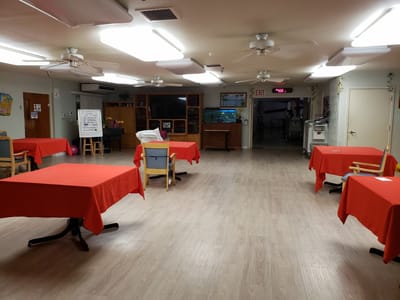
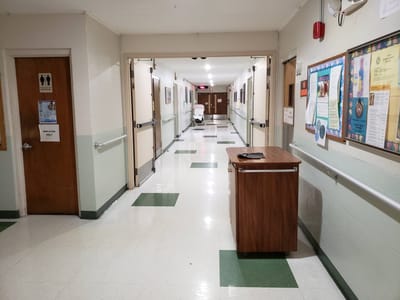
Yes — there are 4 photos of Hale Malamalama in the photo gallery on this page.

What is the address of Hale Malamalama?

Hale Malamalama is located at 6163 Summer St, Honolulu, HI 96821.

What is the phone number of Hale Malamalama?

(808) 396-0537 will put you in contact with the team at Hale Malamalama.

Guides for Better Senior Living

Care Cost Calculator: See Prices in Your Area

Nursing Home Data Explorer

Don’t Wait Too Long: 7 Red Flag Signs Your Parent Needs Assisted Living Now

The True Cost of Assisted Living in 2025 – And How Families Are Paying For It

Understanding Senior Living Costs: Pricing Models, Discounts & Financial Assistance