


Total staff
92
Employees
87
Contractors
5


Fifty-eight beds, 95.1% occupied. At that fill rate, Harrington Park is running close to capacity, and the 117-day average length of stay reflects a facility that moves residents in and out regularly, blending short-term rehabilitation with longer-term skilled nursing and hospice care. That combination is not standard for a community this size, and it gives Harrington Park a broader clinical scope than a pure post-acute facility.
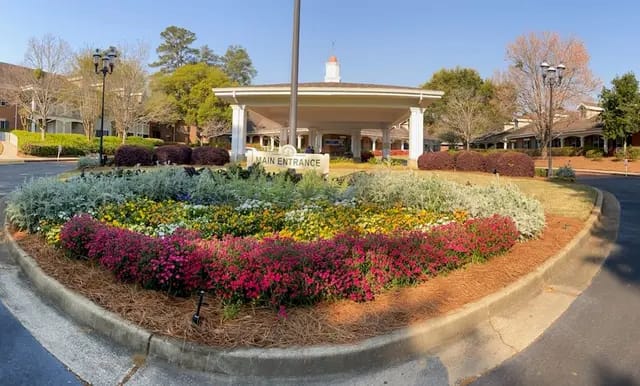
The address is 511 Pleasant Home Rd in Augusta’s Foxhall neighborhood, a somewhat walkable area (Walk Score 37) about six miles from the city center, with most outside trips requiring a car. A cardiology specialist office sits about 1.4 miles away. Medicare and private pay are accepted.
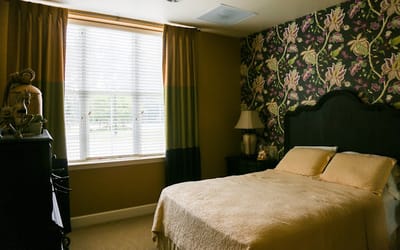
Nursing staffing comes to 3 hours and 42 minutes of total care per resident per day, with registered nurses covering 35 minutes and certified nurse aides 2 hours and 8 minutes. The amenity set is practical and varied: Wi-Fi, housekeeping, laundry, a beauty and barbershop, a therapeutic whirlpool tub, and sitting areas outfitted with glider rockers and adjustable beds. Social programming runs from a garden club and live musical performances to sports teams and a men’s group. An active Resident Council gives residents a regular channel for engaging on care quality and facility operations.
For families navigating Augusta’s nursing home options, Harrington Park offers a high-occupancy, multi-modal care setting with hospice services built in and an amenity profile that goes beyond the clinical minimum.
| Staff type | Hours / Day / Resident | vs state avg |
|---|---|---|
|
Registered Nurse (RN)
| 35m per day | ▲ 18% State avg: 30m per day · National avg: 41m per day |
|
LPN / LVN
| 40m per day | ▼ 28% State avg: 56m per day · National avg: 52m per day |
|
Nurse Aide
| 2h 8m per day | ■ Avg State avg: 2h 9m per day · National avg: 2h 21m per day |
|
Weekend Total Nursing
| 2h 56m per day | ▼ 5% State avg: 3h 6m per day · National avg: 3h 26m per day |
|
Physical Therapist
| 4m per day | ▲ 36% State avg: 3m per day · National avg: 4m per day |
|
Weekend RN
| 17m per day | ▼ 17% State avg: 20m per day · National avg: 29m per day |
Reporting period: October 1 – December 31, 2025 (Q4 2025). Source: CMS Payroll-Based Journal report.
Manages medical care and health needs.
Assists with medical care and medications.
Helps with daily care and mobility.
Total hours from contractors
210 contractor hours this quarter
| Certified Nursing Assistant | 38 | 0 | 38 | 7,600 | 92 | 100% | 7.8 |
| Licensed Practical Nurse | 12 | 0 | 12 | 3,399 | 92 | 100% | 10.4 |
| Medication Aide/Technician | 9 | 0 | 9 | 3,178 | 92 | 100% | 8.1 |
| Clinical Nurse Specialist | 4 | 0 | 4 | 1,419 | 77 | 84% | 7.9 |
| Registered Nurse | 3 | 0 | 3 | 1,002 | 84 | 91% | 8.3 |
| Nurse Practitioner | 1 | 1 | 2 | 560 | 67 | 73% | 7.8 |
| Dietitian | 1 | 0 | 1 | 546 | 65 | 71% | 8.4 |
| Dental Services Staff | 1 | 0 | 1 | 499 | 62 | 67% | 8 |
| Administrator | 4 | 0 | 4 | 448 | 56 | 61% | 8 |
| Speech Language Pathologist | 3 | 0 | 3 | 379 | 55 | 60% | 6.4 |
| Physical Therapy Aide | 3 | 0 | 3 | 377 | 61 | 66% | 4.1 |
| Respiratory Therapy Technician | 3 | 0 | 3 | 342 | 66 | 72% | 4.3 |
| Qualified Social Worker | 2 | 0 | 2 | 320 | 59 | 64% | 4.3 |
| Physical Therapy Assistant | 3 | 1 | 4 | 169 | 39 | 42% | 3.9 |
| Occupational Therapy Aide | 0 | 1 | 1 | 45 | 9 | 10% | 5 |
| Occupational Therapy Assistant | 0 | 1 | 1 | 16 | 6 | 7% | 2.7 |
| Medical Director | 0 | 1 | 1 | 6 | 3 | 3% | 1.8 |
Federal penalties imposed by CMS for regulatory violations, including civil money penalties (fines) and denials of payment for new Medicare/Medicaid admissions.
Source: CMS Penalties Database (Data as of Jan 2026)
Georgia average: $40K
Georgia average: 2.1
Georgia average: 0.3
No penalties in the past 3 years
No civil money penalties or payment denials were reported in the last 3 years.
These measures show how residents usually do over time at this home, based on health outcomes and preventive care.
Georgia average: 10.3
Georgia average: 17.4
Georgia average: 16.8%
Georgia average: 19.4%
Georgia average: 16.1%
Georgia average: 3.2%
Georgia average: 6.3%
Georgia average: 2.5%
Georgia average: 6.0%
Georgia average: 8.7%
Georgia average: 19.1%
Georgia average: 91.5%
Georgia average: 95.0%
Georgia average: 2.18
Georgia average: 1.97
Georgia average: 80.6%
Georgia average: 2.2%
Georgia average: 78.2%
Georgia average: 24.2%
Georgia average: 12.2%
Georgia average: 0.8%
Georgia average: 53.7%
Georgia average: 50.6%
Quality measures are calculated from Minimum Data Set (MDS) assessments. For most measures, lower percentages indicate better care quality.
47% of new residents, usually for short-term rehab.
53% of new residents, often for short stays.
Source: CMS Long-Term Care Facility Characteristics (Data as of Jan 2026)
Residents meet regularly to discuss policies, care quality, and activities
Organized group of residents that meets regularly to discuss facility policies, quality of life, and activities.
Data sourced from CMS Long-Term Care Facility Characteristics quarterly report. Payer mix reflects the current resident census by primary payment source.
Historical financial and operational data for Harrington Park from 2017–2024, based on CMS SNF Cost Reports.
Key figures below are for fiscal year ending in 06/2024.
Based on CMS SNF Cost Report for fiscal year ending in 06/2024.
This home supports both short-term rehab and long-term care, with residents staying for a wide range of durations.
Most new residents arrive under private pay (53% of admissions), and a typical private pay stay runs around 5 - 6 months.
Coverage residents most often arrive under.
Coverage residents most often leave under.
![]() 3.8 miles from city center
3.8 miles from city center
![]() Estimated distance in miles from Augusta's city center to Harrington Park's address, calculated via Google Maps.
Estimated distance in miles from Augusta's city center to Harrington Park's address, calculated via Google Maps.
Add your location
Info below is compiled from CMS reports & the GA Dept. of Community Health (DCH), senior community websites & trusted data sources such as Walk Score & BBB.
Communities are listed from highest to lowest based on our ranking methodology.
| Stevens Park Health & Rehabilitation | NH | Augusta (Bonair) | 42
Facility
42
GA AVG
87
Rank
#552 / 664 |
95.2%
Facility
95.2%
GA AVG
79.3
Rank
#16 / 155 | +20% | 4.21
Facility
4.21
GA AVG
3.56
Rank
#30 / 183 | +69% | +18% | $0
Facility
$0
GA AVG
$38.9k
Rank
#1 / 185 | 3
Facility
3
GA AVG
16.6
Rank
#10 / 184 | 1.5
Facility
1.5
GA AVG
4.7
Rank
#12 / 184 | - | 40 | - |
26
Facility
26
GA AVG
39
Rank
#568 / 870 | Tina Lane | $4.4MFiscal year ending 06/2024
Facility
$4.4MFiscal year ending 06/2024
GA AVG
$15.7M
Rank
#171 / 179 | $2.9MFiscal year ending 06/2024
Facility
$2.9MFiscal year ending 06/2024
GA AVG
$4.3M
Rank
#162 / 179 | 66%Fiscal year ending 06/2024
Facility
66%Fiscal year ending 06/2024
GA AVG
42.6%
Rank
#34 / 179 | 115294 | ||||
| PruittHealth Augusta Hills | NH HOS SNF | Augusta (Summerville) | 126
Facility
126
GA AVG
87
Rank
#104 / 664 |
66.7%
Facility
66.7%
GA AVG
79.3
Rank
#130 / 155 | -16% | 3.20
Facility
3.20
GA AVG
3.56
Rank
#108 / 183 | +2% | -10% | $6.2k
Facility
$6.2k
GA AVG
$38.9k
Rank
#124 / 185 | 6
Facility
6
GA AVG
16.6
Rank
#23 / 184 | 3.0
Facility
3.0
GA AVG
4.7
Rank
#37 / 184 | - | 84 | - |
66
Facility
66
GA AVG
39
Rank
#136 / 870 | Regina Bell | $8.5MFiscal year ending 06/2024
Facility
$8.5MFiscal year ending 06/2024
GA AVG
$15.7M
Rank
#109 / 179 | $4.4MFiscal year ending 06/2024
Facility
$4.4MFiscal year ending 06/2024
GA AVG
$4.3M
Rank
#112 / 179 | 52.1%Fiscal year ending 06/2024
Facility
52.1%Fiscal year ending 06/2024
GA AVG
42.6%
Rank
#100 / 179 | 115672 | ||||
| Harrington Park | NH HOS | Augusta (Foxhall) | 58
Facility
58
GA AVG
87
Rank
#469 / 664 |
94.5%
Facility
94.5%
GA AVG
79.3
Rank
#19 / 155 | +19% | 3.70
Facility
3.70
GA AVG
3.56
Rank
#63 / 183 | -62% | +4% | $0
Facility
$0
GA AVG
$38.9k
Rank
#1 / 185 | 10
Facility
10
GA AVG
16.6
Rank
#50 / 184 | 2.5
Facility
2.5
GA AVG
4.7
Rank
#21 / 184 | 3 | 55 | - |
37
Facility
37
GA AVG
39
Rank
#471 / 870 | Andrea Howard | $6.3MFiscal year ending 06/2024
Facility
$6.3MFiscal year ending 06/2024
GA AVG
$15.7M
Rank
#150 / 179 | $3.5MFiscal year ending 06/2024
Facility
$3.5MFiscal year ending 06/2024
GA AVG
$4.3M
Rank
#113 / 179 | 56.1%Fiscal year ending 06/2024
Facility
56.1%Fiscal year ending 06/2024
GA AVG
42.6%
Rank
#22 / 179 | 115725 | ||||
| Amara Health Care & Rehab | NH HOS RC SNF | Augusta (Southlands) | 193
Facility
193
GA AVG
87
Rank
#31 / 664 |
28.0%
Facility
28.0%
GA AVG
79.3
Rank
#153 / 155 | -65% | 4.63
Facility
4.63
GA AVG
3.56
Rank
#21 / 183 | +9% | +30% | $0
Facility
$0
GA AVG
$38.9k
Rank
#1 / 185 | 3
Facility
3
GA AVG
16.6
Rank
#10 / 184 | 3.0
Facility
3.0
GA AVG
4.7
Rank
#37 / 184 | - | 54 | - |
35
Facility
35
GA AVG
39
Rank
#485 / 870 | - | - | - | - | 115777 | ||||
| PruittHealth Augusta | NH HOS SNF | Augusta (Forest Acres) | 100
Facility
100
GA AVG
87
Rank
#192 / 664 |
87.0%
Facility
87.0%
GA AVG
79.3
Rank
#63 / 155 | +10% | 2.72
Facility
2.72
GA AVG
3.56
Rank
#168 / 183 | -2% | -24% | $177.7k
Facility
$177.7k
GA AVG
$38.9k
Rank
#181 / 185 | 26
Facility
26
GA AVG
16.6
Rank
#143 / 184 | 6.5
Facility
6.5
GA AVG
4.7
Rank
#145 / 184 | 2 | 87 | - |
44
Facility
44
GA AVG
39
Rank
#385 / 870 | Christina Engel | $9.5MFiscal year ending 06/2024
Facility
$9.5MFiscal year ending 06/2024
GA AVG
$15.7M
Rank
#103 / 179 | $5.3MFiscal year ending 06/2024
Facility
$5.3MFiscal year ending 06/2024
GA AVG
$4.3M
Rank
#86 / 179 | 56.5%Fiscal year ending 06/2024
Facility
56.5%Fiscal year ending 06/2024
GA AVG
42.6%
Rank
#56 / 179 | 115334 |
Harrington Park is located in Augusta, Georgia.
Here are the financial assistance programs available to residents in Georgia.
Harrington Park is in the Foxhall neighborhood.
Harrington Park has a walk score of 37. Somewhat walkable. A few nearby services may be reachable on foot, but most trips require transportation.
Harrington Park's occupancy is 95.1%.
No, Harrington Park has a no-pet policy.
Harrington Park is registered as a non-profit.
Yes — there are 4 photos of Harrington Park in the photo gallery on this page.
Harrington Park is located at 511 Pleasant Home Rd, Augusta, GA 30907.
Care Cost Calculator: See Prices in Your Area
Nursing Home Data Explorer
Don’t Wait Too Long: 7 Red Flag Signs Your Parent Needs Assisted Living Now
The True Cost of Assisted Living in 2025 – And How Families Are Paying For It
Understanding Senior Living Costs: Pricing Models, Discounts & Financial Assistance


