The Healthcare Resort of Colorado Springs
Nursing Home · Colorado Springs, CO
CMS overall rating Info The Overall CMS Rating is scored from 1 to 5 stars and combines results from health inspections, staffing levels, and quality measures. Health inspections carry the most weight. Staffing and quality scores can increase or decrease the final rating based on performance compared to state and national standards.

The Healthcare Resort of Colorado Springs

Nursing Home · Colorado Springs, CO
CMS overall rating Info The Overall CMS Rating is scored from 1 to 5 stars and combines results from health inspections, staffing levels, and quality measures. Health inspections carry the most weight. Staffing and quality scores can increase or decrease the final rating based on performance compared to state and national standards.
Calculator: See prices in your area
The Healthcare Resort of Colorado Springs accepts Medicare and private pay.

Overview of The Healthcare Resort of Colorado Springs

The Healthcare Resort of Colorado Springs is changing the way that healthcare is being delivered to the Colorado Springs and surrounding Rocky Mountain area. With the fusion of world-class healthcare and personalized hospitality, guests encounter an experience that is truly unique and memorable. The facility offers rehabilitation therapy and a resort-like setting for recovery.

Quality ratings

Measured by Centers for Medicare & Medicaid Services (CMS)

Overall rating Info The Overall CMS Rating combines results from health inspections, staffing levels and quality measures. Health inspections carry the most weight. Staffing and quality scores can increase or decrease the final rating based on performance compared to state and national standards.
▼ 5.4% Below CO avg. ▼ 5.4% Below CO avg.Click the badge to see the full State ranking.Click here to see the full State ranking.
Health Inspection Info Based on the results of the facility's three most recent standard inspections and any complaint investigations. CMS reviews the number, scope, and severity of deficiencies, with more recent findings weighted more heavily.
▼ 28.6% Below CO avg. ▼ 28.6% Below CO avg.Click the badge to see the full State ranking.Click here to see the full State ranking.
Staffing Info Measures average nursing staff hours per resident per day, including Registered Nurses (RNs) and total nursing staff. Ratings are adjusted based on the level of care residents require and are compared to state and national benchmarks.
▲ 27.4% Above CO avg. ▲ 27.4% Above CO avg.Click the badge to see the full State ranking.Click here to see the full State ranking.
Quality Measures Info Based on clinical and physical health indicators reported to CMS, such as hospital readmissions, falls, pressure ulcers, and improvements in mobility. These measures reflect how well residents' health needs are being managed.
▲ 21.4% Above CO avg. ▲ 21.4% Above CO avg.Click the badge to see the full State ranking.Click here to see the full State ranking.

Staffing hours breakdown

Info Daily nursing hours per resident by staff type, reported to CMS. Higher is generally better — compare this facility to state and national averages to see where staffing stands.

Hours per resident per day — compared to Colorado state averages

Total nursing care / resident Info This home is ranked 45th out of 177 homes in Colorado. Total adjusted nursing hours per resident per day, combining RN, LPN, and aide time. CMS adjusts this for case-mix so facilities can be fairly compared.
4h 14m per day
Rank #45 / 177Nurse hours — State benchmarkedThis home is ranked 45th out of 177 homes in Colorado. Shows adjusted nurse hours per resident per day benchmarked to the Colorado average, with a ranking across 177 Colorado SNFs. More hours mean more direct care. The national average is about 3.5 hrs; below 3.0 is a red flag.Click the rank badge to see the full State ranking.Click here to see the full State ranking.
This facility Colorado avg (3h 51m per day)
vs Colorado avg
+10%

1 of 6 metrics below state avg

Standout metric Physical Therapist is +180% above state avg
Staff typeHours / Day / Residentvs state avg
Registered Nurse (RN) Info RNs hold the highest nursing license and can assess residents, interpret test results, and direct care plans. More RN hours per day often signals stronger clinical oversight and faster response to health changes. 55m per day ▲ 10% State avg: 50m per day · National avg: 41m per day
LPN / LVN Info Licensed Practical Nurses (LPNs) or Licensed Vocational Nurses (LVNs) deliver routine hands-on care — medication administration, wound dressing, and monitoring vital signs. They work under RN supervision and make up a large share of daily bedside care. 59m per day ▲ 44% State avg: 41m per day · National avg: 52m per day
Nurse Aide Info Certified Nurse Aides (CNAs) provide the most direct day-to-day assistance: bathing, dressing, feeding, and mobility. Nurse aide hours are typically the largest staffing category and directly affect residents' quality of life. 2h 37m per day ▲ 19% State avg: 2h 12m per day · National avg: 2h 20m per day
Weekend Total Nursing Info Combined nursing hours (RN + LPN + Nurse Aide) per resident per day on weekends. Staffing often drops on weekends — this figure reveals whether the facility maintains adequate coverage outside of weekday hours. 3h 53m per day ▲ 19% State avg: 3h 16m per day · National avg: 3h 26m per day
Physical Therapist Info Hours per resident per day provided by licensed Physical Therapists (PTs) or PT Assistants. PT services help residents recover mobility after injury or illness and are especially important for post-acute (short-stay) rehabilitation. 14m per day ▲ 180% State avg: 5m per day · National avg: 4m per day
Weekend RN Info Registered nurse hours specifically on weekends. Facilities sometimes reduce RN presence on Saturdays and Sundays — a low weekend RN figure compared to weekday hours can indicate reduced clinical oversight when most administrative staff are absent. 29m per day ▼ 19% State avg: 36m per day · National avg: 28m per day

Capacity and availability

This home usually has limited availability

Occupancy between 85% and 95% suggests balanced demand.

Higher occupancy than the Colorado average: 76.5%
Occupancy rate 92.9% Rank #17 / 185Occupancy rate — State benchmarkedThis home is ranked 17th out of 185 homes in Colorado. Shows this facility's occupancy rate versus the Colorado average, with its Statewide rank out of 185. Higher occupancy signals strong local demand and financial stability.Click the rank badge to see the full State ranking.Click here to see the full State ranking.
Avg. Length of Stay 27 days
Occupancy rate
92.9% Rank #17 / 185Occupancy rate — State benchmarkedThis home is ranked 17th out of 185 homes in Colorado. Shows this facility's occupancy rate versus the Colorado average, with its Statewide rank out of 185. Higher occupancy signals strong local demand and financial stability.Click the rank badge to see the full State ranking.Click here to see the full State ranking.
Avg. Length of Stay
27 days
Bed community size
32-bed community Rank #418 / 542Bed count — State benchmarkedThis home is ranked 418th out of 542 homes in Colorado. Shows this facility's certified or reported bed count compared to other Colorado SNFs. Larger communities may offer more amenities, programs, and on-site services for residents and families.Click the rank badge to see the full State ranking.Click here to see the full State ranking.
A moderately sized community that may balance personal attention with shared amenities and social activities.
Years in operation
10 years in operation Rank #28 / 31Years in operation — State benchmarkedThis home is ranked 28th out of 31 homes in Colorado. Shows how long this facility has been in operation compared to other Colorado SNFs. Longer operating histories may benefit residents, families, and staff.Click the rank badge to see the full State ranking.Click here to see the full State ranking.
A community with a solid operating history and experience delivering ongoing care.
Walk Score
Walk Score: 5 / 100 Rank #827 / 875Walk Score — State benchmarkedThis home is ranked 827th out of 875 homes in Colorado. Shows how walkable this facility's neighborhood is compared to the average Walk Score across Colorado SNFs. Higher scores benefit residents, families, and staff.Click the rank badge to see the full State ranking.Click here to see the full State ranking.
Car-dependent. Most errands require a car, with limited nearby walkable options.
BBB Rating
BBB Rating: A+ (Not Accredited)
An independent rating from the Better Business Bureau based on factors such as complaint history, transparency, and business practices.
How BBB ratings work

About this community

License Details

Facility TypeAssisted Living Residence (licensed Only)
StatusActive
CMS Certification Number065417

Ownership & Operating Entity

The Healthcare Resort of Colorado Springs is administrated by Shem Wanlass.

Owner NamePikes Peak Healthcare Inc

Therapy & Rehabilitation

1 service
Rehabilitation Services

Amenities & Lifestyle

Outdoor Courtyard With Fire Pit
Full Service Salon
Fully Equipped Health And Wellness Gyms
Social And Recreational Activities
Housekeeping And Personalized Laundry Services
Specific ProgramsSenior Living, Concierge-style Service

Contact The Healthcare Resort of Colorado Springs

Inspection History

In Colorado, the Department of Public Health and Environment, Health Facilities Division is the regulatory body that performs unannounced surveys and publishes facility inspection findings.

Read the full inspection reports for this facility, including detailed findings and corrective actions.

Show Inspection Reports

Health Inspection History

Inspections since 2022
Total health inspections 3

Colorado average 4.8


Last Health inspection on Jun 2025

Total health citations
21 Rank #77 / 182Health citations — State benchmarkedThis home is ranked 77th out of 182 homes in Colorado. Shows this facility's total health deficiency citations benchmarked to the Colorado State average, with a ranking across all 182 CO SNFs. Lower citation counts earn a better rank.Click the rank badge to see the full State ranking.Click here to see the full State ranking.

Colorado average 24.8

Citations per inspection
7 Rank #146 / 182Citations per inspection — State benchmarkedThis home is ranked 146th out of 182 homes in Colorado. Shows average deficiency citations per CMS inspection for this facility versus the Colorado mean across 182 SNFs with citation data. Lower is better.Click the rank badge to see the full State ranking.Click here to see the full State ranking.

Colorado average 5.2


Health citations are formal notices following inspections when they fail to comply with safety and care standards.

19 of 21 citations resulted from standard inspections; and 2 of 21 came from combined inspections (standard and complaint).

Breakdown of citation severity (last 4 years)
Critical Health citations
1
150% worse than Colorado average

Colorado average: 0.4


Serious Health citations
0
100% better than Colorado average

Colorado average: 2.1

1 critical citation Colorado average: 0.4

0 serious citations Colorado average: 2.1

19 moderate citations Colorado average: 22.2

1 minor citation Colorado average: 0.2
Citations history (last 4 years)
Administration moderate citation Jun 26, 2025
Corrected

Administration moderate citation Jun 26, 2025
Corrected

Nutrition moderate citation Jun 26, 2025
Corrected

Pharmacy moderate citation Jun 26, 2025
Corrected

Staffing Data

Reporting period: October 1 – December 31, 2025 (Q4 2025). Source: CMS Payroll-Based Journal report.

Total staff 209
Employees 183
Contractors 26
Staff to resident ratio 2.49:1
32% better than Colorado average
Colorado average ratio: 1.88:1 Colorado average ratio: 1.88:1See full Colorado ranking
Avg staff/day 65
Average shift 8.5 hours
0% compared with Colorado average
Colorado average: 8.3 hours Colorado average shift: 8.3 hoursSee full Colorado ranking
Total staff hours (quarter) 50,540

Nursing staff breakdown

Q4 2025 · Oct 1 – Dec 31 More info This data comes from the CMS Payroll-Based Journal report covering October 1 – December 31, 2025.
Registered Nurse

Manages medical care and health needs.

RN Staff 19
Average shift length Info Average shift length. Calculated as total hours divided by days worked and average staff per day. 9.7 hours

No contractors work on this role.

Licensed Practical Nurse

Assists with medical care and medications.

LPN Staff 25
Average shift length Info Average shift length. Calculated as total hours divided by days worked and average staff per day. 9.3 hours

This role is partially covered by contractors.

Certified Nursing Assistant

Helps with daily care and mobility.

CNA Staff 92
Average shift length Info Average shift length. Calculated as total hours divided by days worked and average staff per day. 8.8 hours

This role is partially covered by contractors.

Contractor staffing

Q4 2025 · Oct 1 – Dec 31 More info This data comes from the CMS Payroll-Based Journal report covering October 1 – December 31, 2025.

Total hours from contractors

0.7%

367 contractor hours this quarter

Certified Nursing Assistant: 22 Licensed Practical Nurse: 3 Medical Director: 1

Staff by category

Q4 2025 · Oct 1 – Dec 31 More info This data comes from the CMS Payroll-Based Journal report covering October 1 – December 31, 2025.
Certified Nursing Assistant70229219,32792100%8.8
Licensed Practical Nurse223256,36592100%9.3
Registered Nurse190195,26292100%9.7
Dental Services Staff6062,5268997%7.7
Physical Therapy Assistant9092,5198896%7.3
Medication Aide/Technician6062,4729199%8.8
Respiratory Therapy Technician7072,3119098%7.1
Clinical Nurse Specialist110111,8566672%8.6
Speech Language Pathologist110111,6239199%6.4
Physical Therapy Aide8081,5849098%6.8
Qualified Social Worker4049276571%7.7
Occupational Therapy Aide2026046672%7.8
RN Director of Nursing1015946672%9
Nurse Practitioner1015766470%9
Administrator2025206571%8
Dietitian1015076773%7.6
Therapeutic Recreation Specialist1014826065%8
Other Dietary Services Staff1014436368%7
Medical Director011301213%2.5
Occupational Therapy Assistant1011233%3.8
92 Certified Nursing Assistant
% of Days 100%
25 Licensed Practical Nurse
% of Days 100%
19 Registered Nurse
% of Days 100%
6 Dental Services Staff
% of Days 97%
9 Physical Therapy Assistant
% of Days 96%
6 Medication Aide/Technician
% of Days 99%
7 Respiratory Therapy Technician
% of Days 98%
11 Clinical Nurse Specialist
% of Days 72%
11 Speech Language Pathologist
% of Days 99%
8 Physical Therapy Aide
% of Days 98%
4 Qualified Social Worker
% of Days 71%
2 Occupational Therapy Aide
% of Days 72%
1 RN Director of Nursing
% of Days 72%
1 Nurse Practitioner
% of Days 70%
2 Administrator
% of Days 71%
1 Dietitian
% of Days 73%
1 Therapeutic Recreation Specialist
% of Days 65%
1 Other Dietary Services Staff
% of Days 68%
1 Medical Director
% of Days 13%
1 Occupational Therapy Assistant
% of Days 3%

Penalties and fines

Includes penalties issued in 2023

Federal penalties imposed by CMS for regulatory violations, including civil money penalties (fines) and denials of payment for new Medicare/Medicaid admissions.

Source: CMS Penalties Database (Data as of Jan 2026)

Total fines amount $79K Rank #165 / 182Federal fines — State benchmarkedThis home is ranked 165th out of 182 homes in Colorado. Shows this facility's cumulative CMS federal fine dollars versus the Colorado average among facilities with fines, and where it ranks among 182 skilled nursing facilities in the pool. Lower total dollars mean a better rank.Click the rank badge to see the full State ranking.Click here to see the full State ranking.
100% higher than Colorado average

Colorado average: $40K

Number of fines 1
55% fewer fines than Colorado average

Colorado average: 2.2

Payment Denials Info Serious action where Medicare and/or Medicaid temporarily stops payments for new residents until issues are fixed. 0
100% fewer payment denials than Colorado average

Colorado average: 0.3

Fines amount comparison
This facility $79K
Colorado average $40K
Penalty History

Penalties are imposed by CMS for violations of federal nursing home regulations.

1 penalty in the past 3 years

Nov 8, 2023 · $79K

Civil Money Penalty Info Fines imposed for noncompliance, which can be assessed per day or per instance of violation. Nov 8, 2023
$79K

Last updated: Jan 2026

Quality of care over time

These measures show how residents usually do over time at this home, based on health outcomes and preventive care.

High-risk clinical events score Info A composite score based on pressure ulcers, falls with injury, weight loss, walking ability decline, and activities of daily living decline. 3.9
56% better than Colorado average

Colorado average: 9.0

Functional decline score Info A composite score based on activities of daily living decline, walking ability decline, and incontinence. 9.9
47% better than Colorado average

Colorado average: 18.8

Long-stay resident measures
Significantly above average Colorado avg: 3.9 Info CMS star rating based on long-stay quality measure performance. 5 stars = significantly above average, 1 star = significantly below average.
Need for Help with Daily Activities Increased Info Percent of long-stay residents whose need for help with daily activities has increased 2.8%
82% better than Colorado average

Colorado average: 16.0%

Walking Ability Worsened Info Percent of long-stay residents whose ability to move independently worsened 7.3%
57% better than Colorado average

Colorado average: 17.0%

Low Risk Residents with Bowel/Bladder Incontinence Info Percent of low risk long-stay residents who lose control of their bowels or bladder 19.6%
16% better than Colorado average

Colorado average: 23.2%

Falls with Major Injury Info Percent of long-stay residents experiencing one or more falls with major injury 0.0%
100% better than Colorado average

Colorado average: 3.3%

High Risk Residents with Pressure Ulcers Info Percent of long-stay high risk residents with pressure ulcers 1.4%
64% better than Colorado average

Colorado average: 3.9%

Urinary Tract Infection Info Percent of long-stay residents with a urinary tract infection 1.3%
10% better than Colorado average

Colorado average: 1.4%

Lost Too Much Weight Info Percent of long-stay residents who lose too much weight 8.1%
56% worse than Colorado average

Colorado average: 5.2%

Depressive Symptoms Info Percent of long-stay residents who have depressive symptoms 17.1%
139% worse than Colorado average

Colorado average: 7.2%

Antipsychotic Use Info Percent of long-stay residents who received an antipsychotic medication 21.5%
15% worse than Colorado average

Colorado average: 18.8%

Pneumococcal Vaccine Info Percent of long-stay residents assessed and appropriately given the pneumococcal vaccine 100.0%
7% better than Colorado average

Colorado average: 93.3%

Influenza Vaccine Info Percent of long-stay residents assessed and appropriately given the seasonal influenza vaccine 68.2%
28% worse than Colorado average

Colorado average: 94.7%

Short-stay resident measures
Above average Colorado avg: 2.7 Info CMS star rating based on short-stay quality measure performance. 5 stars = much above average, 1 star = much below average.
Pneumococcal Vaccine Info Percent of short-stay residents assessed and appropriately given the pneumococcal vaccine 90.7%
18% better than Colorado average

Colorado average: 76.6%

Antipsychotic medication increase Info Percent of short-stay residents who newly received an antipsychotic medication 0.7%
54% better than Colorado average

Colorado average: 1.4%

Influenza Vaccine Info Percent of short-stay residents assessed and appropriately given the seasonal influenza vaccine 75.7%
In line with Colorado average

Colorado average: 75.6%

Re-hospitalized after SNF stay Info Percentage of short-stay residents who were re-hospitalized after their nursing home admission. 25.0%
23% worse than Colorado average

Colorado average: 20.3%

Emergency department visits Info Percentage of short-stay residents who had an outpatient emergency department visit. 17.0%
33% worse than Colorado average

Colorado average: 12.8%

Falls with major injury Info Percentage of SNF residents who experience falls with major injury during their stay. 0.0%
100% better than Colorado average

Colorado average: 0.8%

Ability to care for self at discharge Info Percentage of residents at or above expected ability to care for themselves at discharge. 62.9%
17% better than Colorado average

Colorado average: 53.7%

Successful return to home or community Info Rate of successful return to home or community from a skilled nursing facility. 62.7%
24% better than Colorado average

Colorado average: 50.6%

Breakdown by payment type

Medicare

37% of new residents, usually for short-term rehab.

Typical stay 27 days

Private pay

62% of new residents, often for short stays.

Typical stay 1 months

Facility Characteristics

Source: CMS Long-Term Care Facility Characteristics (Data as of Jan 2026)

Total residents 84
Medicare
15
17.9% of residents
Private pay or other
69
82.1% of residents
Programs & Services
Residents Group

Residents meet regularly to discuss policies, care quality, and activities

CCRC

Part of a Continuing Care Retirement Community offering multiple care levels

Active Resident Council

Organized group of residents that meets regularly to discuss facility policies, quality of life, and activities.

Finances and operations

Privately-owned community
Operated by a business corporation.
Home revenue
$20.5M
Profit
$1.3M
Privately-owned community Operated by a business corporation.
Home revenue
$20.5M Rank #27 / 182Revenue — State benchmarkedThis home is ranked 27th out of 182 homes in Colorado. Shows this facility's annual revenue compared to the Colorado SNF average. Higher revenue generally means more resources for staffing and capital — read alongside Payroll %.Click the rank badge to see the full State ranking.Click here to see the full State ranking.
Profit
$1.3M
Payroll costs Info The portion of the home's budget spent on staff, including nurses, caregivers, and other employees who support care and operations. Rank #17 / 182Payroll — State benchmarkedThis home is ranked 17th out of 182 homes in Colorado. Shows total annual staff payroll benchmarked to the Colorado average. Higher payroll investment relative to peers often signals better staffing and less reliance on cheaper contract labor.Click the rank badge to see the full State ranking.Click here to see the full State ranking.
$11.1M
54.1% of revenue Rank #93 / 182Payroll % — State benchmarkedThis home is ranked 93rd out of 182 homes in Colorado. Shows payroll as a percentage of revenue versus the Colorado average. Well-run Colorado SNFs typically land around 59–66% — the top third Statewide. Below 25% may signal understaffing or heavy agency use — read with Staffing ratings.Click the rank badge to see the full State ranking.Click here to see the full State ranking.
Other operating costs Info All remaining costs needed to run the home, such as food, utilities, building maintenance, supplies and administrative expenses.
$8.2M
Total costs $19.3M

Who this home usually serves

TYPE OF STAY

Primarily short stays

Residents typically stay for brief periods, with frequent admissions and discharges throughout the year.

Places of interest near The Healthcare Resort of Colorado Springs

Address 3.5 miles from city center Info Estimated distance in miles from Colorado Springs's city center to The Healthcare Resort of Colorado Springs's address, calculated via Google Maps.

Calculate Travel Distance to The Healthcare Resort of Colorado Springs

Add your location

Address

Financial Assistance for
Nursing Home in Colorado

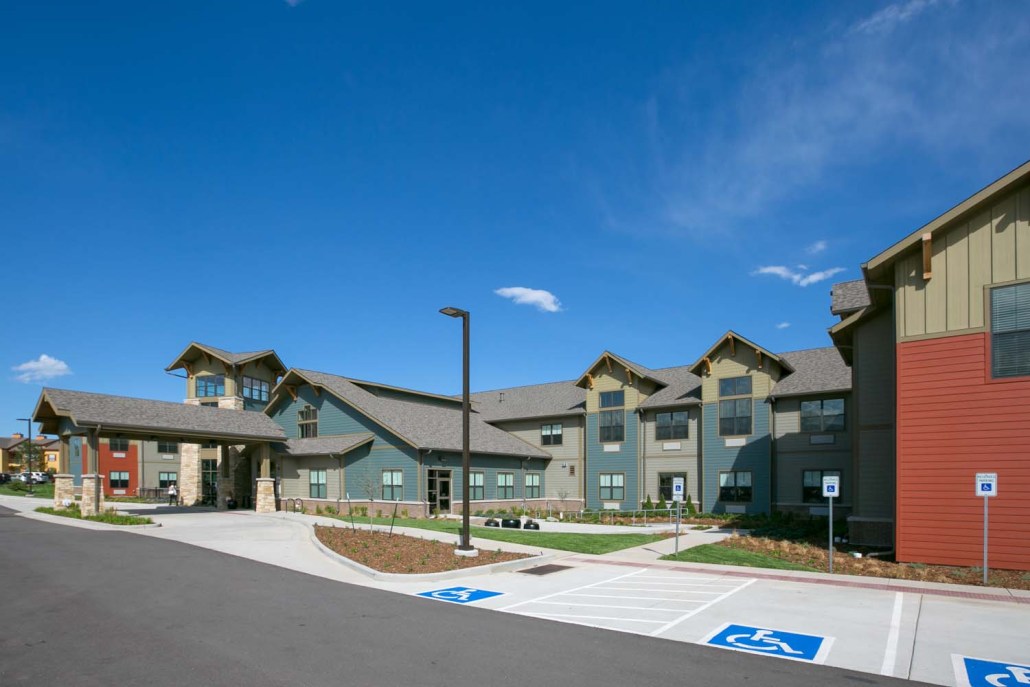
The Healthcare Resort of Colorado Springs is located in COLORADO SPRINGS, Colorado.
Here are the financial assistance programs available to residents in Colorado.

Get Financial aid guidance

Elderly, Blind, and Disabled Waiver

Colorado Medicaid EBD Waiver

Age 65+ or disabled
General Colorado resident, Medicaid- eligible, nursing home-level care need.
Income Limits (2025) ~$2,829/month 300% FBR, individual
Asset Limits $2,000 (individual), $3,000 (couple).
CO

Requires level-of-care assessment by case manager.

Benefits
Personal care (5-7 hours/day) Respite care (up to 240 hours/year) Adult day care ($65/day) Home modifications ($1,500 avg.)

Old Age Pension (OAP) Health Care Program

Colorado OAP

Age 60+
General Colorado resident.
Income Limits ~$1,215/month individual
Asset Limits $2,000 individual
CO

Supplements SSI; limited medical coverage.

Benefits
Cash (~$100-$800/month) Limited in-home care (2-3 hours/week) Medical assistance

Program of All-Inclusive Care for the Elderly (PACE)

Colorado Medicaid PACE

Age 55+
General Colorado resident, nursing home-level care need, safe with PACE support.
Income Limits (2025) ~$2,829/month 300% FBR
Asset Limits $2,000 (individual), $3,000 (couple).
CO

Limited to specific regions (e.g., Denver, Pueblo).

Benefits
All-inclusive care—personal care (5-7 hours/day) Meals Transportation Therapy Medical visits

Home Care Allowance (HCA)

Colorado Home Care Allowance (HCA)

Age
General Seniors typically 65+, Age 5+ with disability, Colorado resident, financial/functional need.
Income Limits (2025) ~$1,004/month individual, stricter than waivers
Asset Limits $2,000 (individual), $3,000 (couple).
CO

Must need help with ADLs; not Medicaid-waiver eligible.

Benefits
Personal care (~4-6 hours/day, paid to provider) E.g. Bathing Dressing

Frequently Asked Questions about The Healthcare Resort of Colorado Springs

What neighborhood is The Healthcare Resort of Colorado Springs in?

The Healthcare Resort of Colorado Springs is in the West Colorado Springs neighborhood of COLORADO SPRINGS.

Who is the owner of The Healthcare Resort of Colorado Springs?

The legal owner and operator of The Healthcare Resort of Colorado Springs is Pikes Peak Healthcare Inc.

Is The Healthcare Resort of Colorado Springs in a walkable area?

The Healthcare Resort of Colorado Springs has a walk score of 5. Car-dependent. Most errands require a car, with limited nearby walkable options.

Who is the administrator of The Healthcare Resort of Colorado Springs?

Shem Wanlass is the administrator of The Healthcare Resort of Colorado Springs.

How many beds does The Healthcare Resort of Colorado Springs have?

The Healthcare Resort of Colorado Springs has 32 beds.

Are there photos of The Healthcare Resort of Colorado Springs?

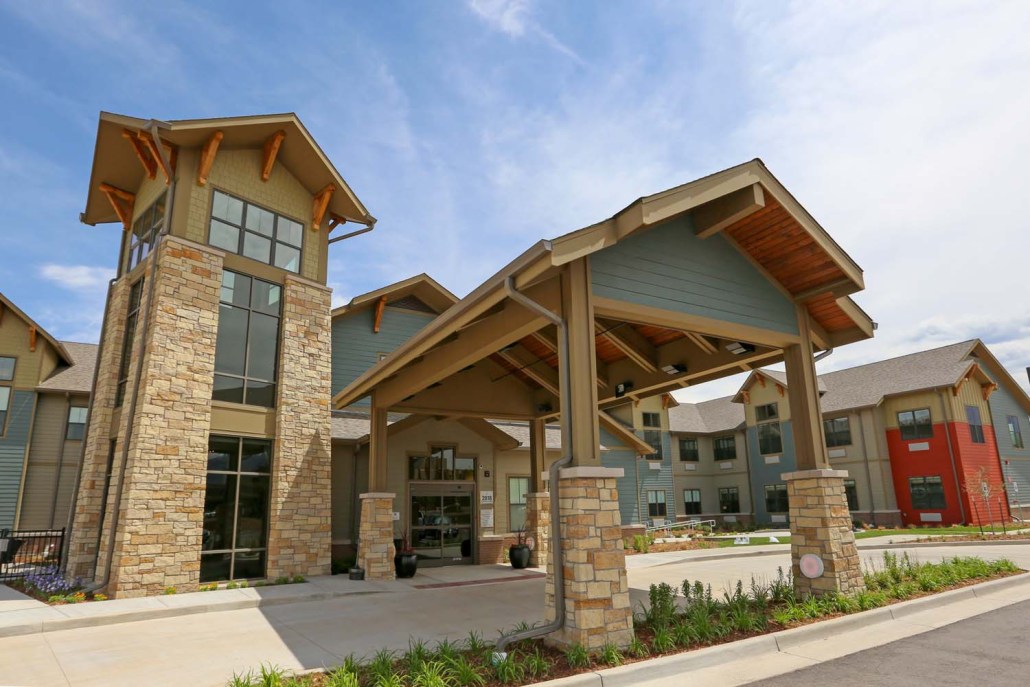
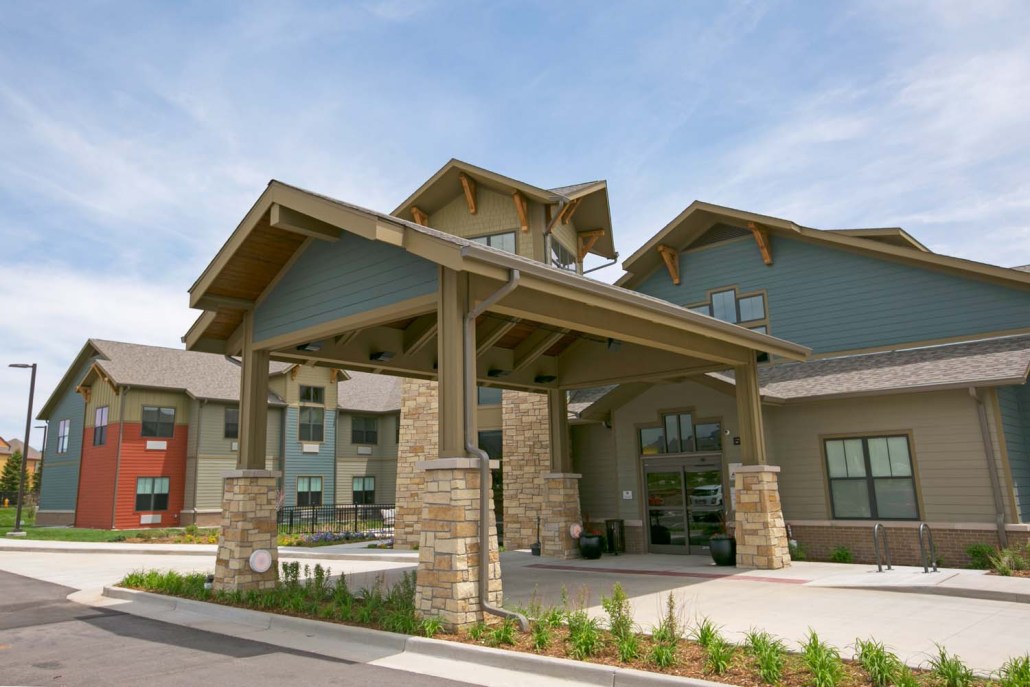
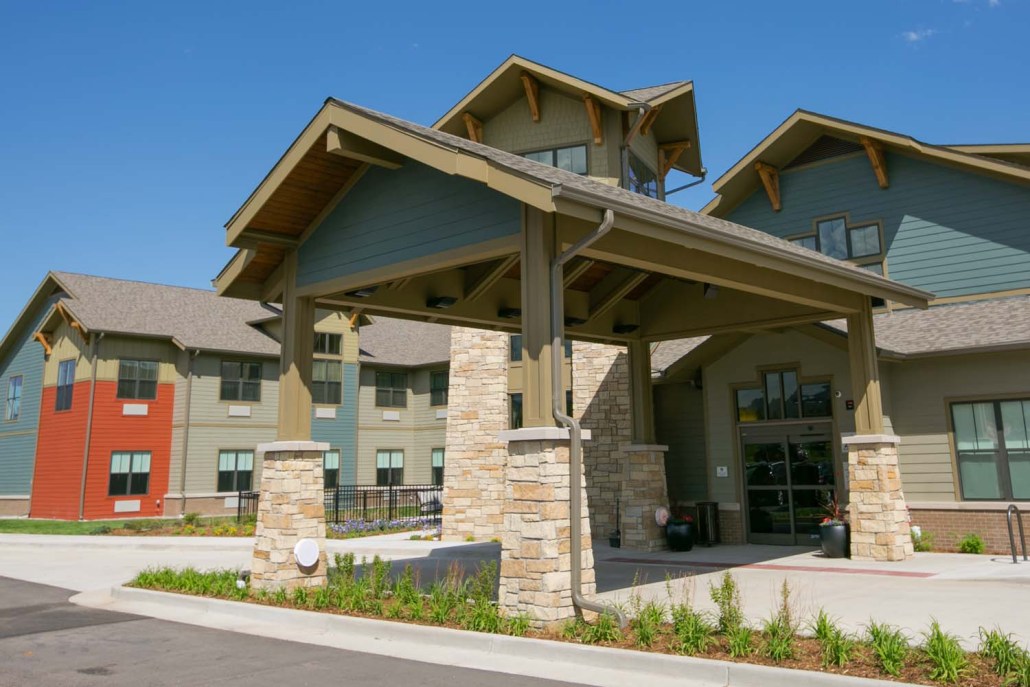
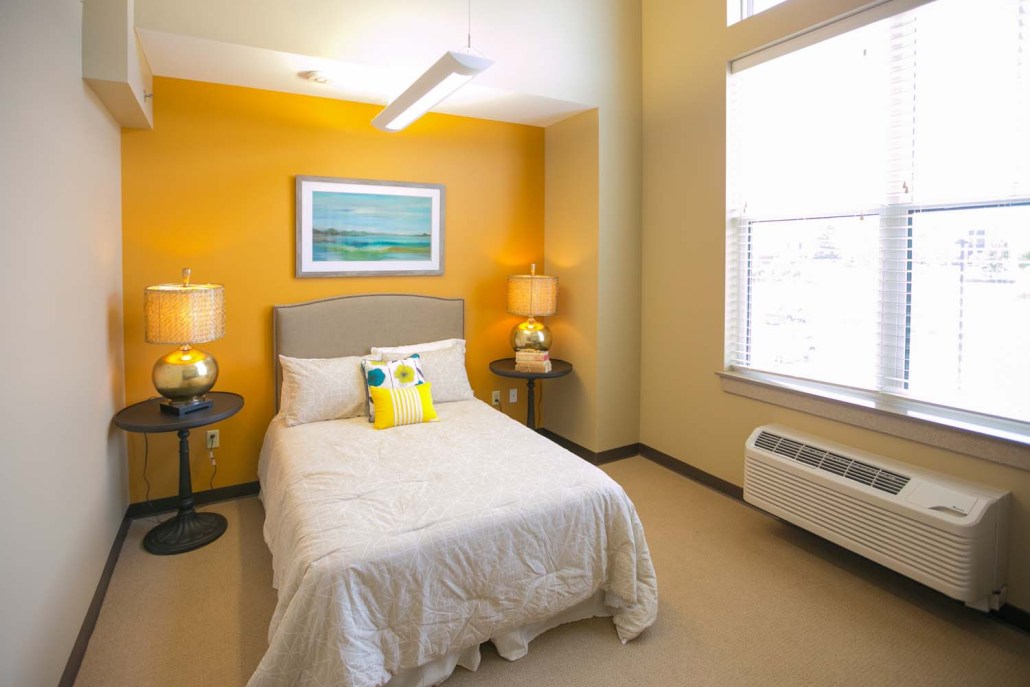
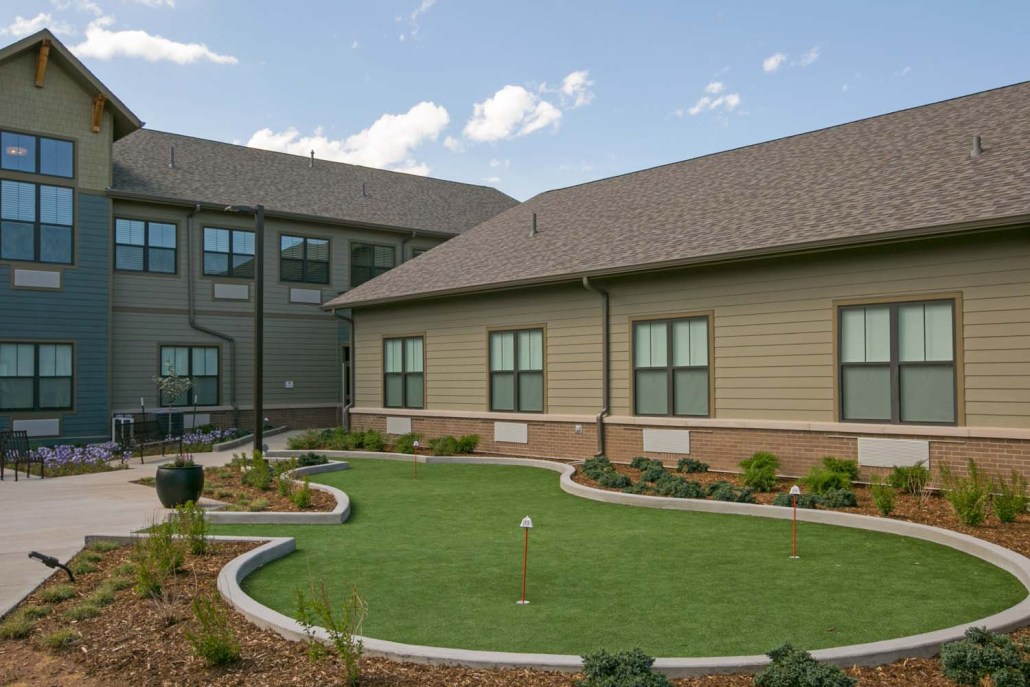
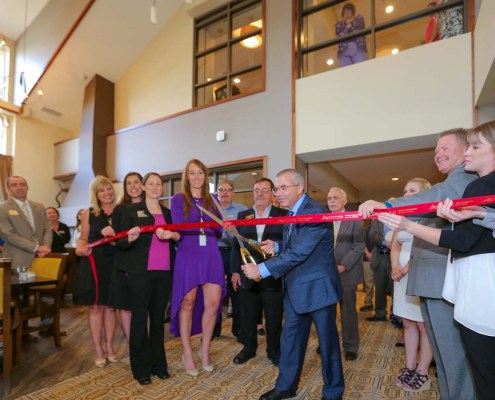
Yes — there are 10 photos of The Healthcare Resort of Colorado Springs in the photo gallery on this page.

What is the address of The Healthcare Resort of Colorado Springs?

The Healthcare Resort of Colorado Springs is located at 2818 GRAND VISTA CIR.

Guides for Better Senior Living

Care Cost Calculator: See Prices in Your Area

Nursing Home Data Explorer

Don’t Wait Too Long: 7 Red Flag Signs Your Parent Needs Assisted Living Now

The True Cost of Assisted Living in 2025 – And How Families Are Paying For It

Understanding Senior Living Costs: Pricing Models, Discounts & Financial Assistance

Explore Open Rooms
1 Contact details
2 What type of senior care service are you looking for?
3 What budget do you have in mind for senior care?
4 How soon do you need to find care?
5 Additional details

Thank you for your interest!

Our team will be in touch shortly to help with next steps.