Heartland Rehabilitation and Care Center
Nursing Home & Respite Care · Benton, AR
CMS overall rating Info CMS (the Centers for Medicare & Medicaid Services) is the federal agency that rates nursing home quality. Its Overall Rating runs from 1 to 5 stars, combining health inspections, staffing, and quality measures, with inspections weighted most heavily.

Heartland Rehabilitation and Care Center

Nursing Home & Respite Care · Benton, AR
CMS overall rating Info CMS (the Centers for Medicare & Medicaid Services) is the federal agency that rates nursing home quality. Its Overall Rating runs from 1 to 5 stars, combining health inspections, staffing, and quality measures, with inspections weighted most heavily.
Calculator: See prices in your area
Heartland Rehabilitation and Care Center accepts Medicaid, Medicare, and private pay.

Overview of Heartland Rehabilitation and Care Center

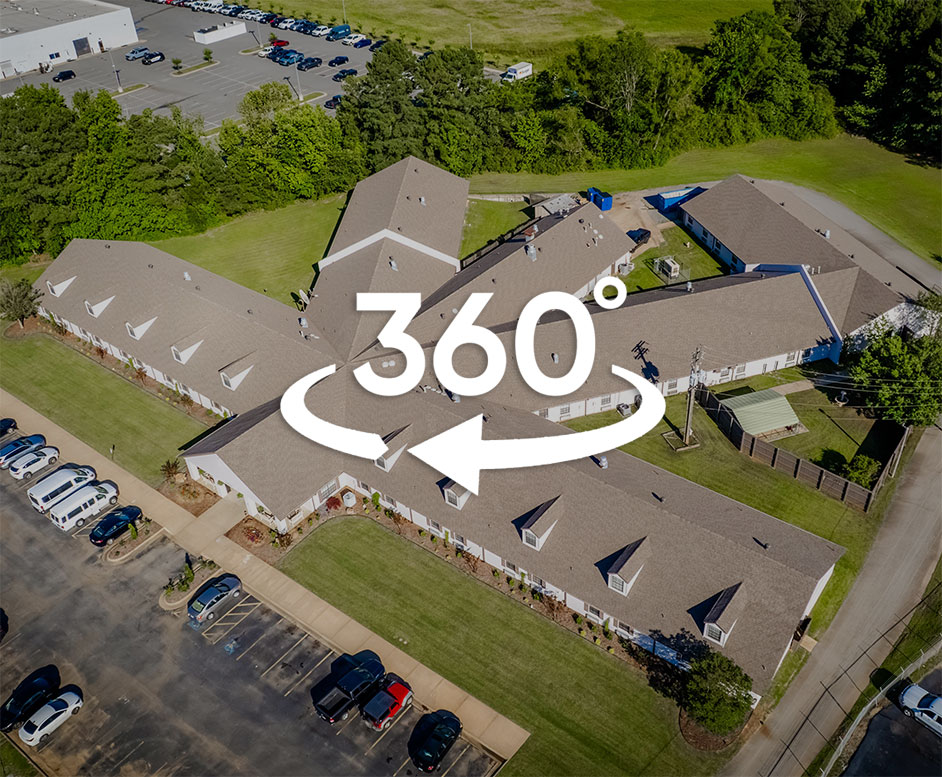
Serving Benton, Arkansas, for 21 years, Heartland Rehabilitation and Care Center is a skilled nursing home operated by Saline SNF Operations, LLC under owner John Strother and administered by Michael Tindell. The facility accepts Medicare, Medicaid, and private pay.

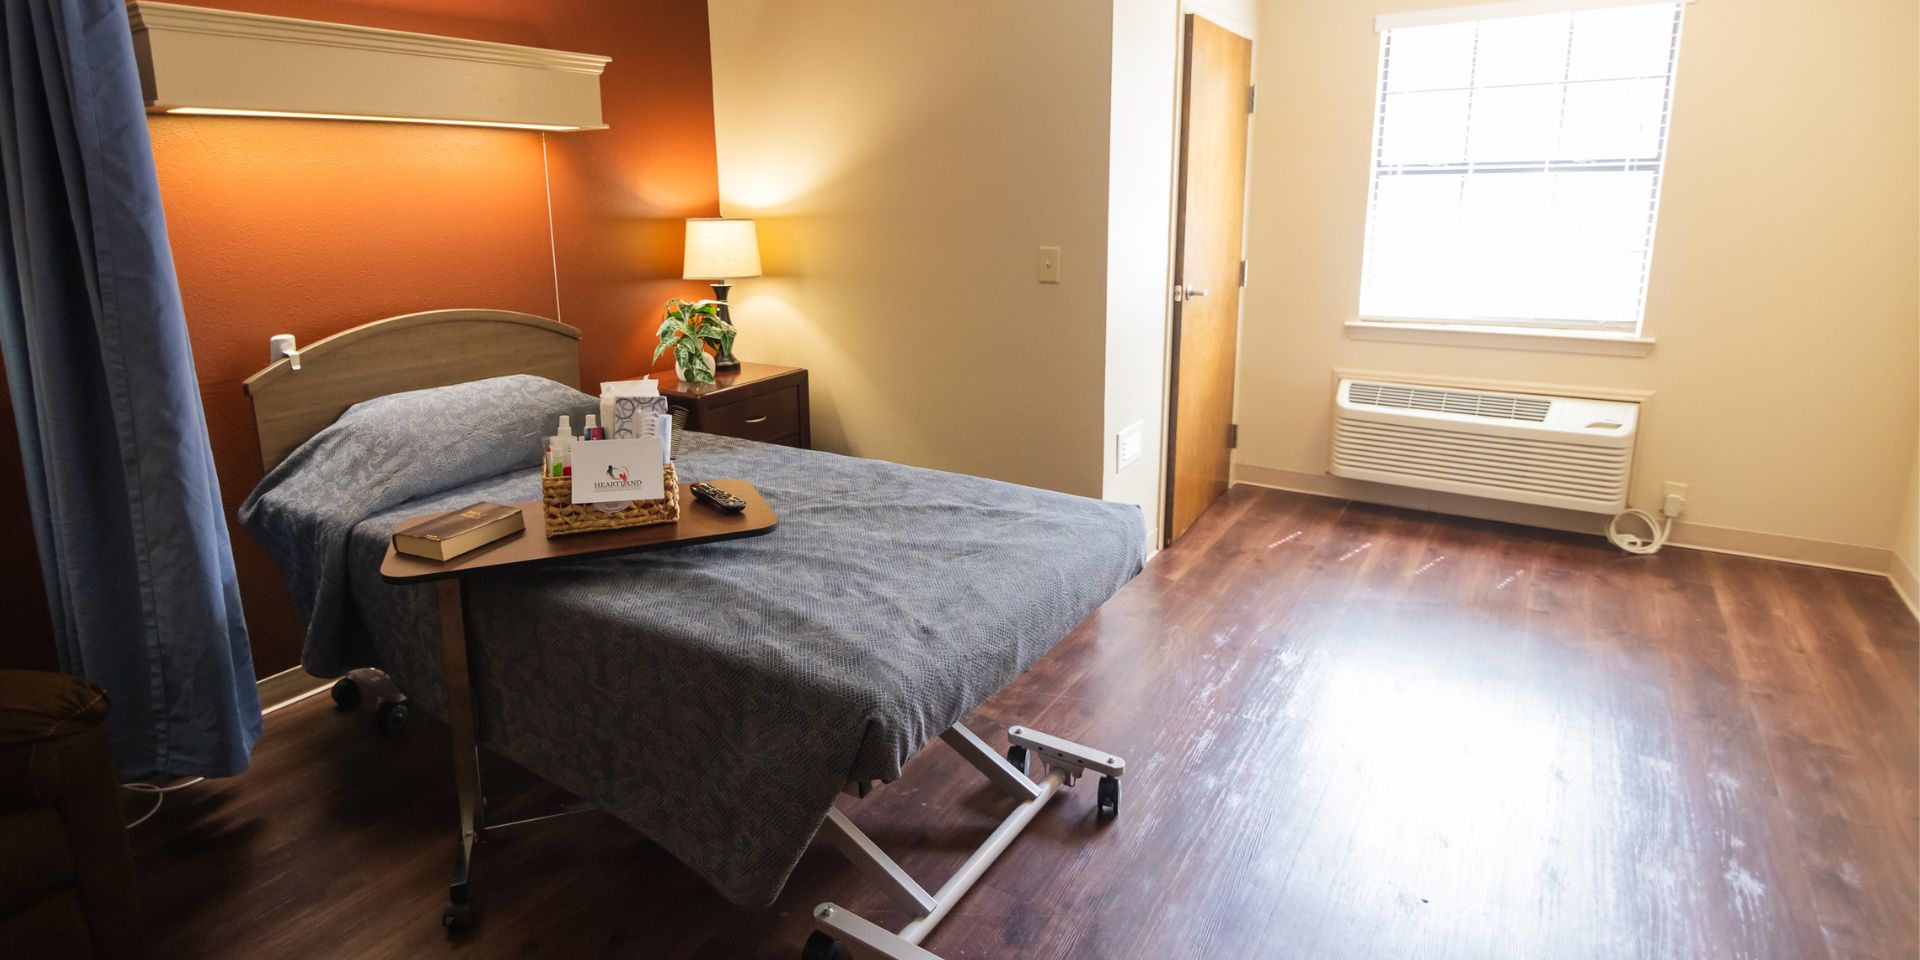
The home has 119 beds, with 61% occupancy. Residents stay an average of 138 days. The resident population includes people receiving post-acute rehabilitation as well as those needing longer-term nursing care.

Short-term rehab, rehabilitation services, and respite care are available. The facility has a doctor on staff and provides 24-hour nursing support. An Enhanced Care Unit serves residents with specialized needs. Residents receive an average of 4 hours and 34 minutes of nursing care each day, with registered nurses providing 1 hour and 22 minutes, nurse aides contributing 2 hours and 51 minutes, and licensed practical nurses providing 17 minutes of care.

The facility is located along Interstate 30 in Benton. The neighborhood’s Walk Score is 0, so the area is car-dependent. Most daily errands require a vehicle. Visiting family members should drive.

State inspections have produced mixed findings over time. One inspection found no health deficiencies and no substantiated complaints. A later inspection identified concerns involving facility operations and resident care procedures, including maintenance, transfer practices, food storage, and care coordination. A more recent inspection identified a single issue involving food safety staff practices during meal preparation. The facility responded to those findings and continues addressing operational standards.

Quality ratings

Measured by Centers for Medicare & Medicaid Services (CMS)

Overall rating Info The Overall CMS Rating combines results from health inspections, staffing levels and quality measures. Health inspections carry the most weight. Staffing and quality scores can increase or decrease the final rating based on performance compared to state and national standards.
Health Inspection Info Based on the results of the facility's three most recent standard inspections and any complaint investigations. CMS reviews the number, scope, and severity of deficiencies, with more recent findings weighted more heavily.
Staffing Info Measures average nursing staff hours per resident per day, including Registered Nurses (RNs) and total nursing staff. Ratings are adjusted based on the level of care residents require and are compared to state and national benchmarks.
Quality Measures Info Based on clinical and physical health indicators reported to CMS, such as hospital readmissions, falls, pressure ulcers, and improvements in mobility. These measures reflect how well residents' health needs are being managed.

Staffing hours breakdown

Info Daily nursing hours per resident by staff type, reported to CMS. Higher is generally better — compare this facility to state and national averages to see where staffing stands.

Hours per resident per day — compared to state averages

Total nursing care / resident Info Total adjusted nursing hours per resident per day, combining RN, LPN, and aide time. CMS adjusts this for case-mix so facilities can be fairly compared.
4h 34m per day
vs avg

2 of 6 metrics below state avg

Standout metric Registered Nurse (RN) is +243% above state avg
Staff typeHours / Day / Residentvs state avg
Registered Nurse (RN) Info RNs hold the highest nursing license and can assess residents, interpret test results, and direct care plans. More RN hours per day often signals stronger clinical oversight and faster response to health changes. 1h 22m per day ▲ 243% State avg: 24m per day · National avg: 41m per day
LPN / LVN Info Licensed Practical Nurses (LPNs) or Licensed Vocational Nurses (LVNs) deliver routine hands-on care — medication administration, wound dressing, and monitoring vital signs. They work under RN supervision and make up a large share of daily bedside care. 17m per day ▼ 70% State avg: 57m per day · National avg: 52m per day
Nurse Aide Info Certified Nurse Aides (CNAs) provide the most direct day-to-day assistance: bathing, dressing, feeding, and mobility. Nurse aide hours are typically the largest staffing category and directly affect residents' quality of life. 2h 51m per day ▲ 5% State avg: 2h 43m per day · National avg: 2h 20m per day
Weekend Total Nursing Info Combined nursing hours (RN + LPN + Nurse Aide) per resident per day on weekends. Staffing often drops on weekends — this figure reveals whether the facility maintains adequate coverage outside of weekday hours. 3h 40m per day ▲ 5% State avg: 3h 29m per day · National avg: 3h 26m per day
Physical Therapist Info Hours per resident per day provided by licensed Physical Therapists (PTs) or PT Assistants. PT services help residents recover mobility after injury or illness and are especially important for post-acute (short-stay) rehabilitation. 0m per day ▼ 100% State avg: 2m per day · National avg: 4m per day
Weekend RN Info Registered nurse hours specifically on weekends. Facilities sometimes reduce RN presence on Saturdays and Sundays — a low weekend RN figure compared to weekday hours can indicate reduced clinical oversight when most administrative staff are absent. 52m per day ▲ 224% State avg: 16m per day · National avg: 28m per day

Capacity and availability

Avg. Length of Stay
138 days
Bed community size
119-bed community Rank #73 / 330Bed count — State benchmarkedThis home is ranked 73rd out of 330 homes in Arkansas. Shows this facility's certified or reported bed count compared to other Arkansas facilities. Larger communities may offer more amenities, programs, and on-site services for residents and families.Rankings are based only on facilities in Arkansas that report data for that category. Facilities without available data are excluded from the ranking.Click the rank badge to see the full State ranking.Click here to see the full State ranking.
A larger shared setting that may offer more common spaces and organized community services.
Years in operation
21 years in operation
A longer operating history, which may indicate experience navigating regulations and delivering ongoing care.
Walk Score
Walk Score: 0 / 100 Rank #405 / 419Walk Score — State benchmarkedThis home is ranked 405th out of 419 homes in Arkansas. Shows how walkable this facility's neighborhood is compared to the average Walk Score across Arkansas facilities. Higher scores benefit residents, families, and staff.Rankings are based only on facilities in Arkansas that report data for that category. Facilities without available data are excluded from the ranking.Click the rank badge to see the full State ranking.Click here to see the full State ranking.
Car-dependent. Most errands require a car, with limited nearby walkable options.
BBB Rating
BBB Rating: A+ (Not Accredited)
An independent rating from the Better Business Bureau based on factors such as complaint history, transparency, and business practices.
How BBB ratings work

About this community

Occupancy

Occupancy rate
61%
Lower than the Arkansas average: 71.3%
Occupied beds
72 / 119
Average occupied beds in Arkansas homes 77 beds

License Details

Facility TypeSkilled Nursing Facility With Dual Certified Beds (medicaid / Medicare)
CountySaline
CMS Certification Number045199
Certification TypeMedicaid / Medicare

Ownership & Operating Entity

Heartland Rehabilitation and Care Center is legally operated by Saline SNF Operations, LLC, and administered by Michael Tindell.

Owner NameSaline Snf Operations, LLC
Profit StatusGovernment

Type Of Units

Medicaid and Medicare
119 units
Total beds
119 units

Staffing

Key information about the people who lead and staff this community.

Leadership

ContactMrs. Sherri Newton, Administrator

Payment & Insurance

1 service
Accept Medicaid

Therapy & Rehabilitation

3 services
Rehabilitation Services
Respite Care
Short-Term Rehab

Staffing & Medical

2 services
Doctor on Staff
24-Hour Staffing

Contact Information

Fax501-778-9652

Amenities & Lifestyle

Specific ProgramsEnhanced Care Unit

Contact Heartland Rehabilitation and Care Center

Inspection History

In Arkansas, the Department of Human Services, Office of Long Term Care is authorized to conduct unannounced inspections and issue official quality of care reports for all senior living providers.

Since 2023 · 3 years of data 11 deficiencies

Inspection Scorecard Info This scorecard compares key inspection, deficiency, and complaint metrics at this facility against the Arkansas state average. Metrics rated ≥15% worse than average are highlighted in red; those ≥15% better are highlighted in green.

Since 2023 vs. Arkansas state average
Overall vs. AR average 0 Worse No metrics in this bucket. 2 Better Metrics better than Arkansas average:
• Total deficiencies (48% below)
• Deficiencies per year (47% below)
Latest Inspection July 31, 2025 Routine

Deficiencies Info Deficiencies are formal regulatory issues recorded during state inspections.

This FacilityAR Averagevs. AR Avg
Total deficiencies Info Formal regulatory issues recorded by inspectors across all inspection types. 1121 This facility has 48% fewer total deficiencies than a typical Arkansas assisted living residence (11 vs. AR avg 21).↓ 48% better
Deficiencies per year Info Average deficiencies per year since 2023. 3.77 This facility has 47% fewer deficiencies per year than a typical Arkansas assisted living residence (3.7 vs. AR avg 7).↓ 47% better

Inspection Reports Summary Info An editor-reviewed summary of the themes and findings across this facility's recent inspection reports.

  • April 7, 2023 annual inspection found no health deficiencies and no complaints were substantiated.
  • April 25, 2024 inspection cited six deficiencies including unsecured mechanical rooms, improper resident transfers, poor food storage, and inadequate dental and respiratory care.
  • July 31, 2025 inspection found one deficiency for dietary staff failing to wash hands between dirty and clean tasks during meal preparation.

Health Inspection History

Inspections since 2022
Total health inspections 3

State average N/A


Last Health inspection on May 2024

Total health citations
4

State average N/A

Citations per inspection
1.33

State average N/A


Health citations are formal notices following inspections when they fail to comply with safety and care standards.

All 4 citations resulted from standard inspections.

Breakdown of citation severity (last 4 years)
Critical health citations
0
In line with State average

State average: N/A


Serious health citations
0
In line with State average

State average: N/A

0 critical citations State average: N/A

0 serious citations State average: N/A

4 moderate citations State average: N/A

0 minor citations State average: N/A
Citations history (last 4 years)
Pharmacy moderate citation May 15, 2024
Corrected

Infection Control moderate citation Apr 05, 2023
Corrected

Resident Rights moderate citation Apr 05, 2023
Corrected

Resident Rights moderate citation Feb 24, 2022
Corrected

Staffing Data

Reporting period: October 1 – December 31, 2025 (Q4 2025). Source: CMS Payroll-Based Journal report.

Total staff 120
Employees 106
Contractors 14
Staff to resident ratio 3.75 : 1
0% compared with State average

State average ratio: 0 : 0

Avg staff/day 39
Average shift 8.6 hours
0% compared with State average

State average: 0 hours

Total staff hours (quarter) 30,705

Nursing staff breakdown

Q4 2025 · Oct 1 – Dec 31 More info This data comes from the CMS Payroll-Based Journal report covering October 1 – December 31, 2025.
Registered Nurse

Manages medical care and health needs.

RN Staff Info All 9 RN Staff are full-time employees. No contractors work on this role. 9
Average shift length Info Average shift length. Calculated as total hours divided by days worked and average staff per day. 6.7 hours
Licensed Practical Nurse

Assists with medical care and medications.

LPN Staff Info All 19 LPN Staff are full-time employees. No contractors work on this role. 19
Average shift length Info Average shift length. Calculated as total hours divided by days worked and average staff per day. 10 hours
Certified Nursing Assistant

Helps with daily care and mobility.

CNA Staff Info All 49 CNA Staff are full-time employees. No contractors work on this role. 49
Average shift length Info Average shift length. Calculated as total hours divided by days worked and average staff per day. 8.4 hours

Contractor staffing

Q4 2025 · Oct 1 – Dec 31 More info This data comes from the CMS Payroll-Based Journal report covering October 1 – December 31, 2025.

Total hours from contractors

4.8%

1,477 contractor hours this quarter

Qualified Social Worker: 4 Clinical Nurse Specialist: 3 Respiratory Therapy Technician: 2 Physical Therapy Assistant: 1 Medical Director: 1 Occupational Therapy Assistant: 1 Physical Therapy Aide: 1 Occupational Therapy Aide: 1

Staff by category

Q4 2025 · Oct 1 – Dec 31 More info This data comes from the CMS Payroll-Based Journal report covering October 1 – December 31, 2025.
Certified Nursing Assistant4904914,73392100%8.4
Licensed Practical Nurse190195,86092100%10
Nurse Aide in Training8082,4479199%8.6
Medication Aide/Technician6061,8179199%9.7
Clinical Nurse Specialist4371,3039199%8.5
RN Director of Nursing4041,0306672%7.2
Other Dietary Services Staff2026206874%7.5
Nurse Practitioner3035846773%7.6
Mental Health Service Worker1015676773%8.5
Administrator1013924953%8
Respiratory Therapy Technician0223776773%5.6
Physical Therapy Assistant0113596571%5.5
Registered Nurse9093423639%6.7
Qualified Social Worker0442125155%3.9
Medical Director0113878%5.4
Occupational Therapy Assistant0111033%3.4
Occupational Therapy Aide011933%2.8
Physical Therapy Aide011622%3
49 Certified Nursing Assistant
% of Days 100%
19 Licensed Practical Nurse
% of Days 100%
8 Nurse Aide in Training
% of Days 99%
6 Medication Aide/Technician
% of Days 99%
7 Clinical Nurse Specialist
% of Days 99%
4 RN Director of Nursing
% of Days 72%
2 Other Dietary Services Staff
% of Days 74%
3 Nurse Practitioner
% of Days 73%
1 Mental Health Service Worker
% of Days 73%
1 Administrator
% of Days 53%
2 Respiratory Therapy Technician
% of Days 73%
1 Physical Therapy Assistant
% of Days 71%
9 Registered Nurse
% of Days 39%
4 Qualified Social Worker
% of Days 55%
1 Medical Director
% of Days 8%
1 Occupational Therapy Assistant
% of Days 3%
1 Occupational Therapy Aide
% of Days 3%
1 Physical Therapy Aide
% of Days 2%

Penalties and fines

Federal penalties imposed by CMS for regulatory violations, including civil money penalties (fines) and denials of payment for new Medicare/Medicaid admissions.

Source: CMS Penalties Database

No penalties in the past 3 years

No civil money penalties or payment denials were reported in the last 3 years.

Quality of care over time

These measures show how residents usually do over time at this home, based on health outcomes and preventive care.

High-risk clinical events score Info A composite score based on pressure ulcers, falls with injury, weight loss, walking ability decline, and activities of daily living decline. 12.4
62% worse than State average

State average: 7.7

Functional decline score Info A composite score based on activities of daily living decline, walking ability decline, and incontinence. 23.0
73% worse than State average

State average: 13.3

Long-stay resident measures
Significantly above average State avg: 4.2 Info CMS star rating based on long-stay quality measure performance. 5 stars = significantly above average, 1 star = significantly below average.
Need for Help with Daily Activities Increased Info Percent of long-stay residents whose need for help with daily activities has increased 23.2%
102% worse than State average

State average: 11.5%

Walking Ability Worsened Info Percent of long-stay residents whose ability to move independently worsened 17.2%
29% worse than State average

State average: 13.4%

Low Risk Residents with Bowel/Bladder Incontinence Info Percent of low risk long-stay residents who lose control of their bowels or bladder 28.5%
89% worse than State average

State average: 15.1%

Falls with Major Injury Info Percent of long-stay residents experiencing one or more falls with major injury 8.4%
114% worse than State average

State average: 3.9%

High Risk Residents with Pressure Ulcers Info Percent of long-stay high risk residents with pressure ulcers 8.9%
87% worse than State average

State average: 4.7%

Urinary Tract Infection Info Percent of long-stay residents with a urinary tract infection 4.2%
226% worse than State average

State average: 1.3%

Lost Too Much Weight Info Percent of long-stay residents who lose too much weight 4.4%
12% better than State average

State average: 5.0%

Depressive Symptoms Info Percent of long-stay residents who have depressive symptoms 5.0%
220% worse than State average

State average: 1.5%

Antipsychotic Use Info Percent of long-stay residents who received an antipsychotic medication 3.4%
68% better than State average

State average: 10.5%

Pneumococcal Vaccine Info Percent of long-stay residents assessed and appropriately given the pneumococcal vaccine 100.0%
6% better than State average

State average: 94.4%

Influenza Vaccine Info Percent of long-stay residents assessed and appropriately given the seasonal influenza vaccine 100.0%
In line with State average

State average: 96.2%

Hospitalizations per 1,000 days Info Number of hospitalizations per 1,000 long-stay resident days. 1.59
19% better than State average

State average: 1.97

ED visits per 1,000 days Info Number of outpatient emergency department visits per 1,000 long-stay resident days. 2.33
7% worse than State average

State average: 2.18

Short-stay resident measures
Average State avg: 2.7 Info CMS star rating based on short-stay quality measure performance. 5 stars = much above average, 1 star = much below average.
Pneumococcal Vaccine Info Percent of short-stay residents assessed and appropriately given the pneumococcal vaccine 95.2%
18% better than State average

State average: 80.9%

Antipsychotic medication increase Info Percent of short-stay residents who newly received an antipsychotic medication 1.3%
16% better than State average

State average: 1.5%

Influenza Vaccine Info Percent of short-stay residents assessed and appropriately given the seasonal influenza vaccine 87.5%
13% better than State average

State average: 77.7%

Re-hospitalized after SNF stay Info Percentage of short-stay residents who were re-hospitalized after their nursing home admission. 26.9%
7% worse than State average

State average: 25.2%

Emergency department visits Info Percentage of short-stay residents who had an outpatient emergency department visit. 9.1%
34% better than State average

State average: 13.8%

Falls with major injury Info Percentage of SNF residents who experience falls with major injury during their stay. 0.0%
100% better than State average

State average: 0.8%

Ability to care for self at discharge Info Percentage of residents at or above expected ability to care for themselves at discharge. 60.9%
13% better than State average

State average: 53.7%

Successful return to home or community Info Rate of successful return to home or community from a skilled nursing facility. 55.1%
9% better than State average

State average: 50.6%

Breakdown by payment type

Medicare

30% of new residents, usually for short-term rehab.

Typical stay 24 days

Private pay

64% of new residents, often for short stays.

Typical stay 2 - 3 months

Medicaid

5% of new residents, often for long-term daily care.

Typical stay 5 years

Facility Characteristics

Source: CMS Long-Term Care Facility Characteristics (Data as of Jan 2026)

Total residents 32
Medicaid
15
46.9% of residents
Private pay or other
17
53.1% of residents
Programs & Services
Residents Group

Residents meet regularly to discuss policies, care quality, and activities

Active Resident Council

Organized group of residents that meets regularly to discuss facility policies, quality of life, and activities.

Finances and operations

Based on CMS SNF Cost Report for fiscal year ending in 12/2023.

Government
Operated by county authorities.
Net patient revenue Info Net patient revenue — what the home actually collects for resident care, after contractual allowances, bad debt and discounts are subtracted from its gross charges (CMS cost report, Worksheet G-3). It covers resident care only; money the home earns from other sources is shown separately as "Other income."
$8.5M
Net patient income Info Net patient income: net patient revenue minus the home's total operating expenses. A positive figure means it earns more from resident care than it spends to deliver it; a negative figure means the opposite. It excludes non-operating "other income."
-$626.4K
Government Operated by county authorities.
Net patient revenue Info Net patient revenue — what the home actually collects for resident care, after contractual allowances, bad debt and discounts are subtracted from its gross charges (CMS cost report, Worksheet G-3). It covers resident care only; money the home earns from other sources is shown separately as "Other income."
$8.5M
Net patient income Info Net patient income: net patient revenue minus the home's total operating expenses. A positive figure means it earns more from resident care than it spends to deliver it; a negative figure means the opposite. It excludes non-operating "other income."
-$626.4K
Other income Info Money the home earns outside of resident care — such as investments, grants, rentals and other non-operating sources (CMS cost report, Worksheet G-3). It is tracked separately from net patient revenue: it is not part of that figure, and it is not included in net patient income.
$169.8K
Payroll costs Info Staff salaries plus wage-related costs — benefits such as payroll taxes, health insurance and retirement — from the home's own accounting records (CMS cost report, Worksheet A). Contract or agency labor is counted separately, under other operating costs.
$4.6M 54.2% of net patient revenue Info Payroll as a share of revenue: staff salaries and wage-related benefits divided by net patient revenue. A higher figure means more of each revenue dollar goes to staff pay.
Other operating costs Info Everything it costs to run the home apart from payroll — food, utilities, supplies, maintenance, contract labor and administration. Calculated as total operating expense minus payroll (staff salaries and wage-related benefits).
$4.5M
Total costs Info The home's total operating expense for the year — all the costs of running it, salaries included (CMS cost report, Worksheet G-3).
$9.1M

Who this home usually serves

TYPE OF STAY

Primarily short stays

Residents typically stay for brief periods, with frequent admissions and discharges throughout the year.

Most new residents arrive under private pay (64% of admissions), and a typical private pay stay runs around 2 - 3 months.

Admissions
185 total

Coverage residents most often arrive under.

Medicare 30%
Private pay 64%
Medicaid 5%
Discharges
191 total

Coverage residents most often leave under.

Medicare 17%
Private pay 75%
Medicaid 8%

Places of interest near Heartland Rehabilitation and Care Center

Address 5.5 miles from city center Info Estimated distance in miles from Benton's city center to Heartland Rehabilitation and Care Center's address, calculated via Google Maps.

Calculate Travel Distance to Heartland Rehabilitation and Care Center

Add your location

Address

Compare Nursing Homes around the area

The information below is reported by the Arkansas Department of Human Services, Office of Long Term Care.

Heartland Rehabilitation and Care Center
NH
RC
Benton -119 A+ 0 -
Butterfield Trail Village
NH
AL
IL
Fayetteville (East Joyce Boulevard) -87 A+ 39 Studio / 1 Bed / 2 Bed
Barnes Healthcare
NH
MC
Lonoke -141 A+ 38 Private / Shared Rooms
The Green House Cottages of Poplar Grove
NH
HC
MC
RC
Little Rock (Leander) -120 A+ 31 Private Rooms / Semi-Private Rooms
Timberlane Health & Rehab
NH
MC
RC
El Dorado -106 A+ 33 -

Frequently Asked Questions about Heartland Rehabilitation and Care Center

Who is the owner of Heartland Rehabilitation and Care Center?

Heartland Rehabilitation and Care Center is legally operated by Saline SNF Operations, LLC, and administered by Michael Tindell.

What is the occupancy rate at Heartland Rehabilitation and Care Center?

Heartland Rehabilitation and Care Center's occupancy is 61%.

Is Heartland Rehabilitation and Care Center a government-operated facility?

Heartland Rehabilitation and Care Center is a government-operated nursing facility in AR.

Who is the administrator of Heartland Rehabilitation and Care Center?

Michael Tindell is the administrator of Heartland Rehabilitation and Care Center.

How many beds does Heartland Rehabilitation and Care Center have?

Heartland Rehabilitation and Care Center has 119 beds.

Are there photos of Heartland Rehabilitation and Care Center?

Yes — there are 4 photos of Heartland Rehabilitation and Care Center in the photo gallery on this page.

What is the address of Heartland Rehabilitation and Care Center?

Heartland Rehabilitation and Care Center is located at 19701 Interstate 30, Benton, AR 72015.

Guides for Better Senior Living

Care Cost Calculator: See Prices in Your Area

Nursing Home Data Explorer

Don’t Wait Too Long: 7 Red Flag Signs Your Parent Needs Assisted Living Now

The True Cost of Assisted Living in 2025 – And How Families Are Paying For It

Understanding Senior Living Costs: Pricing Models, Discounts & Financial Assistance