Occupancy rate
92%

We arrange tours, appointments, and even moving support so you don’t have to
Thank you for your interest!
Our team will be in touch shortly to help with next steps.

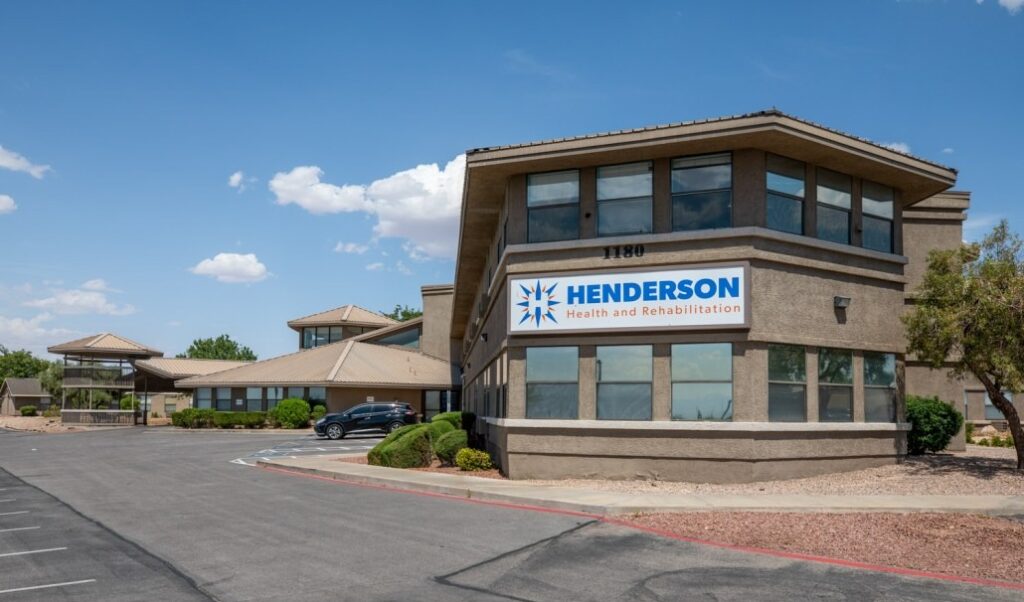
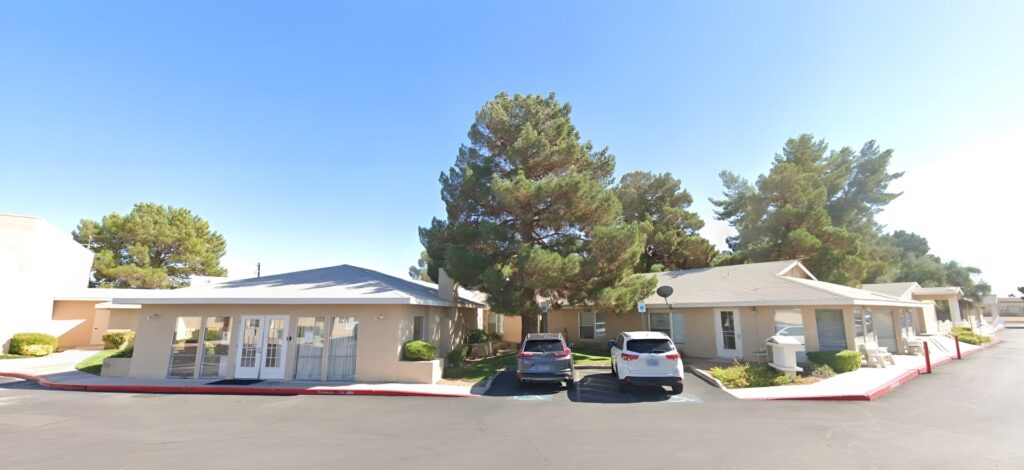
Henderson Health and Rehabilitation is an exceptional community located near Cadence Central Park in Henderson, NV, offering skilled nursing and rehabilitation. With a kind and highly skilled team available around the clock, residents receive top-notch care for their unique needs and preferences. The community also promotes a nurturing and welcoming environment, ensuring residents feel at ease and live their golden years to the fullest.
Residents will not run out of things to do with a fun-filled calendar of recreational activities and stimulating programs tailored to their leisure and wellness. Mealtimes are also something to look forward to, with delightful and healthy meals catering to their dietary needs and preferences. Make the most of your golden years and jump back into your life with the community’s comprehensive services and purposely designed amenities.
May provide extensive amenities, services and programs.
Occupancy is moderate, suggesting balanced demand.
Most residents stay for extended periods and receive ongoing daily care.
38% of new residents, usually for short-term rehab.
21% of new residents, often for short stays.
41% of new residents, often for long-term daily care.
Henderson Health and Rehab is administrated by SETH ANDERSON.
Accept Medicaid: Yes
Total Residents: 238 Residents
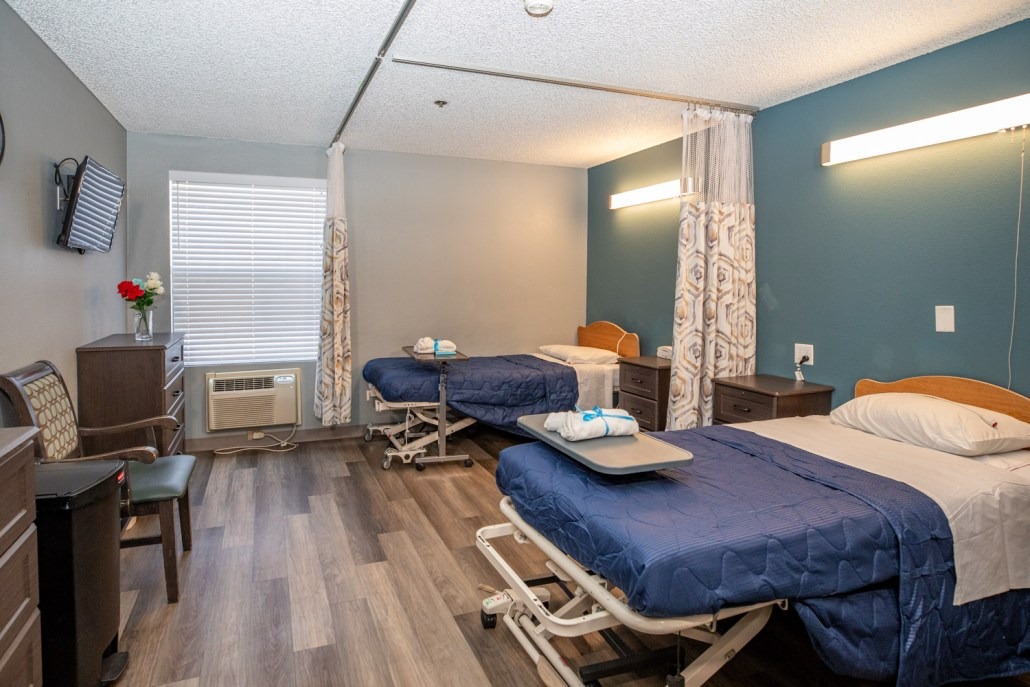
Housing Options: Private / Semi-private Rooms
Building Type: Single-story
Dining Services

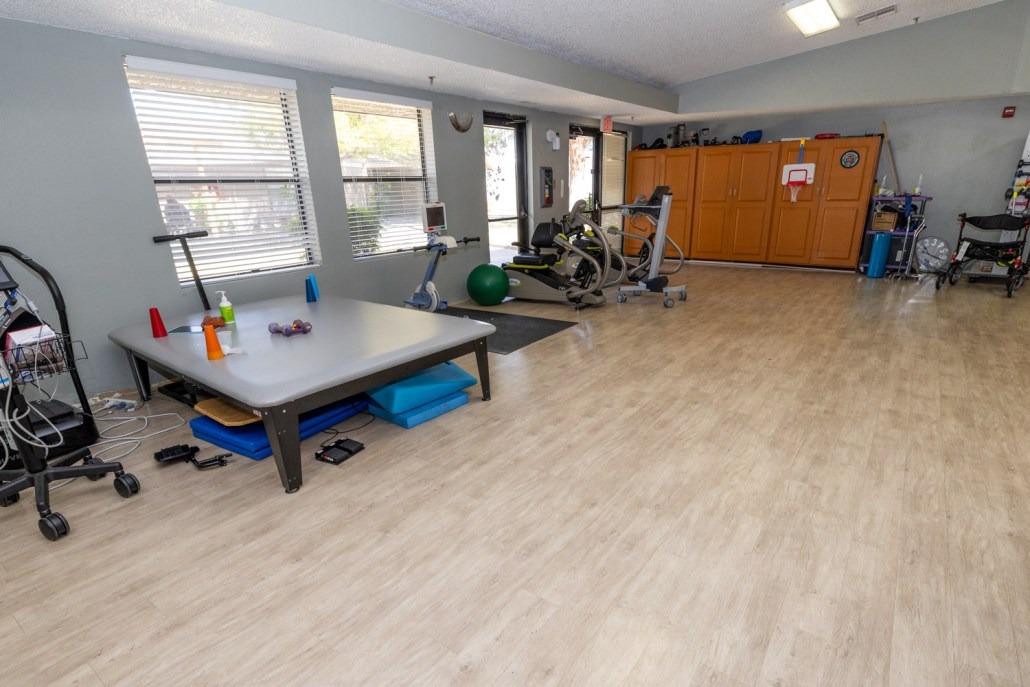
Health Programs
In Nevada, the Department of Health and Human Services, Bureau of Health Care Quality and Compliance performs unannounced onsite surveys to evaluate resident safety and care quality.
Deficiencies indicate regulatory issues. A higher number implies the facility had several areas requiring improvement.
Nevada average 5.1
Last Health inspection on Aug 2025
Nevada average 36.2
Nevada average 7.08
Health citations are formal notices following inspections when they fail to comply with safety and care standards.
24 of 37 citations resulted from standard inspections; 9 of 37 resulted from complaint investigations; and 4 of 37 came from combined inspections (standard and complaint).
Nevada average: 0.1
Nevada average: 0.5
Data sourced from CMS Health Deficiencies reports. Citation severity codes range from A (least serious) to L (most serious). Immediate Jeopardy (J-L) citations indicate situations where the facility's noncompliance has placed residents at risk of death or serious harm.
Nursing Home Licensed facility providing 24/7 skilled nursing care for residents with complex, ongoing medical needs. Staffed by RNs, LPNs, and CNAs. Inspected and star-rated annually by CMS. Accepts Medicare (short-term rehab) and Medicaid (long-term care).
Nursing Home Licensed facility providing 24/7 skilled nursing care for residents with complex, ongoing medical needs. Staffed by RNs, LPNs, and CNAs. Inspected and star-rated annually by CMS. Accepts Medicare (short-term rehab) and Medicaid (long-term care).
Nursing Home Licensed facility providing 24/7 skilled nursing care for residents with complex, ongoing medical needs. Staffed by RNs, LPNs, and CNAs. Inspected and star-rated annually by CMS. Accepts Medicare (short-term rehab) and Medicaid (long-term care).
Nursing Home Licensed facility providing 24/7 skilled nursing care for residents with complex, ongoing medical needs. Staffed by RNs, LPNs, and CNAs. Inspected and star-rated annually by CMS. Accepts Medicare (short-term rehab) and Medicaid (long-term care).
Nursing Home Licensed facility providing 24/7 skilled nursing care for residents with complex, ongoing medical needs. Staffed by RNs, LPNs, and CNAs. Inspected and star-rated annually by CMS. Accepts Medicare (short-term rehab) and Medicaid (long-term care).
![]() 2.1 miles from city center
2.1 miles from city center
![]() 1180 E Lake Mead Pkwy, Henderson, NV 89015
1180 E Lake Mead Pkwy, Henderson, NV 89015
Add your location
This data corresponds to Q2 2025 and is based on CMS Payroll-Based Journal.
Nevada average ratio: 1.57:1
Nevada average: 8.8 hours
Manages medical care and health needs.
No contractors work on this role.
Assists with medical care and medications.
No contractors work on this role.
Helps with daily care and mobility.
No contractors work on this role.
Total hours from contractors
0 contractor hours this quarter
No contractor roles were reported this quarter.
| Certified Nursing Assistant | 116 | 0 | 116 | 39,375 | 91 | 100% | 8.2 |
| Licensed Practical Nurse | 44 | 0 | 44 | 15,542 | 91 | 100% | 9.6 |
| Registered Nurse | 34 | 0 | 34 | 12,461 | 91 | 100% | 10.2 |
| RN Director of Nursing | 9 | 0 | 9 | 4,324 | 84 | 92% | 8 |
| Dental Services Staff | 9 | 0 | 9 | 4,238 | 91 | 100% | 8.3 |
| Respiratory Therapy Technician | 7 | 0 | 7 | 1,814 | 90 | 99% | 7.8 |
| Other Dietary Services Staff | 12 | 0 | 12 | 1,697 | 89 | 98% | 7.5 |
| Speech Language Pathologist | 5 | 0 | 5 | 1,567 | 70 | 77% | 7.4 |
| Physical Therapy Assistant | 5 | 0 | 5 | 1,405 | 91 | 100% | 6.4 |
| Physical Therapy Aide | 4 | 0 | 4 | 1,139 | 64 | 70% | 7.8 |
| Clinical Nurse Specialist | 3 | 0 | 3 | 736 | 70 | 77% | 7.5 |
| Nurse Practitioner | 1 | 0 | 1 | 585 | 65 | 71% | 9 |
| Administrator | 1 | 0 | 1 | 520 | 65 | 71% | 8 |
| Occupational Therapy Aide | 1 | 0 | 1 | 520 | 65 | 71% | 8 |
| Dietitian | 1 | 0 | 1 | 520 | 65 | 71% | 8 |
| Mental Health Service Worker | 1 | 0 | 1 | 504 | 63 | 69% | 8 |
| Therapeutic Recreation Specialist | 2 | 0 | 2 | 460 | 58 | 64% | 7.4 |
| Medical Director | 1 | 0 | 1 | 432 | 54 | 59% | 8 |
| Qualified Social Worker | 5 | 0 | 5 | 392 | 45 | 49% | 7.1 |
| Physical Therapist | 1 | 0 | 1 | 7 | 1 | 1% | 6.5 |
Source: CMS Long-Term Care Facility Characteristics (Data as of Jan 2026)
Residents meet regularly to discuss policies, care quality, and activities
Organized group of residents that meets regularly to discuss facility policies, quality of life, and activities.
Data sourced from CMS Long-Term Care Facility Characteristics quarterly report. Payer mix reflects the current resident census by primary payment source.
These measures show how residents usually do over time at this home, based on health outcomes and preventive care.
Nevada average: 9.7
Nevada average: 17.5
Nevada average: 15.6%
Nevada average: 20.8%
Nevada average: 16.9%
Nevada average: 2.5%
Nevada average: 5.5%
Nevada average: 1.4%
Nevada average: 5.4%
Nevada average: 4.2%
Nevada average: 14.1%
Nevada average: 91.0%
Nevada average: 89.6%
Nevada average: 1.82
Nevada average: 1.50
Nevada average: 83.9%
Nevada average: 2.0%
Nevada average: 80.7%
Nevada average: 23.4%
Nevada average: 9.8%
Nevada average: 0.8%
Nevada average: 53.7%
Nevada average: 50.6%
Quality measures are calculated from Minimum Data Set (MDS) assessments. For most measures, lower percentages indicate better care quality.
Federal penalties imposed by CMS for regulatory violations, including civil money penalties (fines) and denials of payment for new Medicare/Medicaid admissions.
Source: CMS Penalties Database (Data as of Jan 2026)
Nevada average: $34K
Nevada average: 1.4
Nevada average: 0.1
Penalties are imposed by CMS for violations of federal nursing home regulations.
Last updated: Jan 2026
Historical financial and operational data for Henderson Health and Rehab based on CMS SNF Cost Reports.
Loading trend charts...
Care Cost Calculator: See Prices in Your Area
Nursing Home Data Explorer
Don’t Wait Too Long: 7 Red Flag Signs Your Parent Needs Assisted Living Now
The True Cost of Assisted Living in 2025 – And How Families Are Paying For It
Understanding Senior Living Costs: Pricing Models, Discounts & Financial Assistance

Touring a community? Use this expert-backed checklist to stay organized, ask the right questions, and find the perfect fit.
We'll send you a PDF version of the touring checklist.