Explore Open Rooms

1 Contact details
2 What type of senior care service are you looking for?
3 What budget do you have in mind for senior care?
4 How soon do you need to find care?
5 Additional details

Thank you for your interest!

Our team will be in touch shortly to help with next steps.

Nursing Home in Detroit

CMS overall rating Info The Overall CMS Rating combines results from health inspections, staffing levels and quality measures. Health inspections carry the most weight. Staffing and quality scores can increase or decrease the final rating based on performance compared to state and national standards.

Heritage Manor

9500 Grand River Ave, Detroit, MI 48204 View map
Overview of Heritage Manor

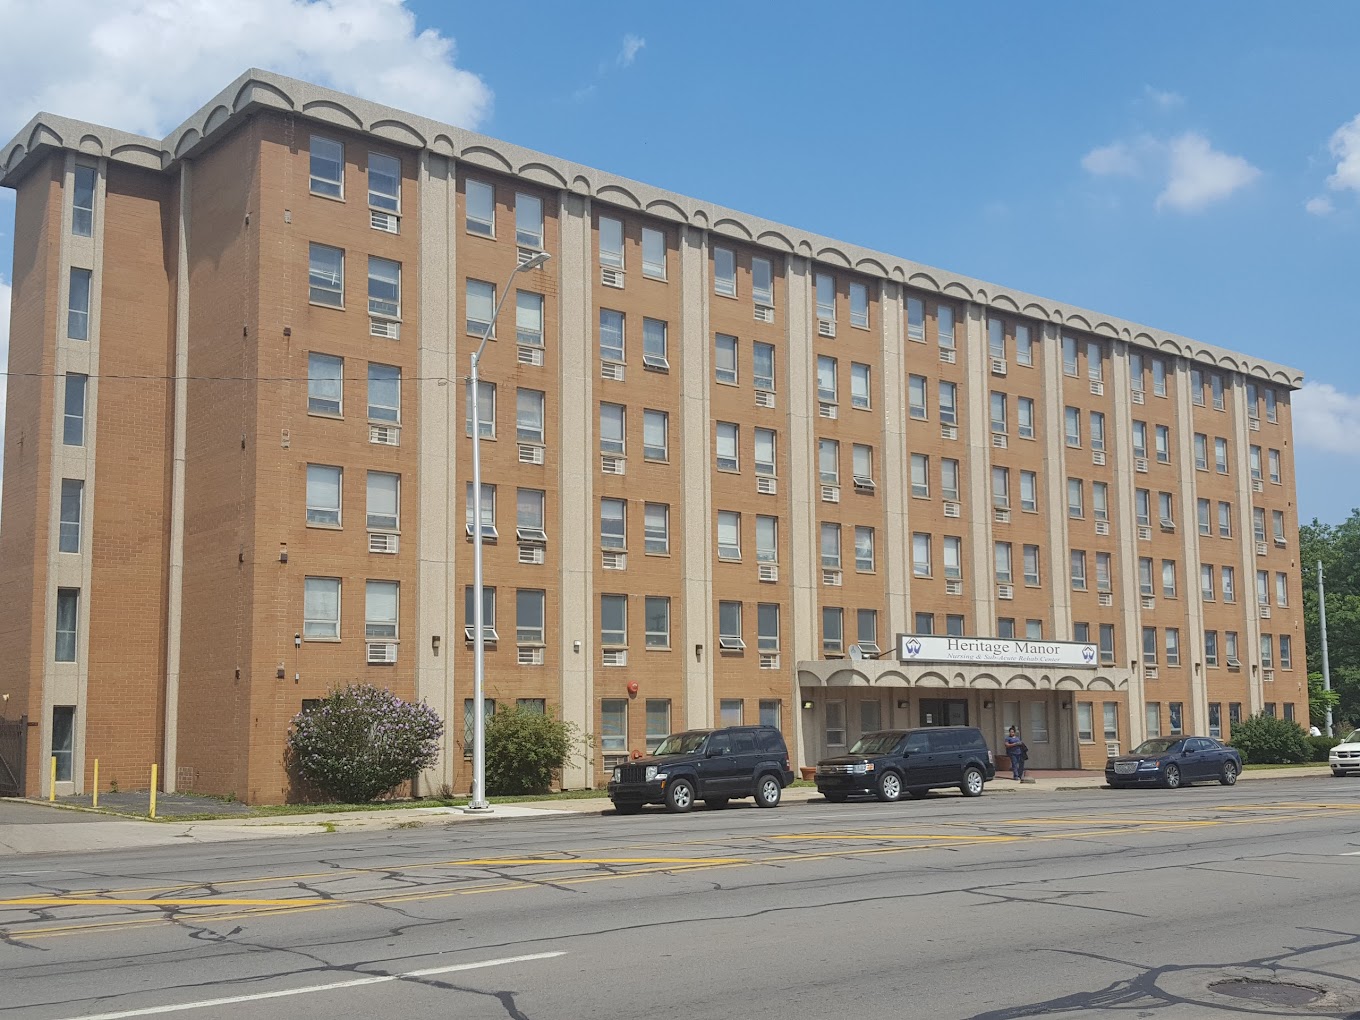
Heritage Manor is a nursing home in Detroit, MI, offering long-term care and short-term rehabilitation. Promoting a supportive and welcoming environment, the community ensures older adults are well-cared for. 24-hour care, household services, and well-balanced meals are also provided to improve residents’ living experiences. The community also works closely with residents to meet their ever-changing needs and preferences.

Light exercises, fun gatherings, and recreational activities encourage residents to make friends and have fun. Accessible amenities and spacious common areas also ensure residents can rest and move around safely. Situated near highways and bus stops in the tree-lined neighborhood of Detroit, the community guarantees accessibility and convenience. This nursing home has dedicated services and top-notch amenities, making it a good option for senior living in Michigan.

(626) 573-3141

Quality ratings

Measured by Centers for Medicare & Medicaid Services (CMS)

Overall rating Info The Overall CMS Rating combines results from health inspections, staffing levels and quality measures. Health inspections carry the most weight. Staffing and quality scores can increase or decrease the final rating based on performance compared to state and national standards.
2/5
Michigan average: 3.1/5
Health Inspection Info Based on the results of the facility's three most recent standard inspections and any complaint investigations. CMS reviews the number, scope, and severity of deficiencies, with more recent findings weighted more heavily.
2/5
Michigan average: 2.8/5
Staffing Info Measures average nursing staff hours per resident per day, including Registered Nurses (RNs) and total nursing staff. Ratings are adjusted based on the level of care residents require and are compared to state and national benchmarks.
2/5
Michigan average: 3.5/5
Quality Measures Info Based on clinical and physical health indicators reported to CMS, such as hospital readmissions, falls, pressure ulcers, and improvements in mobility. These measures reflect how well residents' health needs are being managed.
3/5
Michigan average: 3.8/5

Nursing care per resident

Info This shows how many total hours of nursing staff time are available per resident each day. Higher numbers usually mean more staff support.
4h 12m per day

This home provides 2% less nursing time per resident than the Michigan average.

Michigan average: 4h 18m per day

Staffing hours breakdown

Info Hours of care per resident per day, broken down by staff type. Data from CMS Medicare.
Staff type Facility State avg National avg
Registered Nurse (RN) Info Registered nurse hours per resident per day. 16m per day 46m per day 41m per day
Nurse Aide Info Nurse aide hours per resident per day. 2h 3m per day 2h 23m per day 2h 21m per day
Total Nursing (Weekend) Info Total number of nurse staff hours per resident per day on weekends. 2h 59m per day 3h 31m per day 3h 26m per day
Physical Therapist Info Physical therapist staff hours per resident per day. 2m per day 4m per day 4m per day
RN (Weekend) Info Registered nurse hours per resident per day on weekends. 8m per day 29m per day 29m per day

Capacity and availability

Medium-capacity home

Offers a balance of services and community atmosphere.

Total beds 122

This home usually has limited availability

Occupancy is moderate, suggesting balanced demand.

Similar demand to the Michigan average
Occupancy rate 90.3%
Residents per day (avg) 108
Occupancy rate
90.3%
Residents per day (avg)
108

Who this home usually serves

TYPE OF STAY

Primarily short stays

Residents typically stay for brief periods, with frequent admissions and discharges throughout the year.

Might be optimal for
Post-acute recovery Temporary care Transitional stays

Breakdown by payment type

Medicare

28% of new residents, usually for short-term rehab.

Typical stay 2 - 3 months

Private pay

68% of new residents, often for short stays.

Typical stay 5 - 6 months

Medicaid

4% of new residents, often for long-term daily care.

Typical stay 2 years

Finances and operations

Privately-owned community
Operated by a business corporation.
Home revenue
$14.1M
Profit
$12.2K
Privately-owned community Operated by a business corporation.
Home revenue
$14,076,419.00
Profit
$12,150.00
Payroll costs Info The portion of the home's budget spent on staff, including nurses, caregivers, and other employees who support care and operations.
$6.6M
46.7% of revenue
Other operating costs Info All remaining costs needed to run the home, such as food, utilities, building maintenance, supplies and administrative expenses.
$7.5M
Total costs $14.1M
Walk Score
Walk Score: 61 / 100
Moderately walkable. Some errands can be accomplished on foot, with a mix of nearby amenities.

About this community

Safety & Compliance

Emergency SystemsIntercom systems for immediate assistance.
Safety FeaturesSprinkler system throughout the home.

Staffing & Medical

1 service
24-Hour Staffing

Amenities & Lifestyle

0 amenities
ActivitiesActivities include birthday celebrations, movie night, walking day, craft projects, day trips, spring flower planting, bingo, Sunday brunch, spa day, holiday parties, and live music.
Specific Programs24-Hour Qualified Staff, Scheduled Meals, Special Diets Available, Medication Supervision and Dispensing, Nourishing Snacks and Beverages, Activities including Birthday celebrations, Movie Night, Walking Day, Craft Projects, Day Trips, Spring Flower Planting, Bingo, Sunday Brunch, Spa Day, Holiday Parties, Live Music.

Dining & Nutrition

Food DescriptionScheduled meals and nourishing snacks and beverages are always available.
Meals IncludedYes
Special DietsYes

What does this home offer?

Accepts Medicaid icon

Accept Medicaid: Yes

Total residents icon

Total Residents: 122

Building type icon
Building type icon

Building Type: Mid-rise

Types of Care at Heritage Manor

Nursing Home
Contact Heritage Manor

Health Inspection History

Inspections
Total health inspections 10

Michigan average 6.5


Last Health inspection on Jul 2025

Total health citations 36

Michigan average 33.5

Citations per inspection
3.6

Michigan average 5.18


Health citations are formal notices following inspections when they fail to comply with safety and care standards.

20 of 36 citations resulted from standard inspections; 15 of 36 resulted from complaint investigations; and 1 of 36 came from combined inspections (standard and complaint).

Breakdown of citation severity (last 3 years)
Critical Health citations More info 0
100% better than Michigan average

Michigan average: 0.3


Serious Health citations More info 1
47% better than Michigan average

Michigan average: 1.9

0 critical citations More info Michigan average: 0.3

1 serious citation More info Michigan average: 1.9

35 moderate citations More info Michigan average: 30.8

0 minor citations More info Michigan average: 0.5
Citations history (last 3 years)
Abuse/Neglect moderate citation Info Issues related to protecting resident's from harm, including abuse, neglect, or mistreatment. Jul 31, 2025
Corrected

Environmental moderate citation Info Issues related to building safety, cleanliness, maintenance, and overall living conditions. Jun 25, 2025
Corrected

Nutrition moderate citation Info Issues related to food quality, meal service, and resident's nutritional needs. Jun 25, 2025
Corrected

Resident Rights moderate citation Info Issues related to resident's rights, including dignity, privacy, and the ability to make decisions about their care. May 19, 2025
Corrected

Compare Nursing Homes around Detroit The information below is reported by the Michigan Department of Licensing and Regulatory Affairs (LARA).

5 facilities compared · CMS & MI Dept. of Health data · Updated Apr 2026

Filter by care type
OakPointe Senior Care & Rehab Center
NH

Nursing Home Licensed facility providing 24/7 skilled nursing care for residents with complex, ongoing medical needs. Staffed by RNs, LPNs, and CNAs. Inspected and star-rated annually by CMS. Accepts Medicare (short-term rehab) and Medicaid (long-term care).

AL

Assisted Living A licensed, long-term care setting for seniors or individuals with disabilities who need help with daily activities — like bathing, dressing, and medication management — but not 24-hour skilled nursing. Offers housing, meals, and around-the-clock support while aiming to maximize resident independence.

Detroit (Schulze)
133
12.1%
-84%
4.36
-33%
+1%
0
14
4.7
0
88
67
Ensign, Thomas
$17.3M
$6.8M
39.6%
235207
Boulevard Temple Care Center
NH

Nursing Home Licensed facility providing 24/7 skilled nursing care for residents with complex, ongoing medical needs. Staffed by RNs, LPNs, and CNAs. Inspected and star-rated annually by CMS. Accepts Medicare (short-term rehab) and Medicaid (long-term care).

Detroit (Henry Ford)
124
79.7%
+5%
4.49
-52%
+5%
1
19
3.8
1
114
76
Dimitrie, Lisa
$21.0M
$6.1M
28.9%
235498
Heritage Manor
AL

Assisted Living A licensed, long-term care setting for seniors or individuals with disabilities who need help with daily activities — like bathing, dressing, and medication management — but not 24-hour skilled nursing. Offers housing, meals, and around-the-clock support while aiming to maximize resident independence.

IL

Independent Living Lifestyle-focused communities for older adults offering dining, activities, and transportation with minimal personal care. Best for active, independent seniors who want community without medical support.

MC

Memory Care Secured, specialized care for people living with Alzheimer's or dementia. Staff trained in cognitive impairment, with higher staff-to-resident ratios and an environment designed to reduce confusion and wandering risk.

NH

Nursing Home Licensed facility providing 24/7 skilled nursing care for residents with complex, ongoing medical needs. Staffed by RNs, LPNs, and CNAs. Inspected and star-rated annually by CMS. Accepts Medicare (short-term rehab) and Medicaid (long-term care).

Detroit (Nardin Park)
122
90.3%
+19%
4.20
-55%
-2%
1
36
3.6
1
108
61
Uddin, Fahim
$13.4M
$6.6M
48.9%
235234
Ambassador Nursing and Rehabilitation Center
NH

Nursing Home Licensed facility providing 24/7 skilled nursing care for residents with complex, ongoing medical needs. Staffed by RNs, LPNs, and CNAs. Inspected and star-rated annually by CMS. Accepts Medicare (short-term rehab) and Medicaid (long-term care).

AL

Assisted Living A licensed, long-term care setting for seniors or individuals with disabilities who need help with daily activities — like bathing, dressing, and medication management — but not 24-hour skilled nursing. Offers housing, meals, and around-the-clock support while aiming to maximize resident independence.

Chicago (Albany Park)
190
69.5%
0%
2.21
-1%
-29%
0
62
3.3
4
161
88
B & N Realty Investment Llc
$14.4M
$7.2M
49.9%
145343
Beaconshire Nursing Center
NH

Nursing Home Licensed facility providing 24/7 skilled nursing care for residents with complex, ongoing medical needs. Staffed by RNs, LPNs, and CNAs. Inspected and star-rated annually by CMS. Accepts Medicare (short-term rehab) and Medicaid (long-term care).

AL

Assisted Living A licensed, long-term care setting for seniors or individuals with disabilities who need help with daily activities — like bathing, dressing, and medication management — but not 24-hour skilled nursing. Offers housing, meals, and around-the-clock support while aiming to maximize resident independence.

Detroit (Evergreen Lahser 7/8)
99
83.7%
+10%
-
-46%
-
4
51
4.3
4
96
63
Lafferty, Trina
$16.7M
$4.2M
25.3%
235475

Places of interest near Heritage Manor

Address 6.6 miles from city center — 2.53 miles to nearest hospital (Henry Ford Hospital)

Address 9500 Grand River Ave, Detroit, MI 48204

Calculate Travel Distance to Heritage Manor

Add your location

Address

Staffing Data (Q2 2025)

This data corresponds to Q2 2025 and is based on CMS Payroll-Based Journal.

Total staff 154
Employees 137
Contractors 17
Staff to resident ratio 1.54:1
12% worse than Michigan average

Michigan average ratio: 1.75:1

Avg staff/day 56
Average shift 8.1 hours
0% compared with Michigan average

Michigan average: 7.9 hours

Total staff hours (quarter) 41,295
Nursing staff breakdown
Registered Nurse

Manages medical care and health needs.

Total count 7
Average shift length Info Average shift length. Calculated as total hours divided by days worked and average staff per day. 9.6 hours

No contractors work on this role.

Licensed Practical Nurse

Assists with medical care and medications.

Total count 28
Average shift length Info Average shift length. Calculated as total hours divided by days worked and average staff per day. 9.3 hours

No contractors work on this role.

Certified Nursing Assistant

Helps with daily care and mobility.

Total count 66
Average shift length Info Average shift length. Calculated as total hours divided by days worked and average staff per day. 8.6 hours

No contractors work on this role.

Contractor staffing

Total hours from contractors

5%

2,078 contractor hours this quarter

Feeding Assistant: 4 Physical Therapy Assistant: 3 Physical Therapy Aide: 2 Qualified Social Worker: 2 Speech Language Pathologist: 2 Respiratory Therapy Technician: 2 Other Physician: 1 Medical Director: 1
Staff by category
Certified Nursing Assistant6606617,8508492%8.6
Licensed Practical Nurse280287,9948695%9.3
Physical Therapist150154,2868391%7
Registered Nurse7071,9858897%9.6
RN Director of Nursing5051,4137582%8.3
Other Dietary Services Staff5051,2948391%7.5
Nurse Aide in Training3031,1847178%11.3
Dental Services Staff2028426167%7.7
Clinical Nurse Specialist2025385459%7.9
Administrator1015206571%8
Nurse Practitioner1015206571%8
Dietitian1015206571%8
Physical Therapy Aide0224626571%6.5
Qualified Social Worker0224375965%7.4
Speech Language Pathologist0223996774%5.9
Respiratory Therapy Technician0223908593%4.1
Occupational Therapy Aide1012723437%8
Feeding Assistant0442106066%2.3
Physical Therapy Assistant0331705763%2.7
Other Physician011633%2
Medical Director011411%4
66 Certified Nursing Assistant
% of Days 92%
28 Licensed Practical Nurse
% of Days 95%
15 Physical Therapist
% of Days 91%
7 Registered Nurse
% of Days 97%
5 RN Director of Nursing
% of Days 82%
5 Other Dietary Services Staff
% of Days 91%
3 Nurse Aide in Training
% of Days 78%
2 Dental Services Staff
% of Days 67%
2 Clinical Nurse Specialist
% of Days 59%
1 Administrator
% of Days 71%
1 Nurse Practitioner
% of Days 71%
1 Dietitian
% of Days 71%
2 Physical Therapy Aide
% of Days 71%
2 Qualified Social Worker
% of Days 65%
2 Speech Language Pathologist
% of Days 74%
2 Respiratory Therapy Technician
% of Days 93%
1 Occupational Therapy Aide
% of Days 37%
4 Feeding Assistant
% of Days 66%
3 Physical Therapy Assistant
% of Days 63%
1 Other Physician
% of Days 3%
1 Medical Director
% of Days 1%

Facility Characteristics

Source: CMS Long-Term Care Facility Characteristics (Data as of Jan 2026)

Total census
100 residents
Residents by payment source
Medicare
7 residents (7%)
Medicaid
87 residents (87%)
Private pay or other
6 residents (6%)
Programs & Services
Residents' Group

Residents meet regularly to discuss policies, care quality, and activities

Active Resident Council

Organized group of residents that meets regularly to discuss facility policies, quality of life, and activities.

Quality of care over time

These measures show how residents usually do over time at this home, based on health outcomes and preventive care.

High-risk clinical events score Info A composite score based on pressure ulcers, falls with injury, weight loss, walking ability decline, and activities of daily living decline. 7.2
15% better than Michigan average

Michigan average: 8.4

Functional decline score Info A composite score based on activities of daily living decline, walking ability decline, and incontinence. 9.6
41% better than Michigan average

Michigan average: 16.3

Long-stay resident measures
Above average Michigan avg: 4.2 Info CMS star rating based on long-stay quality measure performance. 5 stars = significantly above average, 1 star = significantly below average.
Need for Help with Daily Activities Increased Info Percent of long-stay residents whose need for help with daily activities has increased 10.2%
18% better than Michigan average

Michigan average: 12.5%

Walking Ability Worsened Info Percent of long-stay residents whose ability to move independently worsened 8.5%
45% better than Michigan average

Michigan average: 15.3%

Low Risk Residents with Bowel/Bladder Incontinence Info Percent of low risk long-stay residents who lose control of their bowels or bladder 10.0%
52% better than Michigan average

Michigan average: 21.0%

Falls with Major Injury Info Percent of long-stay residents experiencing one or more falls with major injury 2.6%
19% better than Michigan average

Michigan average: 3.2%

High Risk Residents with Pressure Ulcers Info Percent of long-stay high risk residents with pressure ulcers 9.1%
58% worse than Michigan average

Michigan average: 5.7%

Urinary Tract Infection Info Percent of long-stay residents with a urinary tract infection 0.3%
83% better than Michigan average

Michigan average: 1.7%

Lost Too Much Weight Info Percent of long-stay residents who lose too much weight 5.5%
In line with Michigan average

Michigan average: 5.7%

Depressive Symptoms Info Percent of long-stay residents who have depressive symptoms 0.0%
100% better than Michigan average

Michigan average: 3.9%

Antipsychotic Use Info Percent of long-stay residents who received an antipsychotic medication 17.8%
19% worse than Michigan average

Michigan average: 15.0%

Pneumococcal Vaccine Info Percent of long-stay residents assessed and appropriately given the pneumococcal vaccine 49.7%
48% worse than Michigan average

Michigan average: 94.9%

Influenza Vaccine Info Percent of long-stay residents assessed and appropriately given the seasonal influenza vaccine 76.8%
19% worse than Michigan average

Michigan average: 95.0%

Hospitalizations per 1,000 days Info Number of hospitalizations per 1,000 long-stay resident days. 1.78
In line with Michigan average

Michigan average: 1.74

ED visits per 1,000 days Info Number of outpatient emergency department visits per 1,000 long-stay resident days. 1.76
14% worse than Michigan average

Michigan average: 1.54

Short-stay resident measures
Average Michigan avg: 3.1 Info CMS star rating based on short-stay quality measure performance. 5 stars = much above average, 1 star = much below average.
Pneumococcal Vaccine Info Percent of short-stay residents assessed and appropriately given the pneumococcal vaccine 12.7%
85% worse than Michigan average

Michigan average: 82.5%

Antipsychotic medication increase Info Percent of short-stay residents who newly received an antipsychotic medication 1.9%
34% worse than Michigan average

Michigan average: 1.4%

Influenza Vaccine Info Percent of short-stay residents assessed and appropriately given the seasonal influenza vaccine 17.7%
78% worse than Michigan average

Michigan average: 79.5%

Re-hospitalized after SNF stay Info Percentage of short-stay residents who were re-hospitalized after their nursing home admission. 13.7%
43% better than Michigan average

Michigan average: 24.2%

Emergency department visits Info Percentage of short-stay residents who had an outpatient emergency department visit. 10.7%
7% better than Michigan average

Michigan average: 11.5%

Falls with major injury Info Percentage of SNF residents who experience falls with major injury during their stay. 0.0%
100% better than Michigan average

Michigan average: 0.8%

Ability to care for self at discharge Info Percentage of residents at or above expected ability to care for themselves at discharge. 56.3%
5% better than Michigan average

Michigan average: 53.7%

Successful return to home or community Info Rate of successful return to home or community from a skilled nursing facility. 31.0%
39% worse than Michigan average

Michigan average: 50.6%

Penalties and fines

Federal penalties imposed by CMS for regulatory violations, including civil money penalties (fines) and denials of payment for new Medicare/Medicaid admissions.

Source: CMS Penalties Database (Data as of Jan 2026)

Total fines amount $0
100% lower than Michigan average

Michigan average: $76K

Number of fines 0
100% fewer fines than Michigan average

Michigan average: 2.0

Payment Denials Info Serious action where Medicare and/or Medicaid temporarily stops payments for new residents until issues are fixed. 2
137% more payment denials than Michigan average

Michigan average: 0.8

Fines amount comparison
This facility $0
Michigan average $76K
Penalty History

Penalties are imposed by CMS for violations of federal nursing home regulations.

Payment Denial Info Serious action where Medicare and/or Medicaid temporarily stops payments for new residents until issues are fixed. Apr 24, 2024
6 days
Payment Denial Info Serious action where Medicare and/or Medicaid temporarily stops payments for new residents until issues are fixed. Nov 1, 2023
25 days

Last updated: Jan 2026

Guides for Better Senior Living

Care Cost Calculator: See Prices in Your Area

Nursing Home Data Explorer

Don’t Wait Too Long: 7 Red Flag Signs Your Parent Needs Assisted Living Now

The True Cost of Assisted Living in 2025 – And How Families Are Paying For It

Understanding Senior Living Costs: Pricing Models, Discounts & Financial Assistance

Financial Aid for Michigan Seniors

Get financial aid guidance

MI Choice Waiver

Michigan Medicaid MI Choice Waiver

Age 65+ or disabled, Michigan resident, Medicaid- eligible, nursing home-level care need.

~$2,829/month (300% FBR, individual).

$2,000 (individual), $3,000 (couple).

Delivered through regional waiver agents; waitlists possible.

Home Help Program

Michigan Home Help

Age 65+ or disabled, Michigan resident, Medicaid- eligible or low-income.

~$1,732/month (individual, Medicaid threshold).

$2,000 (individual).

Can hire family caregivers; less intensive than waiver.

Program of All-Inclusive Care for the Elderly (PACE)

Michigan PACE

Age 55+, Michigan resident, nursing home-level care need, safe with PACE support.

~$2,829/month (Medicaid-eligible); private pay option available.

$2,000 (individual), $3,000 (couple).

16 PACE centers (e.g., Ingham, Wayne counties); expanding slowly.

Medicare Savings Program (MSP)

Michigan Medicare Savings Program

Age 65+ or disabled, Michigan resident, Medicare Part A/B.

~$2,510/month (QMB), ~$3,380/month (SLMB), ~$3,598/month (QI)—individual.

$9,430 (individual), $14,130 (couple).

Three tiers; no waitlist; includes Extra Help for Part D.

National Family Caregiver Support Program (NFCSP) Respite

Michigan NFCSP Respite Care

Caregivers of 60+ needing care or 55+ caregivers of others; Michigan resident; functional needs (2+ ADLs).

Prioritizes ~$24,980/year (individual); no strict cap.

Not assessed; need-based.

16 AAAs; prioritizes low-income, rural caregivers.

Senior Community Service Employment Program (SCSEP)

Michigan SCSEP

Age 55+, unemployed, low-income, Michigan resident.

~$1,983/month (125% FPL).

Not specified; income-focused.

Priority for veterans, rural residents; Operation ABLE partnership.

VA Aid and Attendance (A&A) and Housebound Benefits

Michigan VA Aid and Attendance/Housebound

Age 65+ or disabled veteran/spouse, Michigan resident, wartime service, need for ADL help (A&A) or homebound.

Net income < ~$1,984/month (veteran with dependent, A&A); pension offsets income.

~$155,356 (net worth limit).

High veteran demand in urban/rural areas.

Tour Icon
Planning a tour? Check our touring checklist.
Chat Icon
Thinking of living here? We can help you speak to a current resident