Heritage Manor
Nursing Home & Assisted Living · Detroit, MI
CMS overall rating Info CMS (the Centers for Medicare & Medicaid Services) is the federal agency that rates nursing home quality. Its Overall Rating runs from 1 to 5 stars, combining health inspections, staffing, and quality measures, with inspections weighted most heavily.

Heritage Manor

Nursing Home & Assisted Living · Detroit, MI
CMS overall rating Info CMS (the Centers for Medicare & Medicaid Services) is the federal agency that rates nursing home quality. Its Overall Rating runs from 1 to 5 stars, combining health inspections, staffing, and quality measures, with inspections weighted most heavily.
Calculator: See prices in your area
Heritage Manor accepts Medicare, Medicaid, and private pay.

Overview of Heritage Manor

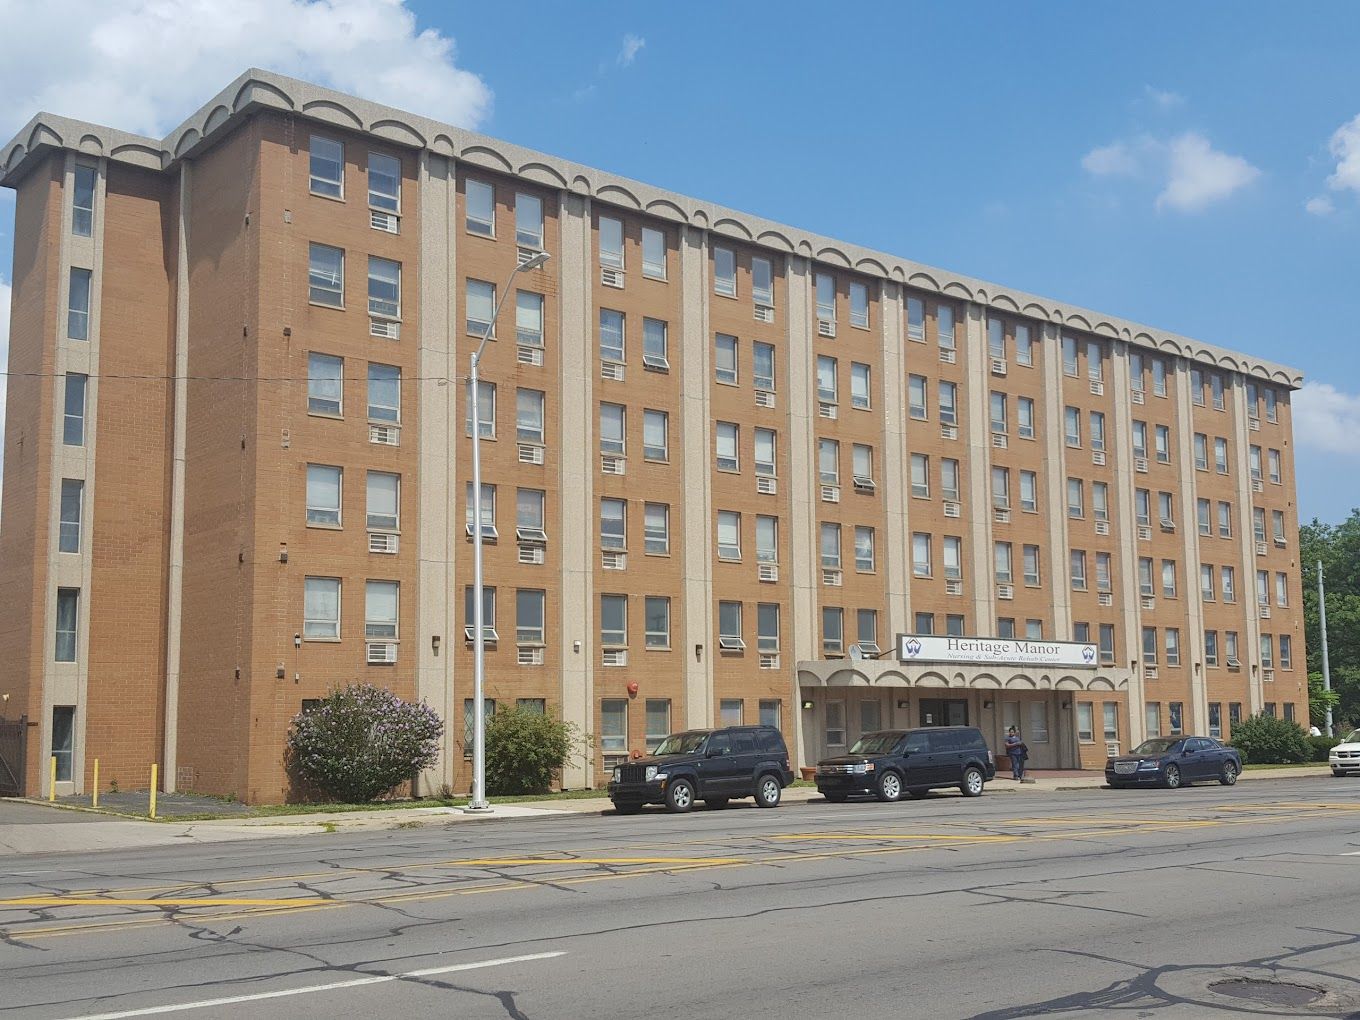
Heritage Manor is a nursing home in Detroit, MI, offering long-term care and short-term rehabilitation. Promoting a supportive and welcoming environment, the community ensures older adults are well-cared for. 24-hour care, household services, and well-balanced meals are also provided to improve residents’ living experiences. The community also works closely with residents to meet their ever-changing needs and preferences.

Light exercises, fun gatherings, and recreational activities encourage residents to make friends and have fun. Accessible amenities and spacious common areas also ensure residents can rest and move around safely. Situated near highways and bus stops in the tree-lined neighborhood of Detroit, the community guarantees accessibility and convenience. This nursing home has dedicated services and top-notch amenities, making it a good option for senior living in Michigan.

(626) 573-3141

Quality ratings

Measured by Centers for Medicare & Medicaid Services (CMS)

Overall rating Info The Overall CMS Rating combines results from health inspections, staffing levels and quality measures. Health inspections carry the most weight. Staffing and quality scores can increase or decrease the final rating based on performance compared to state and national standards.
▼ 68.1% Below MI avg. ▼ 68.1% Below MI avg.MI average: 3.1Click the badge to see the full State ranking.Click here to see the full State ranking.
Health Inspection Info Based on the results of the facility's three most recent standard inspections and any complaint investigations. CMS reviews the number, scope, and severity of deficiencies, with more recent findings weighted more heavily.
▼ 64.6% Below MI avg. ▼ 64.6% Below MI avg.MI average: 2.8Click the badge to see the full State ranking.Click here to see the full State ranking.
Staffing Info Measures average nursing staff hours per resident per day, including Registered Nurses (RNs) and total nursing staff. Ratings are adjusted based on the level of care residents require and are compared to state and national benchmarks.
▼ 14.2% Below MI avg. ▼ 14.2% Below MI avg.MI average: 3.5Click the badge to see the full State ranking.Click here to see the full State ranking.
Quality Measures Info Based on clinical and physical health indicators reported to CMS, such as hospital readmissions, falls, pressure ulcers, and improvements in mobility. These measures reflect how well residents' health needs are being managed.
▲ 6.4% Above MI avg. ▲ 6.4% Above MI avg.MI average: 3.8Click the badge to see the full State ranking.Click here to see the full State ranking.

Staffing hours breakdown

Info Daily nursing hours per resident by staff type, reported to CMS. Higher is generally better — compare this facility to state and national averages to see where staffing stands.

Hours per resident per day — compared to Michigan state averages

Total nursing care / resident Info This home is ranked 54th out of 142 homes in Michigan for nurse hours. Total adjusted nursing hours per resident per day, combining RN, LPN, and aide time. CMS adjusts this for case-mix so facilities can be fairly compared.
4h 12m per day
Rank #54 / 142Nurse hours — State benchmarkedThis home is ranked 54th out of 142 homes in Michigan. Shows adjusted nurse hours per resident per day benchmarked to the Michigan average, with a ranking across 142 Michigan facilities. More hours mean more direct care. The national average is about 3.5 hrs; below 3.0 is a red flag.Rankings are based only on facilities in Michigan that report data for that category. Facilities without available data are excluded from the ranking.Click the rank badge to see the full State ranking.Click here to see the full State ranking.
This facility Michigan avg (4h 18m per day)
vs Michigan avg
-2%

5 of 6 metrics below state avg

Standout metric LPN / LVN is +18% above state avg
Staff typeHours / Day / Residentvs state avg
Registered Nurse (RN) Info RNs hold the highest nursing license and can assess residents, interpret test results, and direct care plans. More RN hours per day often signals stronger clinical oversight and faster response to health changes. 21m per day ▼ 55% State avg: 46m per day · National avg: 41m per day
LPN / LVN Info Licensed Practical Nurses (LPNs) or Licensed Vocational Nurses (LVNs) deliver routine hands-on care — medication administration, wound dressing, and monitoring vital signs. They work under RN supervision and make up a large share of daily bedside care. 1h 3m per day ▲ 18% State avg: 53m per day · National avg: 52m per day
Nurse Aide Info Certified Nurse Aides (CNAs) provide the most direct day-to-day assistance: bathing, dressing, feeding, and mobility. Nurse aide hours are typically the largest staffing category and directly affect residents' quality of life. 2h 5m per day ▼ 13% State avg: 2h 23m per day · National avg: 2h 21m per day
Weekend Total Nursing Info Combined nursing hours (RN + LPN + Nurse Aide) per resident per day on weekends. Staffing often drops on weekends — this figure reveals whether the facility maintains adequate coverage outside of weekday hours. 2h 58m per day ▼ 15% State avg: 3h 31m per day · National avg: 3h 26m per day
Physical Therapist Info Hours per resident per day provided by licensed Physical Therapists (PTs) or PT Assistants. PT services help residents recover mobility after injury or illness and are especially important for post-acute (short-stay) rehabilitation. 2m per day ▼ 56% State avg: 4m per day · National avg: 4m per day
Weekend RN Info Registered nurse hours specifically on weekends. Facilities sometimes reduce RN presence on Saturdays and Sundays — a low weekend RN figure compared to weekday hours can indicate reduced clinical oversight when most administrative staff are absent. 10m per day ▼ 66% State avg: 29m per day · National avg: 29m per day

Capacity and availability

This home usually has limited availability

Higher occupancy than the Michigan average: 75.8%
Occupancy rate
90.3% Rank #30 / 395Occupancy rate — State benchmarkedThis home is ranked 30th out of 395 homes in Michigan. Shows this facility's occupancy rate versus the Michigan average, with its Statewide rank out of 395. Higher occupancy signals strong local demand and financial stability.Rankings are based only on facilities in Michigan that report data for that category. Facilities without available data are excluded from the ranking.Click the rank badge to see the full State ranking.Click here to see the full State ranking.
Avg. Length of Stay
129 days
Bed community size
122-bed community Rank #72 / 435Bed count — State benchmarkedThis home is ranked 72nd out of 435 homes in Michigan. Shows this facility's certified or reported bed count compared to other Michigan facilities. Larger communities may offer more amenities, programs, and on-site services for residents and families.Rankings are based only on facilities in Michigan that report data for that category. Facilities without available data are excluded from the ranking.Click the rank badge to see the full State ranking.Click here to see the full State ranking.
A larger shared setting that may offer more common spaces and organized community services.
Walk Score
Walk Score: 61 / 100 Rank #125 / 703Walk Score — State benchmarkedThis home is ranked 125th out of 703 homes in Michigan. Shows how walkable this facility's neighborhood is compared to the average Walk Score across Michigan facilities. Higher scores benefit residents, families, and staff.Rankings are based only on facilities in Michigan that report data for that category. Facilities without available data are excluded from the ranking.Click the rank badge to see the full State ranking.Click here to see the full State ranking.
Moderately walkable. Some errands can be accomplished on foot, with a mix of nearby amenities.

Safety & Compliance

Emergency SystemsIntercom systems for immediate assistance.
Safety FeaturesSprinkler system throughout the home.

Staffing & Medical

2 services
Licensed Nurses/CNAs
24-Hour Staffing

Amenities & Lifestyle

ActivitiesActivities include birthday celebrations, and live music.
Specific Programs24-Hour Qualified Staff, Scheduled Meals, Special Diets Available, Medication Supervision and Dispensing, Nourishing Snacks and Beverages, Activities including Birthday celebrations, Movie Night, Walking Day, Craft Projects, Day Trips, Spring Flower Planting, Bingo, Sunday Brunch, Spa Day, Holiday Parties, Live Music.

Dining & Nutrition

Food DescriptionScheduled meals and nourishing snacks and beverages are always available.

Contact Heritage Manor

Staffing Data

Reporting period: October 1 – December 31, 2025 (Q4 2025). Source: CMS Payroll-Based Journal report.

Total staff 142
Employees 125
Contractors 17
Staff to resident ratio 1.42 : 1
16% fewer staff per resident than Michigan average
Michigan average ratio: 1.70 : 1 Michigan average ratio: 1.70 : 1See full Michigan ranking
Avg staff/day 59
Average shift 7.9 hours
0% compared with Michigan average
Michigan average: 7.9 hours Michigan average shift: 7.9 hoursSee full Michigan ranking
Total staff hours (quarter) 43,020

Nursing staff breakdown

Q4 2025 · Oct 1 – Dec 31 More info This data comes from the CMS Payroll-Based Journal report covering October 1 – December 31, 2025.
Registered Nurse

Manages medical care and health needs.

RN Staff Info All 6 RN Staff are full-time employees. No contractors work on this role. 6
Average shift length Info Average shift length. Calculated as total hours divided by days worked and average staff per day. 8.7 hours
Licensed Practical Nurse

Assists with medical care and medications.

LPN Staff Info All 26 LPN Staff are full-time employees. No contractors work on this role. 26
Average shift length Info Average shift length. Calculated as total hours divided by days worked and average staff per day. 8.9 hours
Certified Nursing Assistant

Helps with daily care and mobility.

CNA Staff Info All 61 CNA Staff are full-time employees. No contractors work on this role. 61
Average shift length Info Average shift length. Calculated as total hours divided by days worked and average staff per day. 8.7 hours

Contractor staffing

Q4 2025 · Oct 1 – Dec 31 More info This data comes from the CMS Payroll-Based Journal report covering October 1 – December 31, 2025.

Total hours from contractors

4.1%

1,767 contractor hours this quarter

Feeding Assistant: 4 Qualified Social Worker: 3 Physical Therapy Assistant: 3 Physical Therapy Aide: 2 Respiratory Therapy Technician: 2 Speech Language Pathologist: 2 Medical Director: 1

Staff by category

Q4 2025 · Oct 1 – Dec 31 More info This data comes from the CMS Payroll-Based Journal report covering October 1 – December 31, 2025.
Certified Nursing Assistant6106118,64192100%8.7
Licensed Practical Nurse260268,53192100%8.9
Physical Therapist150154,69092100%6.6
Registered Nurse6062,53892100%8.7
RN Director of Nursing4041,3806874%7.8
Other Dietary Services Staff3031,30992100%7.7
Nurse Aide in Training3031,1517480%9.8
Dental Services Staff2029016672%7.5
Administrator1015286672%8
Nurse Practitioner1015286672%8
Dietitian1015286672%8
Physical Therapy Aide0224526975%6.4
Speech Language Pathologist0223876773%5.8
Feeding Assistant0443157683%3
Occupational Therapy Aide1012803538%8
Respiratory Therapy Technician0222766267%4.4
Clinical Nurse Specialist1012483134%8
Qualified Social Worker0331976065%3.3
Physical Therapy Assistant0331385358%2.6
Medical Director011211%2
61 Certified Nursing Assistant
% of Days 100%
26 Licensed Practical Nurse
% of Days 100%
15 Physical Therapist
% of Days 100%
6 Registered Nurse
% of Days 100%
4 RN Director of Nursing
% of Days 74%
3 Other Dietary Services Staff
% of Days 100%
3 Nurse Aide in Training
% of Days 80%
2 Dental Services Staff
% of Days 72%
1 Administrator
% of Days 72%
1 Nurse Practitioner
% of Days 72%
1 Dietitian
% of Days 72%
2 Physical Therapy Aide
% of Days 75%
2 Speech Language Pathologist
% of Days 73%
4 Feeding Assistant
% of Days 83%
1 Occupational Therapy Aide
% of Days 38%
2 Respiratory Therapy Technician
% of Days 67%
1 Clinical Nurse Specialist
% of Days 34%
3 Qualified Social Worker
% of Days 65%
3 Physical Therapy Assistant
% of Days 58%
1 Medical Director
% of Days 1%

Penalties and fines

Includes penalties issued in 2023-2024

Federal penalties imposed by CMS for regulatory violations, including civil money penalties (fines) and denials of payment for new Medicare/Medicaid admissions.

Source: CMS Penalties Database (Data as of Jan 2026)

Total fines amount $0 Rank #1 / 145Federal fines — State benchmarkedThis home is ranked 1st out of 145 homes in Michigan. Shows this facility's cumulative CMS federal fine dollars versus the Michigan average among facilities with fines, and where it ranks among 145 facilities in the pool. Lower total dollars mean a better rank.Rankings are based only on facilities in Michigan that report data for that category. Facilities without available data are excluded from the ranking.Click the rank badge to see the full State ranking.Click here to see the full State ranking.
100% lower than Michigan average

Michigan average: $76K

Number of fines 0
100% fewer fines than Michigan average

Michigan average: 2.0

Payment Denials Info Serious action where Medicare and/or Medicaid temporarily stops payments for new residents until issues are fixed. 2
137% more payment denials than Michigan average

Michigan average: 0.8

Fines amount comparison
This facility $0
Michigan average $76K
Penalty History

Penalties are imposed by CMS for violations of federal nursing home regulations.

2 penalties in the past 3 years

Multiple penalties were reported in the last 3 years.

Payment Denial Info Serious action where Medicare and/or Medicaid temporarily stops payments for new residents until issues are fixed. Apr 24, 2024
6 days
Payment Denial Info Serious action where Medicare and/or Medicaid temporarily stops payments for new residents until issues are fixed. Nov 1, 2023
25 days

Last updated: Jan 2026

Quality of care over time

These measures show how residents usually do over time at this home, based on health outcomes and preventive care.

High-risk clinical events score Info A composite score based on pressure ulcers, falls with injury, weight loss, walking ability decline, and activities of daily living decline. 7.2
15% better than Michigan average

Michigan average: 8.4

Functional decline score Info A composite score based on activities of daily living decline, walking ability decline, and incontinence. 9.6
41% better than Michigan average

Michigan average: 16.3

Long-stay resident measures
Above average Michigan avg: 4.1 Info CMS star rating based on long-stay quality measure performance. 5 stars = significantly above average, 1 star = significantly below average.
Need for Help with Daily Activities Increased Info Percent of long-stay residents whose need for help with daily activities has increased 10.2%
18% better than Michigan average

Michigan average: 12.5%

Walking Ability Worsened Info Percent of long-stay residents whose ability to move independently worsened 8.5%
45% better than Michigan average

Michigan average: 15.3%

Low Risk Residents with Bowel/Bladder Incontinence Info Percent of low risk long-stay residents who lose control of their bowels or bladder 10.0%
52% better than Michigan average

Michigan average: 21.0%

Falls with Major Injury Info Percent of long-stay residents experiencing one or more falls with major injury 2.6%
19% better than Michigan average

Michigan average: 3.2%

High Risk Residents with Pressure Ulcers Info Percent of long-stay high risk residents with pressure ulcers 9.1%
58% worse than Michigan average

Michigan average: 5.7%

Urinary Tract Infection Info Percent of long-stay residents with a urinary tract infection 0.3%
83% better than Michigan average

Michigan average: 1.7%

Lost Too Much Weight Info Percent of long-stay residents who lose too much weight 5.5%
In line with Michigan average

Michigan average: 5.7%

Depressive Symptoms Info Percent of long-stay residents who have depressive symptoms 0.0%
100% better than Michigan average

Michigan average: 3.9%

Antipsychotic Use Info Percent of long-stay residents who received an antipsychotic medication 17.8%
19% worse than Michigan average

Michigan average: 15.0%

Pneumococcal Vaccine Info Percent of long-stay residents assessed and appropriately given the pneumococcal vaccine 49.7%
48% worse than Michigan average

Michigan average: 94.9%

Influenza Vaccine Info Percent of long-stay residents assessed and appropriately given the seasonal influenza vaccine 76.8%
19% worse than Michigan average

Michigan average: 95.0%

Hospitalizations per 1,000 days Info Number of hospitalizations per 1,000 long-stay resident days. 1.78
In line with Michigan average

Michigan average: 1.74

ED visits per 1,000 days Info Number of outpatient emergency department visits per 1,000 long-stay resident days. 1.76
14% worse than Michigan average

Michigan average: 1.54

Short-stay resident measures
Average Michigan avg: 3.3 Info CMS star rating based on short-stay quality measure performance. 5 stars = much above average, 1 star = much below average.
Pneumococcal Vaccine Info Percent of short-stay residents assessed and appropriately given the pneumococcal vaccine 12.7%
85% worse than Michigan average

Michigan average: 82.5%

Antipsychotic medication increase Info Percent of short-stay residents who newly received an antipsychotic medication 1.9%
34% worse than Michigan average

Michigan average: 1.4%

Influenza Vaccine Info Percent of short-stay residents assessed and appropriately given the seasonal influenza vaccine 17.7%
78% worse than Michigan average

Michigan average: 79.5%

Re-hospitalized after SNF stay Info Percentage of short-stay residents who were re-hospitalized after their nursing home admission. 13.7%
43% better than Michigan average

Michigan average: 24.2%

Emergency department visits Info Percentage of short-stay residents who had an outpatient emergency department visit. 10.7%
7% better than Michigan average

Michigan average: 11.5%

Falls with major injury Info Percentage of SNF residents who experience falls with major injury during their stay. 0.0%
100% better than Michigan average

Michigan average: 0.8%

Ability to care for self at discharge Info Percentage of residents at or above expected ability to care for themselves at discharge. 56.3%
5% better than Michigan average

Michigan average: 53.7%

Successful return to home or community Info Rate of successful return to home or community from a skilled nursing facility. 31.0%
39% worse than Michigan average

Michigan average: 50.6%

Breakdown by payment type

Medicare

28% of new residents, usually for short-term rehab.

Typical stay 2 - 3 months

Private pay

68% of new residents, often for short stays.

Typical stay 5 - 6 months

Medicaid

4% of new residents, often for long-term daily care.

Typical stay 2 years

Facility Characteristics

Source: CMS Long-Term Care Facility Characteristics (Data as of Jan 2026)

Total residents 100
Medicare
7
7% of residents
Medicaid
87
87% of residents
Private pay or other
6
6% of residents
Programs & Services
Residents Group

Residents meet regularly to discuss policies, care quality, and activities

Active Resident Council

Organized group of residents that meets regularly to discuss facility policies, quality of life, and activities.

Finances and operations

Based on CMS SNF Cost Report for fiscal year ending in 12/2023.

Voluntary non-profit community
Operated by a church.
Net patient revenue Info Net patient revenue — what the home actually collects for resident care, after contractual allowances, bad debt and discounts are subtracted from its gross charges (CMS cost report, Worksheet G-3). It covers resident care only; money the home earns from other sources is shown separately as "Other income."
$11.9M
Net patient income Info Net patient income: net patient revenue minus the home's total operating expenses. A positive figure means it earns more from resident care than it spends to deliver it; a negative figure means the opposite. It excludes non-operating "other income."
-$636.1K
Voluntary non-profit community Operated by a church.
Net patient revenue Info Net patient revenue — what the home actually collects for resident care, after contractual allowances, bad debt and discounts are subtracted from its gross charges (CMS cost report, Worksheet G-3). It covers resident care only; money the home earns from other sources is shown separately as "Other income."
$11.9M Rank #86 / 143Revenue — State benchmarkedThis home is ranked 86th out of 143 homes in Michigan. Shows this facility's annual revenue compared to the Michigan average. Higher revenue generally means more resources for staffing and capital — read alongside Payroll %.Rankings are based only on facilities in Michigan that report data for that category. Facilities without available data are excluded from the ranking.Click the rank badge to see the full State ranking.Click here to see the full State ranking.
Net patient income Info Net patient income: net patient revenue minus the home's total operating expenses. A positive figure means it earns more from resident care than it spends to deliver it; a negative figure means the opposite. It excludes non-operating "other income."
-$636.1K
Other income Info Money the home earns outside of resident care — such as investments, grants, rentals and other non-operating sources (CMS cost report, Worksheet G-3). It is tracked separately from net patient revenue: it is not part of that figure, and it is not included in net patient income.
$648.2K
Payroll costs Info Staff salaries plus wage-related costs — benefits such as payroll taxes, health insurance and retirement — from the home's own accounting records (CMS cost report, Worksheet A). Contract or agency labor is counted separately, under other operating costs. Rank #49 / 143Payroll — State benchmarkedThis home is ranked 49th out of 143 homes in Michigan. Shows total annual staff payroll benchmarked to the Michigan average. Higher payroll investment relative to peers often signals better staffing and less reliance on cheaper contract labor.Rankings are based only on facilities in Michigan that report data for that category. Facilities without available data are excluded from the ranking.Click the rank badge to see the full State ranking.Click here to see the full State ranking.
$7.3M 61.2% of net patient revenue Info Payroll as a share of revenue: staff salaries and wage-related benefits divided by net patient revenue. A higher figure means more of each revenue dollar goes to staff pay. Rank #16 / 143Payroll % — State benchmarkedThis home is ranked 16th out of 143 homes in Michigan. Shows payroll as a percentage of revenue versus the Michigan average. Well-run Michigan facilities typically land around 49–59% — the top third Statewide. Below 25% may signal understaffing or heavy agency use — read with Staffing ratings.Rankings are based only on facilities in Michigan that report data for that category. Facilities without available data are excluded from the ranking.Click the rank badge to see the full State ranking.Click here to see the full State ranking.
Other operating costs Info Everything it costs to run the home apart from payroll — food, utilities, supplies, maintenance, contract labor and administration. Calculated as total operating expense minus payroll (staff salaries and wage-related benefits).
$5.2M
Total costs Info The home's total operating expense for the year — all the costs of running it, salaries included (CMS cost report, Worksheet G-3).
$12.5M

What does this home offer?

Building type icon
Building type icon

Building Type: Mid-rise

Who this home usually serves

TYPE OF STAY

Primarily short stays

Residents typically stay for brief periods, with frequent admissions and discharges throughout the year.

Most new residents arrive under private pay (68% of admissions), and a typical private pay stay runs around 5 - 6 months.

Admissions
288 total

Coverage residents most often arrive under.

Medicare 28%
Private pay 68%
Medicaid 4%
Discharges
312 total

Coverage residents most often leave under.

Medicare 19%
Private pay 52%
Medicaid 28%

Places of interest near Heritage Manor

Address 6.6 miles from city center Info Estimated distance in miles from Detroit's city center to Heritage Manor's address, calculated via Google Maps. — 2.53 miles to nearest hospital (Henry Ford Hospital)

Calculate Travel Distance to Heritage Manor

Add your location

Address

Compare Assisted Living around Detroit

The information below is reported by the Michigan Department of Licensing and Regulatory Affairs (LARA).

Heritage Manor
AL
NH
Detroit (Nardin Park) -
122
Facility 122
MI AVG 75
Rank #72 / 435
-
61
Facility 61
MI AVG 39
Rank #125 / 703
-
Allegria Village
AL
IL
MC
NH
Dearborn -
132
Facility 132
MI AVG 75
Rank #55 / 435
D-
52
Facility 52
MI AVG 39
Rank #201 / 703
Studio / 1 Bed / 2 Bed
The Orchards at Northwest
AL
MC
NH
RC
Detroit (Hubbell-Puritan) -
154
Facility 154
MI AVG 75
Rank #29 / 435
-
51
Facility 51
MI AVG 39
Rank #208 / 703
Private / Semi-Private Rooms

Financial Assistance for
Assisted Living in Michigan

Heritage Manor is located in Detroit, Michigan.
Here are the financial assistance programs available to residents in Michigan.

Get Financial aid guidance

MI Choice Waiver

Michigan Medicaid MI Choice Waiver

Age 65+ or disabled
General Michigan resident, Medicaid- eligible, nursing home-level care need.
Income Limits (2025) ~$2,829/month 300% FBR, individual
Asset Limits $2,000 (individual), $3,000 (couple).
MI

Delivered through regional waiver agents; waitlists possible.

Benefits
Personal care (5-7 hours/day) Respite care (240 hours/year) Home modifications ($1,500 avg.) Adult day care ($65/day)

Home Help Program

Michigan Home Help

Age 65+ or disabled
General Michigan resident, Medicaid- eligible or low-income.
Income Limits ~$1,732/month individual, Medicaid threshold
Asset Limits $2,000 individual
MI

Can hire family caregivers; less intensive than waiver.

Benefits
Personal care (up to 60 hours/month) Homemaker services Respite (varies)

Program of All-Inclusive Care for the Elderly (PACE)

Michigan PACE

Age 55+
General Michigan resident, nursing home-level care need, safe with PACE support.
Income Limits (2025) ~$2,829/month (Medicaid-eligible); private pay option available.
Asset Limits $2,000 (individual), $3,000 (couple).
MI

16 PACE centers (e.g., Ingham, Wayne counties); expanding slowly.

Benefits
Personal care (5-7 hours/day) Medical care Meals Transportation Therapy Respite

Medicare Savings Program (MSP)

Michigan Medicare Savings Program

Age 65+ or disabled
General Michigan resident, Medicare Part A/B.
Income Limits (2025) ~$2,510/month (QMB), ~$3,380/month (SLMB), ~$3,598/month (QI)—individual.
Asset Limits $9,430 (individual), $14,130 (couple).
MI

Three tiers; no waitlist; includes Extra Help for Part D.

Benefits
Covers Part B premiums ($174.70/month) Deductibles ($240/year) Copays (~20%)

National Family Caregiver Support Program (NFCSP) Respite

Michigan NFCSP Respite Care

Age
General Caregivers of 60+ needing care or 55+ caregivers of others; Michigan resident; functional needs (2+ ADLs).
Income Limits (2025) Prioritizes ~$24,980/year (individual); no strict cap.
Asset Limits Not assessed; need-based.
MI

16 AAAs; prioritizes low-income, rural caregivers.

Benefits
Respite (4-6 hours/week or 5 days/year) Adult day care ($60/day) Caregiver training

VA Aid and Attendance (A&A) and Housebound Benefits

Michigan VA Aid and Attendance/Housebound

Age 65+ or disabled veteran/spouse
General Michigan resident, wartime service, need for ADL help (A&A) or homebound.
Income Limits (2025) Net income < ~$1,984/month (veteran with dependent, A&A); pension offsets income.
Asset Limits ~$155,356 net worth limit
MI

High veteran demand in urban/rural areas.

Benefits
Cash (~$1,433-$2,642/month veteran, ~$951-$1,318 spouse) for care costs

Frequently Asked Questions about Heritage Manor

What neighborhood is Heritage Manor in?

Heritage Manor is in the Nardin Park neighborhood.

Is Heritage Manor in a walkable area?

Heritage Manor has a walk score of 61. Moderately walkable. Some errands can be accomplished on foot, with a mix of nearby amenities.

What is the occupancy rate at Heritage Manor?

Heritage Manor's occupancy is 90.3%.

Are there photos of Heritage Manor?

Yes — there are 3 photos of Heritage Manor in the photo gallery on this page.

What is the address of Heritage Manor?

Heritage Manor is located at 9500 Grand River Ave, Detroit, MI 48204.

What is the phone number of Heritage Manor?

(626) 573-3141 will put you in contact with the team at Heritage Manor.

Is Heritage Manor Medicare or Medicaid certified?

Yes — Heritage Manor is a CMS-certified provider of Medicare and Medicaid.

Guides for Better Senior Living

Care Cost Calculator: See Prices in Your Area

Nursing Home Data Explorer

Don’t Wait Too Long: 7 Red Flag Signs Your Parent Needs Assisted Living Now

The True Cost of Assisted Living in 2025 – And How Families Are Paying For It

Understanding Senior Living Costs: Pricing Models, Discounts & Financial Assistance