


Total staff
147
Employees
128
Contractors
19
We arrange tours, appointments, and even moving support so you don’t have to


 The Overall CMS Rating is scored from 1 to 5 stars and combines results from health inspections, staffing levels, and quality measures. Health inspections carry the most weight. Staffing and quality scores can increase or decrease the final rating based on performance compared to state and national standards.
 The Overall CMS Rating is scored from 1 to 5 stars and combines results from health inspections, staffing levels, and quality measures. Health inspections carry the most weight. Staffing and quality scores can increase or decrease the final rating based on performance compared to state and national standards.
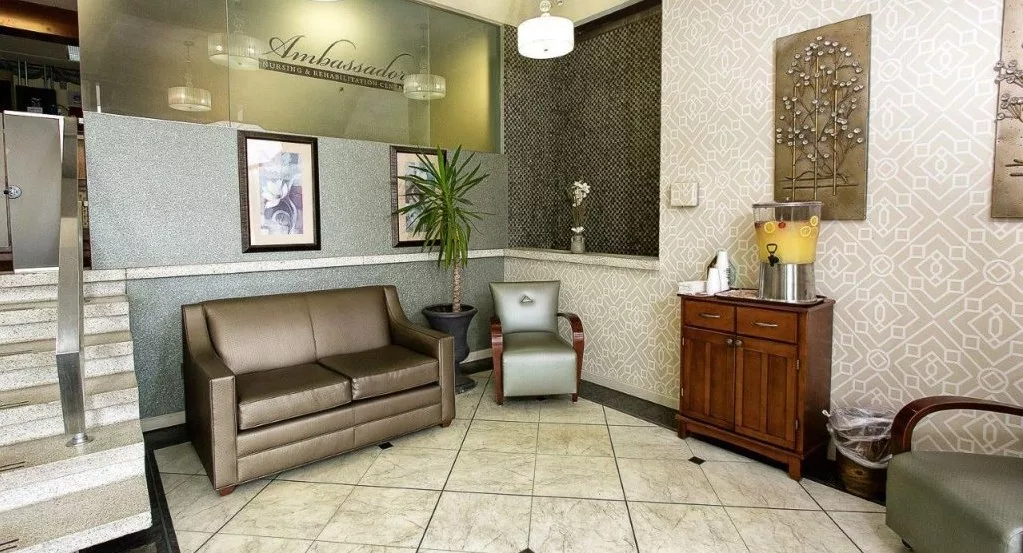
Nestled in a prime location with easy access to all the urban amenities, Ambassador Nursing and Rehabilitation Center boasts an array of services focused on providing comprehensive care that addresses all aspects of their well-being. From IV services to nutritional support, respiratory care to in-house diagnostics, and pain management to wound care, Ambassador ensures that patients receive the highest standard from a dedicated team of professionals. Ambassador is also committed to inclusivity, with a bilingual staff fluent in English and Spanish, ensuring effective communication and personalized care for native Spanish speakers.
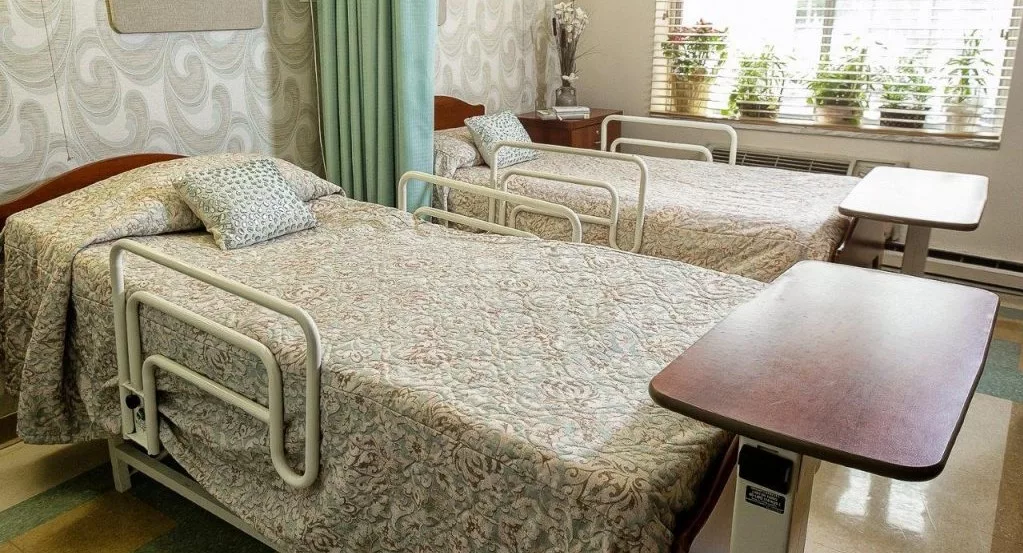
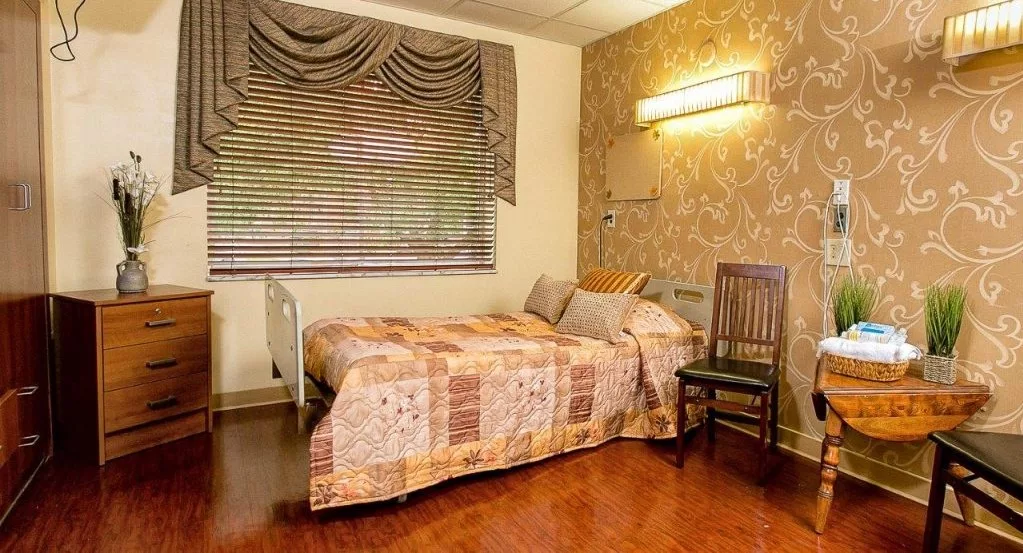
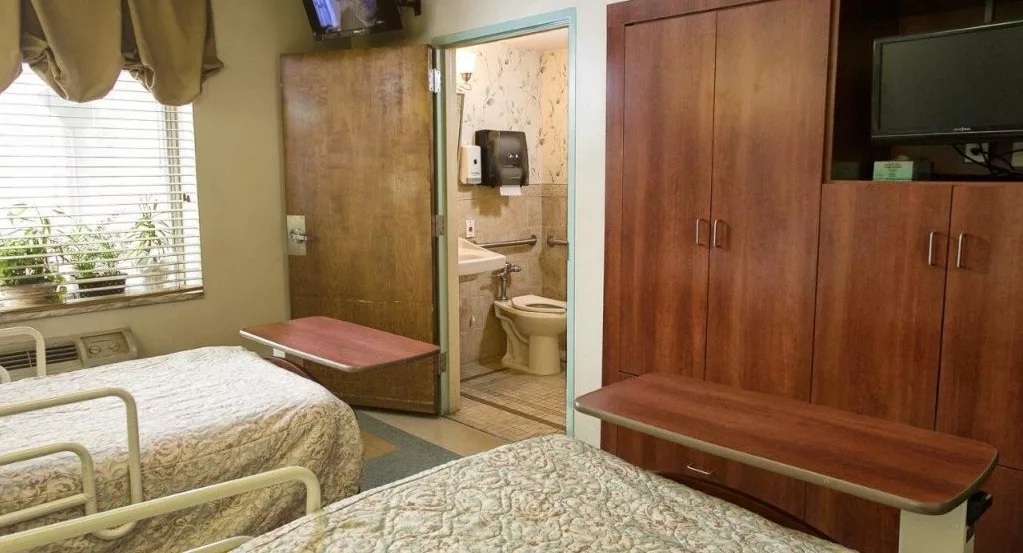
With 190 nursing beds, Ambassador can provide care to a diverse range of patients, offering a safe and supportive environment for their recovery and rehabilitation. The home also recognizes the importance of addressing the spiritual needs of patients, offering Christian and Catholic services to provide comfort and support during their stay. The friendly and compassionate staff at Ambassador create a warm and welcoming environment where patients feel at ease, and the multidisciplinary team works collaboratively to develop personalized care plans that meet the needs of each resident.
The Overall CMS Rating combines results from health inspections, staffing levels and quality measures. Health inspections carry the most weight. Staffing and quality scores can increase or decrease the final rating based on performance compared to state and national standards.
Based on the results of the facility's three most recent standard inspections and any complaint investigations. CMS reviews the number, scope, and severity of deficiencies, with more recent findings weighted more heavily.
Measures average nursing staff hours per resident per day, including Registered Nurses (RNs) and total nursing staff. Ratings are adjusted based on the level of care residents require and are compared to state and national benchmarks.
Based on clinical and physical health indicators reported to CMS, such as hospital readmissions, falls, pressure ulcers, and improvements in mobility. These measures reflect how well residents' health needs are being managed.
Daily nursing hours per resident by staff type, reported to CMS. Higher is generally better — compare this facility to state and national averages to see where staffing stands.
This home is ranked 147th out of 167 homes in Illinois. Total adjusted nursing hours per resident per day, combining RN, LPN, and aide time. CMS adjusts this for case-mix so facilities can be fairly compared.
| Staff type | Hours / Day / Resident | vs state avg |
|---|---|---|
|
Registered Nurse (RN)
RNs hold the highest nursing license and can assess residents, interpret test results, and direct care plans. More RN hours per day often signals stronger clinical oversight and faster response to health changes.
| 36m per day | ▼ 18% State avg: 44m per day · National avg: 41m per day |
|
LPN / LVN
Licensed Practical Nurses (LPNs) or Licensed Vocational Nurses (LVNs) deliver routine hands-on care — medication administration, wound dressing, and monitoring vital signs. They work under RN supervision and make up a large share of daily bedside care.
| 34m per day | ▼ 11% State avg: 38m per day · National avg: 52m per day |
|
Nurse Aide
Certified Nurse Aides (CNAs) provide the most direct day-to-day assistance: bathing, dressing, feeding, and mobility. Nurse aide hours are typically the largest staffing category and directly affect residents' quality of life.
| 1h 38m per day | ▼ 23% State avg: 2h 8m per day · National avg: 2h 21m per day |
|
Weekend Total Nursing
Combined nursing hours (RN + LPN + Nurse Aide) per resident per day on weekends. Staffing often drops on weekends — this figure reveals whether the facility maintains adequate coverage outside of weekday hours.
| 2h 42m per day | ▼ 12% State avg: 3h 5m per day · National avg: 3h 26m per day |
|
Physical Therapist
Hours per resident per day provided by licensed Physical Therapists (PTs) or PT Assistants. PT services help residents recover mobility after injury or illness and are especially important for post-acute (short-stay) rehabilitation.
| 1m per day | ▼ 67% State avg: 3m per day · National avg: 4m per day |
|
Weekend RN
Registered nurse hours specifically on weekends. Facilities sometimes reduce RN presence on Saturdays and Sundays — a low weekend RN figure compared to weekday hours can indicate reduced clinical oversight when most administrative staff are absent.
| 30m per day | ▼ 12% State avg: 34m per day · National avg: 29m per day |

Reporting period: October 1 – December 31, 2025 (Q4 2025). Source: CMS Payroll-Based Journal report.
 41% worse than Illinois average
 0% compared with Illinois average
This data comes from the CMS Payroll-Based Journal report covering October 1 – December 31, 2025.
0% compared with Illinois average
This data comes from the CMS Payroll-Based Journal report covering October 1 – December 31, 2025.
Manages medical care and health needs.
20 total: 19 full-time employees and 1 contractor.
20
Average shift length. Calculated as total hours divided by days worked and average staff per day.
8.3 hoursAssists with medical care and medications.
All 21 LPN Staff are full-time employees. No contractors work on this role.
21
Average shift length. Calculated as total hours divided by days worked and average staff per day.
8.9 hoursHelps with daily care and mobility.
67 total: 66 full-time employees and 1 contractor.
67
Average shift length. Calculated as total hours divided by days worked and average staff per day.
7.5 hours
This data comes from the CMS Payroll-Based Journal report covering October 1 – December 31, 2025.
Total hours from contractors
2,056 contractor hours this quarter
This data comes from the CMS Payroll-Based Journal report covering October 1 – December 31, 2025.
| Certified Nursing Assistant | 66 | 1 | 67 | 24,145 | 92 | 100% | 7.5 |
| Registered Nurse | 19 | 1 | 20 | 8,574 | 92 | 100% | 8.3 |
| Licensed Practical Nurse | 21 | 0 | 21 | 7,755 | 92 | 100% | 8.9 |
| Other Dietary Services Staff | 11 | 0 | 11 | 3,140 | 92 | 100% | 6.8 |
| Mental Health Service Worker | 3 | 0 | 3 | 1,095 | 68 | 74% | 8 |
| Other Social Services Staff | 2 | 0 | 2 | 902 | 68 | 74% | 7.5 |
| Clinical Nurse Specialist | 2 | 0 | 2 | 840 | 83 | 90% | 5.9 |
| Physical Therapy Assistant | 0 | 2 | 2 | 598 | 84 | 91% | 6.3 |
| Speech Language Pathologist | 0 | 4 | 4 | 533 | 81 | 88% | 5.5 |
| Nurse Practitioner | 1 | 0 | 1 | 512 | 65 | 71% | 7.9 |
| Dietitian | 1 | 0 | 1 | 486 | 59 | 64% | 8.2 |
| Respiratory Therapy Technician | 0 | 3 | 3 | 469 | 63 | 68% | 7.4 |
| RN Director of Nursing | 1 | 0 | 1 | 439 | 54 | 59% | 8.1 |
| Administrator | 1 | 0 | 1 | 429 | 53 | 58% | 8.1 |
| Physical Therapy Aide | 0 | 4 | 4 | 292 | 49 | 53% | 5.1 |
| Therapeutic Recreation Specialist | 0 | 1 | 1 | 65 | 14 | 15% | 4.7 |
| Medical Director | 0 | 1 | 1 | 30 | 7 | 8% | 4.3 |
| Occupational Therapy Assistant | 0 | 1 | 1 | 30 | 6 | 7% | 5 |
| Qualified Social Worker | 0 | 1 | 1 | 24 | 21 | 23% | 1.1 |
Includes penalties issued in 2024-2025
Federal penalties imposed by CMS for regulatory violations, including civil money penalties (fines) and denials of payment for new Medicare/Medicaid admissions.
Source: CMS Penalties Database (Data as of Jan 2026)
 100% lower than Illinois average
Illinois average: $143K
100% fewer fines than Illinois averageIllinois average: 3.0
Serious action where Medicare and/or Medicaid temporarily stops payments for new residents until issues are fixed.
2
89% more payment denials than Illinois averageIllinois average: 1.1
Penalties are imposed by CMS for violations of federal nursing home regulations.
2 penalties in the past 3 years
Multiple penalties were reported in the last 3 years.
Serious action where Medicare and/or Medicaid temporarily stops payments for new residents until issues are fixed.
Jul 21, 2025
Serious action where Medicare and/or Medicaid temporarily stops payments for new residents until issues are fixed.
Jul 12, 2024Last updated: Jan 2026
These measures show how residents usually do over time at this home, based on health outcomes and preventive care.
A composite score based on pressure ulcers, falls with injury, weight loss, walking ability decline, and activities of daily living decline.
6.0
39% better than Illinois averageIllinois average: 9.7
A composite score based on activities of daily living decline, walking ability decline, and incontinence.
11.5
38% better than Illinois averageIllinois average: 18.6
CMS star rating based on long-stay quality measure performance. 5 stars = significantly above average, 1 star = significantly below average.
Percent of long-stay residents whose need for help with daily activities has increased
7.4%
52% better than Illinois averageIllinois average: 15.5%
Percent of long-stay residents whose ability to move independently worsened
10.0%
46% better than Illinois averageIllinois average: 18.4%
Percent of low risk long-stay residents who lose control of their bowels or bladder
17.1%
21% better than Illinois averageIllinois average: 21.6%
Percent of long-stay residents experiencing one or more falls with major injury
1.9%
43% better than Illinois averageIllinois average: 3.4%
Percent of long-stay high risk residents with pressure ulcers
4.4%
17% better than Illinois averageIllinois average: 5.3%
Percent of long-stay residents with a urinary tract infection
1.4%
22% better than Illinois averageIllinois average: 1.8%
Percent of long-stay residents who lose too much weight
6.1%
7% better than Illinois averageIllinois average: 6.5%
Percent of long-stay residents who have depressive symptoms
95.7%
99% worse than Illinois averageIllinois average: 48.1%
Percent of long-stay residents who received an antipsychotic medication
21.1%
In line with Illinois averageIllinois average: 20.2%
Percent of long-stay residents assessed and appropriately given the pneumococcal vaccine
95.1%
7% better than Illinois averageIllinois average: 89.2%
Percent of long-stay residents assessed and appropriately given the seasonal influenza vaccine
94.2%
In line with Illinois averageIllinois average: 91.6%
Number of hospitalizations per 1,000 long-stay resident days.
1.92
6% better than Illinois averageIllinois average: 2.05
Number of outpatient emergency department visits per 1,000 long-stay resident days.
2.19
In line with Illinois averageIllinois average: 2.25
CMS star rating based on short-stay quality measure performance. 5 stars = much above average, 1 star = much below average.
Percent of short-stay residents assessed and appropriately given the pneumococcal vaccine
43.5%
36% worse than Illinois averageIllinois average: 68.3%
Percent of short-stay residents who newly received an antipsychotic medication
5.7%
143% worse than Illinois averageIllinois average: 2.3%
Percent of short-stay residents assessed and appropriately given the seasonal influenza vaccine
51.6%
18% worse than Illinois averageIllinois average: 63.0%
Percentage of short-stay residents who were re-hospitalized after their nursing home admission.
21.7%
17% better than Illinois averageIllinois average: 26.2%
Percentage of short-stay residents who had an outpatient emergency department visit.
8.3%
41% better than Illinois averageIllinois average: 14.0%
Percentage of SNF residents who experience falls with major injury during their stay.
4.1%
430% worse than Illinois averageIllinois average: 0.8%
Percentage of residents at or above expected ability to care for themselves at discharge.
57.7%
7% better than Illinois averageIllinois average: 53.7%
Quality measures are calculated from Minimum Data Set (MDS) assessments. For most measures, lower percentages indicate better care quality.
17% of new residents, usually for short-term rehab.
6% of new residents, often for short stays.
77% of new residents, often for long-term daily care.
Source: CMS Long-Term Care Facility Characteristics (Data as of Jan 2026)
 Total residents
139
Total residents
139Residents meet regularly to discuss policies, care quality, and activities
Organized group of residents that meets regularly to discuss facility policies, quality of life, and activities.
Data sourced from CMS Long-Term Care Facility Characteristics quarterly report. Payer mix reflects the current resident census by primary payment source.
Historical financial and operational data for Ambassador Nursing and Rehabilitation Center based on CMS SNF Cost Reports.
The portion of the home's budget spent on staff, including nurses, caregivers, and other employees who support care and operations.
Rank #56 / 166Payroll — State benchmarkedThis home is ranked 56th out of 166 homes in Illinois. Shows total annual staff payroll benchmarked to the Illinois average. Higher payroll investment relative to peers often signals better staffing and less reliance on cheaper contract labor.Click the rank badge to see the full State ranking.Click here to see the full State ranking.
All remaining costs needed to run the home, such as food, utilities, building maintenance, supplies and administrative expenses.
Most residents stay for extended periods and receive ongoing daily care.
 7.4 miles from city center
Estimated distance in miles from Chicago's city center to Ambassador Nursing and Rehabilitation Center's address, calculated via Google Maps.
— 4.72 miles to nearest hospital (Ascension Saint Joseph - Chicago)
7.4 miles from city center
Estimated distance in miles from Chicago's city center to Ambassador Nursing and Rehabilitation Center's address, calculated via Google Maps.
— 4.72 miles to nearest hospital (Ascension Saint Joseph - Chicago)
Add your location
Ambassador Nursing and Rehabilitation Center is located in Chicago, Illinois.
Here are the financial assistance programs available to residents in Illinois.

The information below is reported by the Illinois Department of Public Health, Office of Health Care Regulation.
| The Clare |
NH Nursing Home Licensed facility providing 24/7 skilled nursing care for residents with complex, ongoing medical needs. Staffed by RNs, LPNs, and CNAs. Inspected and star-rated annually by CMS. Accepts Medicare (short-term rehab) and Medicaid (long-term care).
AL Assisted Living A licensed, long-term care setting for seniors or individuals with disabilities who need help with daily activities — like bathing, dressing, and medication management — but not 24-hour skilled nursing. Offers housing, meals, and around-the-clock support while aiming to maximize resident independence.
IL Independent Living Lifestyle-focused communities for older adults offering dining, activities, and transportation with minimal personal care. Best for active, independent seniors who want community without medical support.
MC Memory Care Secured, specialized care for people living with Alzheimer's or dementia. Staff trained in cognitive impairment, with higher staff-to-resident ratios and an environment designed to reduce confusion and wandering risk. | Chicago (Rush & Division) | 49 | 91.7% | +32% | 3.69 | +61% | +19% | $0 | 13 | 2.6 | 1 | 46 | A+ | 100 | County Of Fulton | $5.2M | $3.6M | 68.5% | 146151 | ||||
| Norwood Crossing |
NH Nursing Home Licensed facility providing 24/7 skilled nursing care for residents with complex, ongoing medical needs. Staffed by RNs, LPNs, and CNAs. Inspected and star-rated annually by CMS. Accepts Medicare (short-term rehab) and Medicaid (long-term care).
AL Assisted Living A licensed, long-term care setting for seniors or individuals with disabilities who need help with daily activities — like bathing, dressing, and medication management — but not 24-hour skilled nursing. Offers housing, meals, and around-the-clock support while aiming to maximize resident independence.
MC Memory Care Secured, specialized care for people living with Alzheimer's or dementia. Staff trained in cognitive impairment, with higher staff-to-resident ratios and an environment designed to reduce confusion and wandering risk.
RC Respite Care Short-term temporary care — days to weeks — to give family caregivers a break. Full care provided during the stay. Often used after hospitalization or to trial a facility before a permanent placement decision. | Chicago (Norwood Park) | 55 | 89.1% | +29% | 3.86 | +74% | +24% | $78.4k | 29 | 4.8 | 2 | 113 | - | 83 | Norwood Crossing Association | $26.5M | $13.8M | 52% | 145974 | ||||
| Admiral at the Lake |
NH Nursing Home Licensed facility providing 24/7 skilled nursing care for residents with complex, ongoing medical needs. Staffed by RNs, LPNs, and CNAs. Inspected and star-rated annually by CMS. Accepts Medicare (short-term rehab) and Medicaid (long-term care).
AL Assisted Living A licensed, long-term care setting for seniors or individuals with disabilities who need help with daily activities — like bathing, dressing, and medication management — but not 24-hour skilled nursing. Offers housing, meals, and around-the-clock support while aiming to maximize resident independence.
IL Independent Living Lifestyle-focused communities for older adults offering dining, activities, and transportation with minimal personal care. Best for active, independent seniors who want community without medical support.
MC Memory Care Secured, specialized care for people living with Alzheimer's or dementia. Staff trained in cognitive impairment, with higher staff-to-resident ratios and an environment designed to reduce confusion and wandering risk. | Chicago (Uptown) | 56 | 88.6% | +28% | 4.93 | -22% | +59% | $0 | 26 | 5.2 | 1 | 27 | A+ | 90 | Nadia Geigler | $25.6M | $11.0M | 42.8% | 146165 | ||||
| Encore Village of Schaumburg |
NH Nursing Home Licensed facility providing 24/7 skilled nursing care for residents with complex, ongoing medical needs. Staffed by RNs, LPNs, and CNAs. Inspected and star-rated annually by CMS. Accepts Medicare (short-term rehab) and Medicaid (long-term care).
AL Assisted Living A licensed, long-term care setting for seniors or individuals with disabilities who need help with daily activities — like bathing, dressing, and medication management — but not 24-hour skilled nursing. Offers housing, meals, and around-the-clock support while aiming to maximize resident independence.
IL Independent Living Lifestyle-focused communities for older adults offering dining, activities, and transportation with minimal personal care. Best for active, independent seniors who want community without medical support.
MC Memory Care Secured, specialized care for people living with Alzheimer's or dementia. Staff trained in cognitive impairment, with higher staff-to-resident ratios and an environment designed to reduce confusion and wandering risk. | Schaumburg | 109 | - | - | 3.46 | +8% | +12% | $25.5k | 28 | 2.6 | 2 | 114 | A+ | 58 | Il Ccrc, LLC | $96.9M | $18.2M | 18.8% | 145341 | ||||
| Ambassador Nursing and Rehabilitation Center |
NH Nursing Home Licensed facility providing 24/7 skilled nursing care for residents with complex, ongoing medical needs. Staffed by RNs, LPNs, and CNAs. Inspected and star-rated annually by CMS. Accepts Medicare (short-term rehab) and Medicaid (long-term care).
AL Assisted Living A licensed, long-term care setting for seniors or individuals with disabilities who need help with daily activities — like bathing, dressing, and medication management — but not 24-hour skilled nursing. Offers housing, meals, and around-the-clock support while aiming to maximize resident independence. | Chicago (Albany Park) | 190 | - | - | 2.21 | -4% | -29% | $0 | 62 | 3.3 | 4 | 161 | - | 88 | B & N Realty Investment LLC | $15.1M | $9.0M | 59.3% | 145343 |
Ambassador Nursing and Rehabilitation Center is in the Albany Park neighborhood.
Ambassador Nursing and Rehabilitation Center has a walk score of 88. Very walkable. Most errands can be accomplished on foot, and many essentials are within a short walk.
Yes — there are 6 photos of Ambassador Nursing and Rehabilitation Center in the photo gallery on this page.
(773) 583-7130 will put you in contact with the team at Ambassador Nursing and Rehabilitation Center.
Yes — Ambassador Nursing and Rehabilitation Center is a CMS-certified provider of Medicare and Medicaid.
Care Cost Calculator: See Prices in Your Area
Nursing Home Data Explorer
Don’t Wait Too Long: 7 Red Flag Signs Your Parent Needs Assisted Living Now
The True Cost of Assisted Living in 2025 – And How Families Are Paying For It
Understanding Senior Living Costs: Pricing Models, Discounts & Financial Assistance



Thank you for your interest!
Our team will be in touch shortly to help with next steps.