Highland Village of Elko
Nursing Home, Assisted Living & Independent Living · Nevada, NV
CMS overall rating Info The Overall CMS Rating is scored from 1 to 5 stars and combines results from health inspections, staffing levels, and quality measures. Health inspections carry the most weight. Staffing and quality scores can increase or decrease the final rating based on performance compared to state and national standards.

Highland Village of Elko

Nursing Home, Assisted Living & Independent Living · Nevada, NV
CMS overall rating Info The Overall CMS Rating is scored from 1 to 5 stars and combines results from health inspections, staffing levels, and quality measures. Health inspections carry the most weight. Staffing and quality scores can increase or decrease the final rating based on performance compared to state and national standards.
Calculator: See prices in your area
Highland Village of Elko accepts Medicare, Medicaid, and private pay.

Overview of Highland Village of Elko

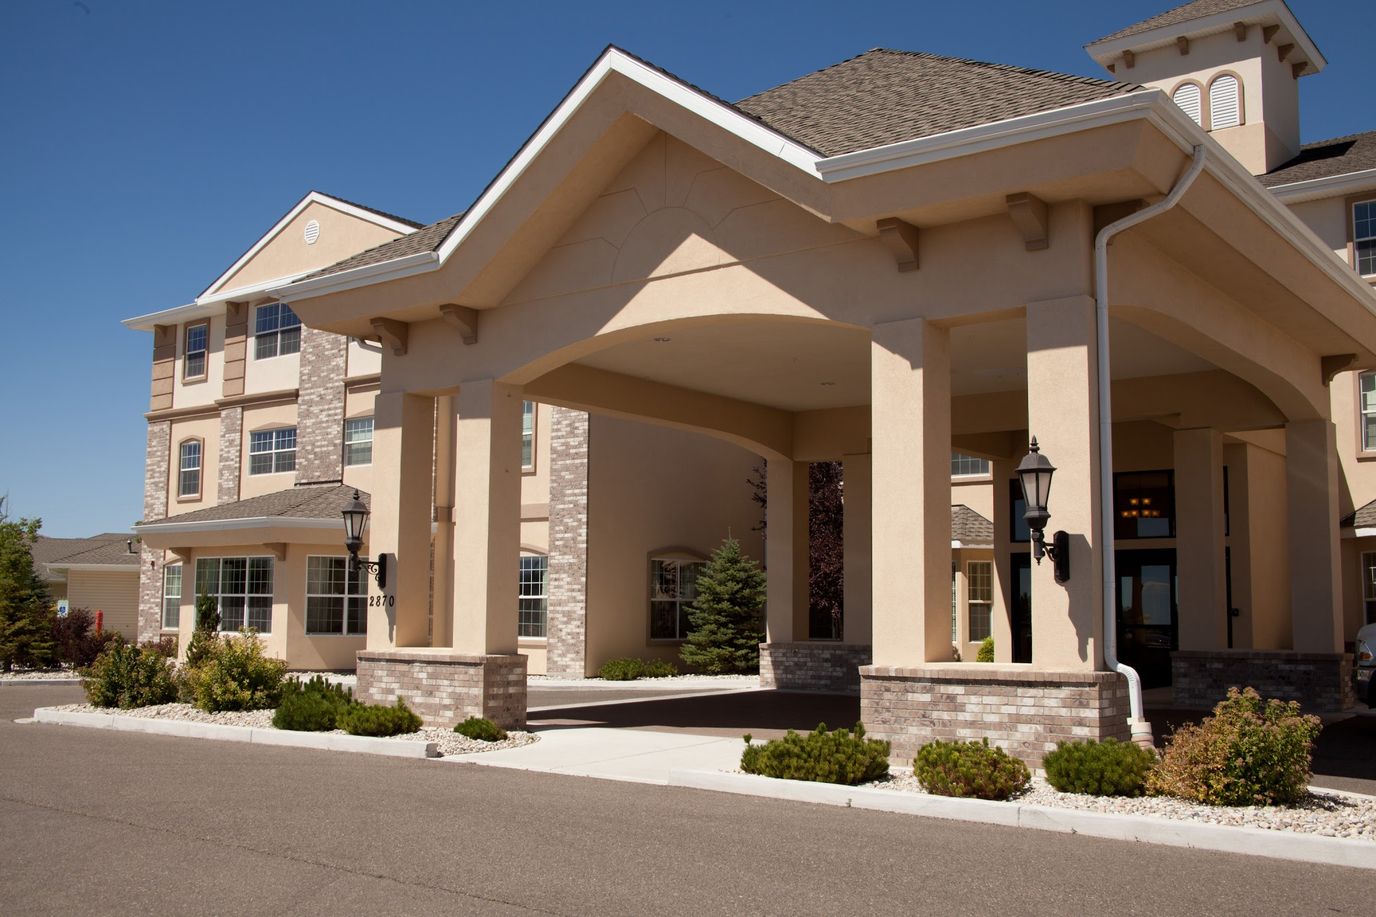
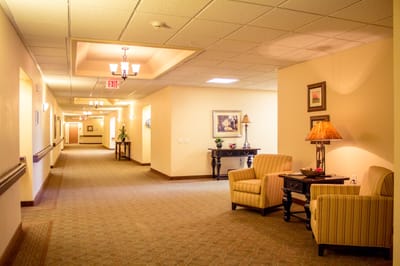
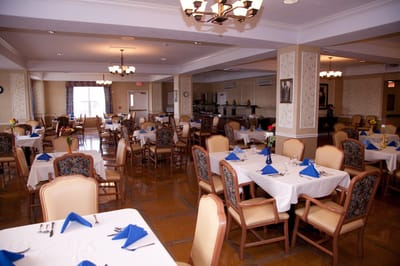
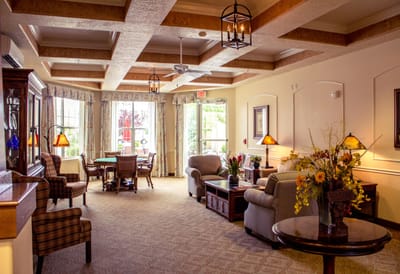
Highland Village of Elko is a not-for-profit retirement community in Elko, NV, that offers a wide range of care options, ranging from assisted living to skilled nursing. With exceptional support around the clock, residents are guaranteed to receive the utmost attention and care for their healthcare needs. Meal preparation and household services are also available, so residents can focus on themselves.

Here, residents are encouraged to live actively and connect with friends through a variety of recreational activities and wellness programs. Transportation services are also available, ensuring residents can travel to their appointments safely. Rehabilitation services and outpatient therapy are also available to help enhance residents’ living experiences. The community is ideal for those seeking comprehensive care to live comfortably in their later years.

(775) 753-5500

Quality ratings

Measured by Centers for Medicare & Medicaid Services (CMS)

Overall rating Info The Overall CMS Rating combines results from health inspections, staffing levels and quality measures. Health inspections carry the most weight. Staffing and quality scores can increase or decrease the final rating based on performance compared to state and national standards.
At NV avg. At NV avg.Click the badge to see the full State ranking.Click here to see the full State ranking.
Health Inspection Info Based on the results of the facility's three most recent standard inspections and any complaint investigations. CMS reviews the number, scope, and severity of deficiencies, with more recent findings weighted more heavily.
▼ 29.7% Below NV avg. ▼ 29.7% Below NV avg.Click the badge to see the full State ranking.Click here to see the full State ranking.
Staffing Info Measures average nursing staff hours per resident per day, including Registered Nurses (RNs) and total nursing staff. Ratings are adjusted based on the level of care residents require and are compared to state and national benchmarks.
▼ 3.5% Below NV avg. ▼ 3.5% Below NV avg.Click the badge to see the full State ranking.Click here to see the full State ranking.
Quality Measures Info Based on clinical and physical health indicators reported to CMS, such as hospital readmissions, falls, pressure ulcers, and improvements in mobility. These measures reflect how well residents' health needs are being managed.
▲ 37.9% Above NV avg. ▲ 37.9% Above NV avg.Click the badge to see the full State ranking.Click here to see the full State ranking.

Staffing hours breakdown

Info Daily nursing hours per resident by staff type, reported to CMS. Higher is generally better — compare this facility to state and national averages to see where staffing stands.

Hours per resident per day — compared to Nevada state averages

Total nursing care / resident Info This home is ranked 26th out of 33 homes in Nevada.

Total adjusted nursing hours per resident per day, combining RN, LPN, and aide time. CMS adjusts this for case-mix so facilities can be fairly compared.
3h 13m per day
Rank #26 / 33Nurse hours — State benchmarkedThis home is ranked 26th out of 33 homes in Nevada.Shows adjusted nurse hours per resident per day benchmarked to the Nevada average, with a ranking across 33 Nevada SNFs. More hours mean more direct care. The national average is about 3.5 hrs; below 3.0 is a red flag.Click the rank badge to see the full State ranking.Click here to see the full State ranking.
This facility Nevada avg (4h 2m per day)
vs Nevada avg
-20%

6 of 6 metrics below state avg

Staff typeHours / Day / Residentvs state avg
Registered Nurse (RN) Info RNs hold the highest nursing license and can assess residents, interpret test results, and direct care plans. More RN hours per day often signals stronger clinical oversight and faster response to health changes. 48m per day ▼ 25% State avg: 1h 4m per day · National avg: 41m per day
LPN / LVN Info Licensed Practical Nurses (LPNs) or Licensed Vocational Nurses (LVNs) deliver routine hands-on care — medication administration, wound dressing, and monitoring vital signs. They work under RN supervision and make up a large share of daily bedside care. 29m per day ▼ 46% State avg: 54m per day · National avg: 52m per day
Nurse Aide Info Certified Nurse Aides (CNAs) provide the most direct day-to-day assistance: bathing, dressing, feeding, and mobility. Nurse aide hours are typically the largest staffing category and directly affect residents' quality of life. 1h 47m per day ▼ 25% State avg: 2h 23m per day · National avg: 2h 21m per day
Total Nursing (Weekend) Info Combined nursing hours (RN + LPN + Nurse Aide) per resident per day on weekends. Staffing often drops on weekends — this figure reveals whether the facility maintains adequate coverage outside of weekday hours. 2h 52m per day ▼ 26% State avg: 3h 51m per day · National avg: 3h 26m per day
Physical Therapist Info Hours per resident per day provided by licensed Physical Therapists (PTs) or PT Assistants. PT services help residents recover mobility after injury or illness and are especially important for post-acute (short-stay) rehabilitation. 1m per day ▼ 80% State avg: 5m per day · National avg: 4m per day
RN (Weekend) Info Registered nurse hours specifically on weekends. Facilities sometimes reduce RN presence on Saturdays and Sundays — a low weekend RN figure compared to weekday hours can indicate reduced clinical oversight when most administrative staff are absent. 31m per day ▼ 39% State avg: 51m per day · National avg: 29m per day

Capacity and availability

This home usually has availability

Occupancy lower than 85% suggests more openings may be available.

Lower occupancy than the Nevada average: 81.5%
Occupancy rate 57% Rank #33 / 35Occupancy rate — State benchmarkedThis home is ranked 33rd out of 35 homes in Nevada.Shows this facility's occupancy rate versus the Nevada average, with its Statewide rank out of 35. Higher occupancy signals strong local demand and financial stability.Click the rank badge to see the full State ranking.Click here to see the full State ranking.
Avg. Length of Stay 192 days
Occupancy rate
57% Rank #33 / 35Occupancy rate — State benchmarkedThis home is ranked 33rd out of 35 homes in Nevada.Shows this facility's occupancy rate versus the Nevada average, with its Statewide rank out of 35. Higher occupancy signals strong local demand and financial stability.Click the rank badge to see the full State ranking.Click here to see the full State ranking.
Avg. Length of Stay
192 days

Who this home usually serves

TYPE OF STAY

Mostly short-term rehab stays

Most residents typically stay for a few weeks or months before returning home or moving on.

Breakdown by payment type

Medicare

78% of new residents, usually for short-term rehab.

Typical stay 27 days

Private pay

7% of new residents, often for short stays.

Typical stay 1 - 2 years

Medicaid

15% of new residents, often for long-term daily care.

Typical stay 2 years

Finances and operations

Voluntary non-profit community
Home revenue
$7.9M
Operating deficit
-$717.7K
Voluntary non-profit community
Home revenue
$7.9M Rank #32 / 35Revenue — State benchmarkedThis home is ranked 32nd out of 35 homes in Nevada.Shows this facility's annual revenue compared to the Nevada SNF average. Higher revenue generally means more resources for staffing and capital — read alongside Payroll %.Click the rank badge to see the full State ranking.Click here to see the full State ranking.
Operating deficit
-$717.7K
Payroll costs Info The portion of the home's budget spent on staff, including nurses, caregivers, and other employees who support care and operations. Rank #32 / 35Payroll — State benchmarkedThis home is ranked 32nd out of 35 homes in Nevada.Shows total annual staff payroll benchmarked to the Nevada average. Higher payroll investment relative to peers often signals better staffing and less reliance on cheaper contract labor.Click the rank badge to see the full State ranking.Click here to see the full State ranking.
$5.2M
66% of revenue Rank #4 / 35Payroll % — State benchmarkedThis home is ranked 4th out of 35 homes in Nevada.Shows payroll as a percentage of revenue versus the Nevada average. Well-run Nevada SNFs typically land around 47–60% — the top third Statewide. Below 25% may signal understaffing or heavy agency use — read with Staffing ratings.Click the rank badge to see the full State ranking.Click here to see the full State ranking.
Other operating costs Info All remaining costs needed to run the home, such as food, utilities, building maintenance, supplies and administrative expenses.
$3.4M
Total costs $8.6M
Walk Score
Walk Score: 14 / 100 Rank #33 / 35Walk Score — State benchmarkedThis home is ranked 33rd out of 35 homes in Nevada.Shows how walkable this facility's neighborhood is compared to the average Walk Score across Nevada SNFs. Higher scores benefit residents, families, and staff.Click the rank badge to see the full State ranking.Click here to see the full State ranking.
Car-dependent. Most errands require a car, with limited nearby walkable options.

What does this home offer?

Housing options icon

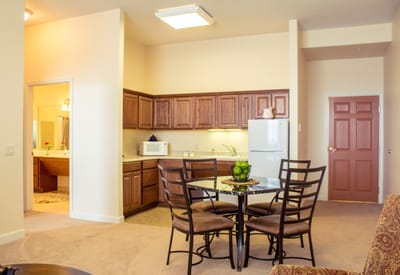
Housing Options: Private Suites

Dining services icon

Dining Services

Beauty services icon

Beauty Services

Housekeeping icon
Housekeeping icon

Housekeeping Services

Social and recreational activities icon

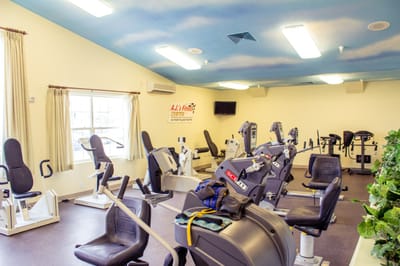
Social and Recreational Activities

Types of Care at Highland Village of Elko

Assisted Living Independent Living Nursing Home

Contact Highland Village of Elko

Health Inspection History

Inspections Since 2022
Total health inspections 3

Nevada average 5.1


Last Health inspection on Jul 2024

Total health citations
27 Rank #8 / 35Health citations — State benchmarkedThis home is ranked 8th out of 35 homes in Nevada.Shows this facility's total health deficiency citations benchmarked to the Nevada State average, with a ranking across all 35 NV SNFs. Lower citation counts earn a better rank.Click the rank badge to see the full State ranking.Click here to see the full State ranking.

Nevada average 36.2

Citations per inspection
9 Rank #27 / 35Citations per inspection — State benchmarkedThis home is ranked 27th out of 35 homes in Nevada.Shows average deficiency citations per CMS inspection for this facility versus the Nevada mean across 35 SNFs with citation data. Lower is better.Click the rank badge to see the full State ranking.Click here to see the full State ranking.

Nevada average 7.08


Health citations are formal notices following inspections when they fail to comply with safety and care standards.

26 of 27 citations resulted from standard inspections; and 1 of 27 came from combined inspections (standard and complaint).

Breakdown of citation severity (last 4 years)
Critical Health citations
0
100% better than Nevada average

Nevada average: 0.1


Serious Health citations
0
100% better than Nevada average

Nevada average: 0.5

0 critical citations Nevada average: 0.1

0 serious citations Nevada average: 0.5

25 moderate citations Nevada average: 35

2 minor citations Nevada average: 0.5
Citations history (last 4 years)
Abuse/Neglect moderate citation Jul 18, 2024
Corrected

Infection Control moderate citation Jul 18, 2024
Corrected

Infection Control moderate citation Jul 18, 2024
Corrected

Infection Control moderate citation Jul 18, 2024
Corrected

Financial Assistance for
Nursing Home in Nevada

Highland Village of Elko is located in Elko, Nevada.
Here are the financial assistance programs available to residents in Nevada.

Get Financial aid guidance

Home and Community Based Waiver

Nevada Medicaid HCBW

Age 65+ or disabled
General Nevada resident, Medicaid-eligible, nursing home-level care need.
Income Limits (2025) ~$2,829/month 300% FBR, individual
Asset Limits $2,000 (individual), $3,000 (couple).
NV

High urban demand (e.g., Las Vegas); rural challenges.

Benefits
Personal care (5-7 hours/day) Respite (240 hours/year) Home modifications ($1,500 avg.) Meals ($6/meal)

Nevada Senior Services Program

NV SSP

Age 60+
General Nevada resident, at risk of decline.
Income Limits ~$1,800/month individual, varies
Asset Limits $5,000 individual
NV

Limited funding; rural focus.

Benefits
In-home care (3-5 hours/week) Respite (up to 10 days/year) Transportation (~5 trips/month)

Personal Care Services (PCS)

Nevada Personal Care Services

Age 19+ (65+ for seniors focus)
General Nevada resident, Medicaid-eligible, needs help with 1+ ADL.
Income Limits (2025) ~$967/month (individual); spenddown allowed.
Asset Limits $2,000 (individual), $3,000 (couple).
NV

Self-directed (family can be paid); statewide via DHHS.

Benefits
Personal care (4-6 hours/day) Limited homemaker services Respite (~200 hours/year)

Senior Rx Program

Nevada Senior Rx Program

Age 65+
General Nevada resident, enrolled in Medicare Part D, income below limit.
Income Limits (2025) ~$2,510/month (individual), ~$3,380/month (couple).
Asset Limits Not assessed.
NV

Covers up to $38.75/month premium; funded by tobacco settlement.

Benefits
Prescription drug premium assistance (~$465/year) Reducing out-of-pocket costs

Medicare Savings Program (MSP)

Nevada Medicare Savings Program

Age 65+ or disabled
General Nevada resident, Medicare Part A/B.
Income Limits (2025) ~$2,510/month (QMB), ~$3,380/month (SLMB), ~$3,598/month (QI)—individual.
Asset Limits $9,430 (individual), $14,130 (couple).
NV

Three tiers; no waitlist; includes Extra Help for Part D.

Benefits
Covers Part B premiums ($174.70/month) Deductibles ($240/year) Copays (~20%)

Nevada Caregiver Support Program (via NFCSP)

Nevada Caregiver Support Program

Age
General Caregivers of 60+ needing care or 55+ caregivers of others; Nevada resident; functional needs (2+ ADLs).
Income Limits (2025) Prioritizes ~$24,980/year (individual); no strict cap.
Asset Limits Not assessed; need-based.
NV

5 AAAs; prioritizes rural, low-income caregivers.

Benefits
Respite (4-6 hours/week or 5 days/year) Adult day care ($60/day) Training Supplies (~$500/year)

VA Aid and Attendance (A&A) and Housebound Benefits

Nevada VA Aid and Attendance/Housebound

Age 65+ or disabled veteran/spouse
General Nevada resident, wartime service, need for ADL help (A&A) or homebound.
Income Limits (2025) Net income < ~$1,984/month (veteran with dependent, A&A); pension offsets income.
Asset Limits ~$155,356 net worth limit
NV

High veteran demand in urban/rural areas.

Benefits
Cash (~$1,433-$2,642/month veteran, ~$951-$1,318 spouse) for care costs (e.g., in-home, assisted living)

Places of interest near Highland Village of Elko

Address 1.6 miles from city center Info Estimated distance in miles from Elko's city center to Highland Village of Elko's address, calculated via Google Maps.

Calculate Travel Distance to Highland Village of Elko

Add your location

Address

Staffing Data

Reporting period: April 1 – June 30, 2025 (Q2 2025). Source: CMS Payroll-Based Journal report.

Total staff 89
Employees 80
Contractors 9
Staff to resident ratio 1.02:1
35% worse than Nevada average
Nevada average ratio: 1.57:1 Nevada average ratio: 1.57:1See full Nevada ranking
Avg staff/day 38
Average shift 8.2 hours
7% worse than Nevada average
Nevada average: 8.8 hours Nevada average shift: 8.8 hoursSee full Nevada ranking
Total staff hours (quarter) 28,337

Nursing staff breakdown

Q2 2025 · Apr 1 – Jun 30 More info This data comes from the CMS Payroll-Based Journal report covering April 1 – June 30, 2025.
Registered Nurse

Manages medical care and health needs.

Total count 14
Average shift length Info Average shift length. Calculated as total hours divided by days worked and average staff per day. 9.9 hours

No contractors work on this role.

Licensed Practical Nurse

Assists with medical care and medications.

Total count 7
Average shift length Info Average shift length. Calculated as total hours divided by days worked and average staff per day. 10.4 hours

No contractors work on this role.

Certified Nursing Assistant

Helps with daily care and mobility.

Total count 38
Average shift length Info Average shift length. Calculated as total hours divided by days worked and average staff per day. 8.9 hours

No contractors work on this role.

Contractor staffing

Q2 2025 · Apr 1 – Jun 30 More info This data comes from the CMS Payroll-Based Journal report covering April 1 – June 30, 2025.

Total hours from contractors

1.8%

521 contractor hours this quarter

Respiratory Therapy Technician: 2 Medical Director: 2 Physical Therapy Assistant: 1 Speech Language Pathologist: 1 Qualified Social Worker: 1 Physical Therapy Aide: 1 Occupational Therapy Assistant: 1

Staff by category

Q2 2025 · Apr 1 – Jun 30 More info This data comes from the CMS Payroll-Based Journal report covering April 1 – June 30, 2025.
Certified Nursing Assistant3803812,30991100%8.9
Registered Nurse140143,94791100%9.9
Licensed Practical Nurse7073,07991100%10.4
Nurse Aide in Training9092,53391100%8.6
Clinical Nurse Specialist3031,7577785%9.2
Dental Services Staff2021,1218897%8.8
Other Dietary Services Staff2029058695%7.9
Administrator2028507481%7.1
Mental Health Service Worker1015446066%9.1
Nurse Practitioner1015046369%8
Occupational Therapy Aide1012684651%5.8
Respiratory Therapy Technician0222025864%3.3
Physical Therapy Assistant011926167%1.5
Qualified Social Worker011766268%1.2
Speech Language Pathologist011586167%0.9
Physical Therapy Aide011466066%0.8
Medical Director022401213%2.1
Occupational Therapy Assistant011633%2
38 Certified Nursing Assistant
% of Days 100%
14 Registered Nurse
% of Days 100%
7 Licensed Practical Nurse
% of Days 100%
9 Nurse Aide in Training
% of Days 100%
3 Clinical Nurse Specialist
% of Days 85%
2 Dental Services Staff
% of Days 97%
2 Other Dietary Services Staff
% of Days 95%
2 Administrator
% of Days 81%
1 Mental Health Service Worker
% of Days 66%
1 Nurse Practitioner
% of Days 69%
1 Occupational Therapy Aide
% of Days 51%
2 Respiratory Therapy Technician
% of Days 64%
1 Physical Therapy Assistant
% of Days 67%
1 Qualified Social Worker
% of Days 68%
1 Speech Language Pathologist
% of Days 67%
1 Physical Therapy Aide
% of Days 66%
2 Medical Director
% of Days 13%
1 Occupational Therapy Assistant
% of Days 3%

Facility Characteristics

Source: CMS Long-Term Care Facility Characteristics (Data as of Jan 2026)

Total residents 87
Medicare
14
16.1% of residents
Medicaid
53
60.9% of residents
Private pay or other
20
23% of residents
Programs & Services
Residents Group

Residents meet regularly to discuss policies, care quality, and activities

Active Resident Council

Organized group of residents that meets regularly to discuss facility policies, quality of life, and activities.

Quality of care over time

These measures show how residents usually do over time at this home, based on health outcomes and preventive care.

High-risk clinical events score Info A composite score based on pressure ulcers, falls with injury, weight loss, walking ability decline, and activities of daily living decline. 13.1
35% worse than Nevada average

Nevada average: 9.7

Functional decline score Info A composite score based on activities of daily living decline, walking ability decline, and incontinence. 27.0
55% worse than Nevada average

Nevada average: 17.5

Long-stay resident measures
Average Nevada avg: 3.1 Info CMS star rating based on long-stay quality measure performance. 5 stars = significantly above average, 1 star = significantly below average.
Need for Help with Daily Activities Increased Info Percent of long-stay residents whose need for help with daily activities has increased 23.3%
49% worse than Nevada average

Nevada average: 15.6%

Walking Ability Worsened Info Percent of long-stay residents whose ability to move independently worsened 33.1%
59% worse than Nevada average

Nevada average: 20.8%

Low Risk Residents with Bowel/Bladder Incontinence Info Percent of low risk long-stay residents who lose control of their bowels or bladder 24.8%
46% worse than Nevada average

Nevada average: 16.9%

Falls with Major Injury Info Percent of long-stay residents experiencing one or more falls with major injury 3.2%
27% worse than Nevada average

Nevada average: 2.5%

High Risk Residents with Pressure Ulcers Info Percent of long-stay high risk residents with pressure ulcers 2.3%
59% better than Nevada average

Nevada average: 5.5%

Urinary Tract Infection Info Percent of long-stay residents with a urinary tract infection 1.1%
23% better than Nevada average

Nevada average: 1.4%

Lost Too Much Weight Info Percent of long-stay residents who lose too much weight 3.7%
33% better than Nevada average

Nevada average: 5.4%

Depressive Symptoms Info Percent of long-stay residents who have depressive symptoms 1.7%
60% better than Nevada average

Nevada average: 4.2%

Antipsychotic Use Info Percent of long-stay residents who received an antipsychotic medication 9.0%
36% better than Nevada average

Nevada average: 14.1%

Pneumococcal Vaccine Info Percent of long-stay residents assessed and appropriately given the pneumococcal vaccine 100.0%
10% better than Nevada average

Nevada average: 91.0%

Influenza Vaccine Info Percent of long-stay residents assessed and appropriately given the seasonal influenza vaccine 98.7%
10% better than Nevada average

Nevada average: 89.6%

Hospitalizations per 1,000 days Info Number of hospitalizations per 1,000 long-stay resident days. 1.44
21% better than Nevada average

Nevada average: 1.82

ED visits per 1,000 days Info Number of outpatient emergency department visits per 1,000 long-stay resident days. 2.77
85% worse than Nevada average

Nevada average: 1.50

Short-stay resident measures
Significantly above average Nevada avg: 3.1 Info CMS star rating based on short-stay quality measure performance. 5 stars = much above average, 1 star = much below average.
Pneumococcal Vaccine Info Percent of short-stay residents assessed and appropriately given the pneumococcal vaccine 96.5%
15% better than Nevada average

Nevada average: 83.9%

Antipsychotic medication increase Info Percent of short-stay residents who newly received an antipsychotic medication 0.6%
71% better than Nevada average

Nevada average: 2.0%

Influenza Vaccine Info Percent of short-stay residents assessed and appropriately given the seasonal influenza vaccine 91.0%
13% better than Nevada average

Nevada average: 80.7%

Re-hospitalized after SNF stay Info Percentage of short-stay residents who were re-hospitalized after their nursing home admission. 21.7%
7% better than Nevada average

Nevada average: 23.4%

Emergency department visits Info Percentage of short-stay residents who had an outpatient emergency department visit. 11.9%
21% worse than Nevada average

Nevada average: 9.8%

Falls with major injury Info Percentage of SNF residents who experience falls with major injury during their stay. 0.0%
100% better than Nevada average

Nevada average: 0.8%

Ability to care for self at discharge Info Percentage of residents at or above expected ability to care for themselves at discharge. 71.2%
33% better than Nevada average

Nevada average: 53.7%

Successful return to home or community Info Rate of successful return to home or community from a skilled nursing facility. 57.0%
13% better than Nevada average

Nevada average: 50.6%

Penalties and fines

Federal penalties imposed by CMS for regulatory violations, including civil money penalties (fines) and denials of payment for new Medicare/Medicaid admissions.

Source: CMS Penalties Database

No penalties in the past 3 years

No civil money penalties or payment denials were reported in the last 3 years.

Compare Nursing Home around Nevada

The information below is reported by the Nevada Department of Health and Human Services, Bureau of Health Care Quality and Compliance.

2 facilities compared · CMS & NV Dept. of Health data

Filter by care type
Highland Village of Elko
NH

Nursing Home Licensed facility providing 24/7 skilled nursing care for residents with complex, ongoing medical needs. Staffed by RNs, LPNs, and CNAs. Inspected and star-rated annually by CMS. Accepts Medicare (short-term rehab) and Medicaid (long-term care).

AL

Assisted Living A licensed, long-term care setting for seniors or individuals with disabilities who need help with daily activities — like bathing, dressing, and medication management — but not 24-hour skilled nursing. Offers housing, meals, and around-the-clock support while aiming to maximize resident independence.

IL

Independent Living Lifestyle-focused communities for older adults offering dining, activities, and transportation with minimal personal care. Best for active, independent seniors who want community without medical support.

Elko112 57.0% -30%3.22 +10%-20%$0279.0-83 14 Elko Health Care, LLC$7.9M$5.2M66%295078
Alpine Skilled Nursing and Rehabilitation Center
NH

Nursing Home Licensed facility providing 24/7 skilled nursing care for residents with complex, ongoing medical needs. Staffed by RNs, LPNs, and CNAs. Inspected and star-rated annually by CMS. Accepts Medicare (short-term rehab) and Medicaid (long-term care).

AL

Assisted Living A licensed, long-term care setting for seniors or individuals with disabilities who need help with daily activities — like bathing, dressing, and medication management — but not 24-hour skilled nursing. Offers housing, meals, and around-the-clock support while aiming to maximize resident independence.

Reno189 58.9% -28%3.07 -28%-24%$0496.12152 60 Gray Estate Holdings LLC$23.2M$8.1M34.8%295043

Guides for Better Senior Living

Care Cost Calculator: See Prices in Your Area

Nursing Home Data Explorer

Don’t Wait Too Long: 7 Red Flag Signs Your Parent Needs Assisted Living Now

The True Cost of Assisted Living in 2025 – And How Families Are Paying For It

Understanding Senior Living Costs: Pricing Models, Discounts & Financial Assistance

Frequently Asked Questions about Highland Village of Elko

What neighborhood is Highland Village of Elko in?

Highland Village of Elko is in the Elko neighborhood.

Is Highland Village of Elko in a walkable area?

Highland Village of Elko has a walk score of 14. Car-dependent. Most errands require a car, with limited nearby walkable options.

What is the address of Highland Village of Elko?

Highland Village of Elko is located at 2850 Ruby Vista Dr, Elko, NV 89801.

What is the phone number of Highland Village of Elko?

(775) 753-5500 will put you in contact with the team at Highland Village of Elko.

Is Highland Village of Elko Medicare or Medicaid certified?

Yes — Highland Village of Elko is a CMS-certified provider of Medicare and Medicaid.

Explore Open Rooms
1 Contact details
2 What type of senior care service are you looking for?
3 What budget do you have in mind for senior care?
4 How soon do you need to find care?
5 Additional details

Thank you for your interest!

Our team will be in touch shortly to help with next steps.