Highland Village of Fallon

Nursing Home, Assisted Living & Independent Living · Nevada, NV
CMS overall rating Info The Overall CMS Rating is scored from 1 to 5 stars and combines results from health inspections, staffing levels, and quality measures. Health inspections carry the most weight. Staffing and quality scores can increase or decrease the final rating based on performance compared to state and national standards.
Highland Village of Fallon
Nursing Home, Assisted Living & Independent Living · Nevada, NV
CMS overall rating Info The Overall CMS Rating is scored from 1 to 5 stars and combines results from health inspections, staffing levels, and quality measures. Health inspections carry the most weight. Staffing and quality scores can increase or decrease the final rating based on performance compared to state and national standards.
Calculator: See prices in your area
Highland Village of Fallon accepts Medicare, Medicaid, and private pay.

Overview of Highland Village of Fallon

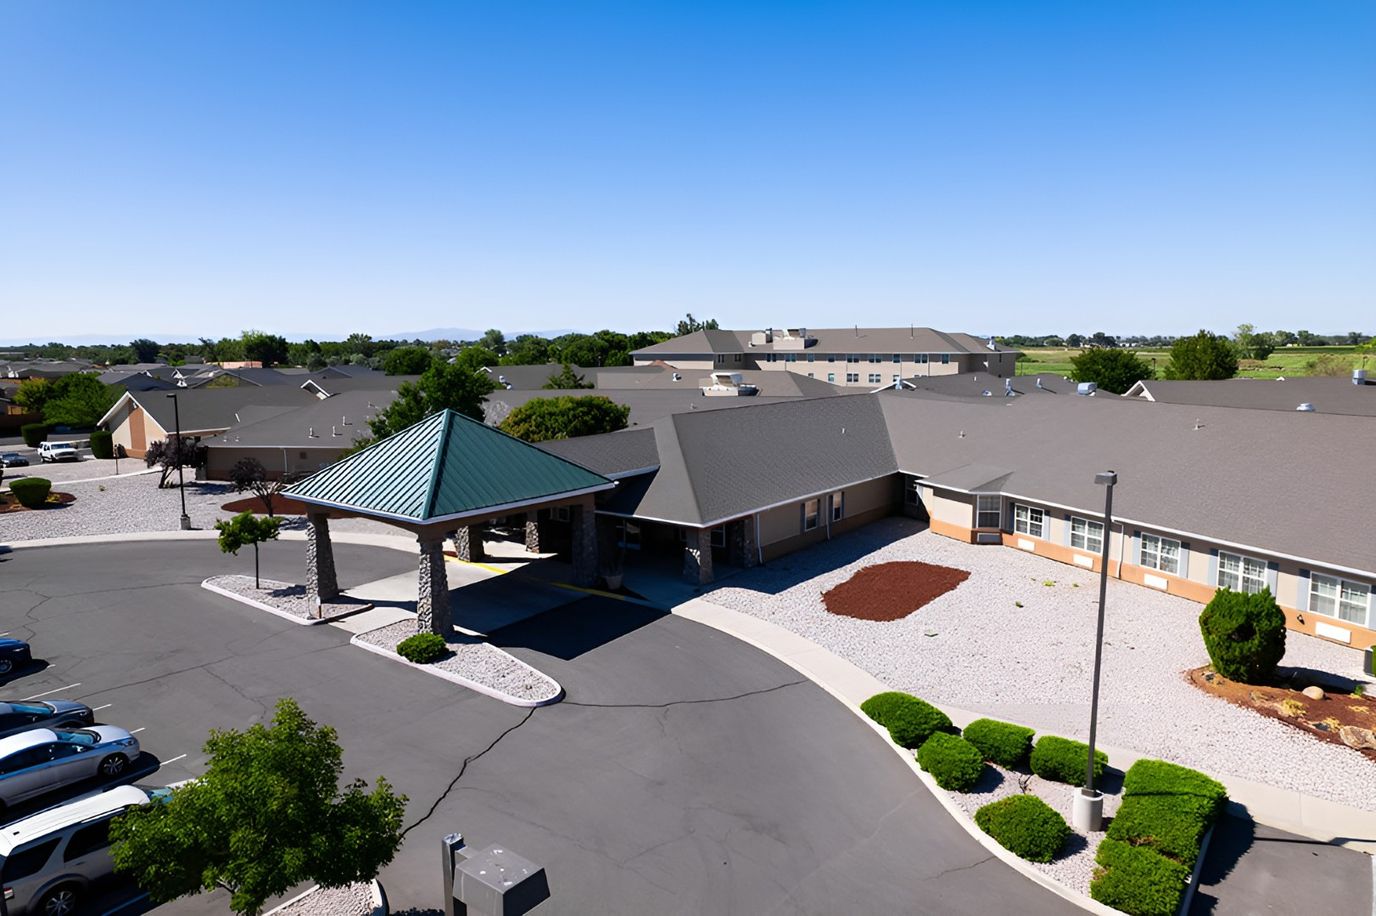
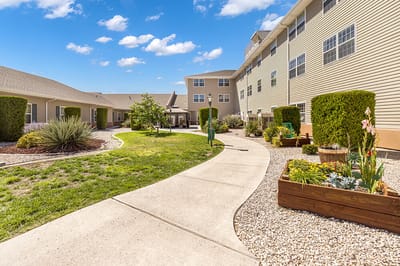
Situated in Fallon, NV, Highland Village of Fallon is a non-profit retirement community that provides comprehensive care options, ranging from independent living to skilled nursing. With its supportive environment, the community strives to meet residents’ needs, which include their daily living activities and household tasks. Thoughtfully designed accommodations and accessible amenities are also available, ensuring residents feel at ease during their stay.

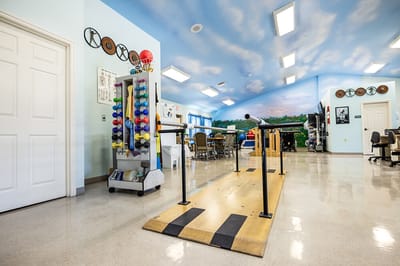
Focusing on residents’ enjoyment and wellness, social events, light exercises, and engaging activities are conducted. To ensure residents can take their medications as prescribed, medication reminders are also given. Transportation services are also available for convenience and safety. This continuing care retirement community is ideal for those looking for a wide range of care options to meet their healthcare needs.

(775) 423-7800

Quality ratings

Measured by Centers for Medicare & Medicaid Services (CMS)

Overall rating Info The Overall CMS Rating combines results from health inspections, staffing levels and quality measures. Health inspections carry the most weight. Staffing and quality scores can increase or decrease the final rating based on performance compared to state and national standards.
▼ 66.8% Below NV avg.
Health Inspection Info Based on the results of the facility's three most recent standard inspections and any complaint investigations. CMS reviews the number, scope, and severity of deficiencies, with more recent findings weighted more heavily.
▼ 64.9% Below NV avg.
Staffing Info Measures average nursing staff hours per resident per day, including Registered Nurses (RNs) and total nursing staff. Ratings are adjusted based on the level of care residents require and are compared to state and national benchmarks.
▼ 35.7% Below NV avg.
Quality Measures Info Based on clinical and physical health indicators reported to CMS, such as hospital readmissions, falls, pressure ulcers, and improvements in mobility. These measures reflect how well residents' health needs are being managed.
▼ 17.2% Below NV avg.

Staffing hours breakdown

Info Daily nursing hours per resident by staff type, reported to CMS. Higher is generally better — compare this facility to state and national averages to see where staffing stands.

Hours per resident per day — compared to Nevada state averages

Total nursing care / resident Info This home is ranked 21st out of 34 homes in Nevada.

Total adjusted nursing hours per resident per day, combining RN, LPN, and aide time. CMS adjusts this for case-mix so facilities can be fairly compared.
3h 24m per day
Rank #21 / 34Nurse hours — state benchmarkedThis home is ranked 21st out of 34 homes in Nevada.Shows adjusted nurse hours per resident per day benchmarked to the Nevada average, with a ranking across 34 Nevada SNFs. More hours mean more direct care. The national average is about 3.5 hrs; below 3.0 is a red flag.
This facility Nevada avg (4h 2m per day)
vs Nevada avg
-16%

6 of 6 metrics below state avg

Staff typeHours / dayvs state avg
Registered Nurse (RN) Info RNs hold the highest nursing license and can assess residents, interpret test results, and direct care plans. More RN hours per day often signals stronger clinical oversight and faster response to health changes. 19m per day ▼ 70% State avg: 1h 4m per day · National avg: 41m per day
LPN / LVN Info Licensed Practical Nurses (LPNs) or Licensed Vocational Nurses (LVNs) deliver routine hands-on care — medication administration, wound dressing, and monitoring vital signs. They work under RN supervision and make up a large share of daily bedside care. 52m per day ▼ 4% State avg: 54m per day · National avg: 52m per day
Nurse Aide Info Certified Nurse Aides (CNAs) provide the most direct day-to-day assistance: bathing, dressing, feeding, and mobility. Nurse aide hours are typically the largest staffing category and directly affect residents' quality of life. 1h 55m per day ▼ 20% State avg: 2h 23m per day · National avg: 2h 21m per day
Total Nursing (Weekend) Info Combined nursing hours (RN + LPN + Nurse Aide) per resident per day on weekends. Staffing often drops on weekends — this figure reveals whether the facility maintains adequate coverage outside of weekday hours. 2h 44m per day ▼ 29% State avg: 3h 51m per day · National avg: 3h 26m per day
Physical Therapist Info Hours per resident per day provided by licensed Physical Therapists (PTs) or PT Assistants. PT services help residents recover mobility after injury or illness and are especially important for post-acute (short-stay) rehabilitation. 2m per day ▼ 60% State avg: 5m per day · National avg: 4m per day
RN (Weekend) Info Registered nurse hours specifically on weekends. Facilities sometimes reduce RN presence on Saturdays and Sundays — a low weekend RN figure compared to weekday hours can indicate reduced clinical oversight when most administrative staff are absent. 11m per day ▼ 78% State avg: 51m per day · National avg: 29m per day

Capacity and availability

This home usually has availability

Occupancy lower than 85% suggests more openings may be available.

Lower occupancy than the Nevada average: 81.5%
Occupancy rate 67.2% Rank #31 / 36Occupancy rate — state benchmarkedThis home is ranked 31st out of 36 homes in Nevada.Shows this facility's occupancy rate versus the Nevada average, with its statewide rank out of 36. Higher occupancy signals strong local demand and financial stability.
Avg. Length of Stay 148 days
Occupancy rate
67.2% Rank #31 / 36Occupancy rate — state benchmarkedThis home is ranked 31st out of 36 homes in Nevada.Shows this facility's occupancy rate versus the Nevada average, with its statewide rank out of 36. Higher occupancy signals strong local demand and financial stability.
Avg. Length of Stay
148 days

Who this home usually serves

TYPE OF STAY

Mostly short-term rehab stays

Most residents typically stay for a few weeks or months before returning home or moving on.

Breakdown by payment type

Medicare

37% of new residents, usually for short-term rehab.

Typical stay 1 - 2 months

Private pay

29% of new residents, often for short stays.

Typical stay 3 - 4 months

Medicaid

34% of new residents, often for long-term daily care.

Typical stay 9 - 10 months

Finances and operations

Voluntary non-profit community
Home revenue
$7.8M
Operating deficit
-$2.4M
Voluntary non-profit community
Home revenue
$7.8M Rank #32 / 36Revenue — state benchmarkedThis home is ranked 32nd out of 36 homes in Nevada.Shows this facility's annual revenue compared to the Nevada SNF average. Higher revenue generally means more resources for staffing and capital — read alongside Payroll %.
Operating deficit
-$2.4M
Payroll costs Info The portion of the home's budget spent on staff, including nurses, caregivers, and other employees who support care and operations. Rank #26 / 36Payroll — state benchmarkedThis home is ranked 26th out of 36 homes in Nevada.Shows total annual staff payroll benchmarked to the Nevada average. Higher payroll investment relative to peers often signals better staffing and less reliance on cheaper contract labor.
$6.3M
80.9% of revenue Rank #2 / 36Payroll % — state benchmarkedThis home is ranked 2nd out of 36 homes in Nevada.Shows payroll as a percentage of revenue versus the Nevada average. Well-run SNFs often land around 55–65%. Below 25% may signal understaffing or heavy agency use — read with Staffing ratings.
Other operating costs Info All remaining costs needed to run the home, such as food, utilities, building maintenance, supplies and administrative expenses.
$3.9M
Total costs $10.2M
Walk Score
Walk Score: 25 / 100 Rank #24 / 31Walk Score — state benchmarkedThis home is ranked 24th out of 31 homes in Nevada.Shows how walkable this facility's neighborhood is compared to the average Walk Score across Nevada SNFs. Higher scores benefit residents, families, and staff.
Somewhat walkable. A few nearby services may be reachable on foot, but most trips require transportation.

What does this home offer?

Housing options icon

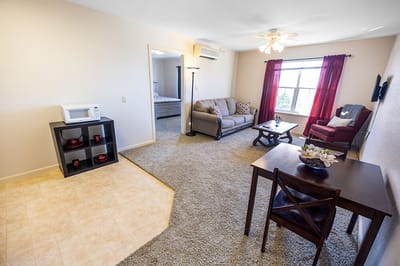
Housing Options: Private Suites

Dining services icon

Dining Services

Beauty services icon

Beauty Services

Housekeeping icon
Housekeeping icon

Housekeeping Services

Social and recreational activities icon

Social and Recreational Activities

Types of Care at Highland Village of Fallon

Assisted Living Independent Living Nursing Home

Contact Highland Village of Fallon

Health Inspection History

Inspections
Total health inspections 9

Nevada average 5.1


Last Health inspection on Sep 2025

Total health citations
86 Rank #35 / 36Health citations — state benchmarkedThis home is ranked 35th out of 36 homes in Nevada.Shows this facility's total health deficiency citations benchmarked to the Nevada state average, with a ranking across all 36 NV SNFs. Lower citation counts earn a better rank.

Nevada average 36.2

Citations per inspection
9.56 Rank #30 / 36Citations per inspection — state benchmarkedThis home is ranked 30th out of 36 homes in Nevada.Shows average deficiency citations per CMS inspection for this facility versus the Nevada mean across 36 SNFs with citation data. Lower is better.

Nevada average 7.08


Health citations are formal notices following inspections when they fail to comply with safety and care standards.

57 of 86 citations resulted from standard inspections; 24 of 86 resulted from complaint investigations; and 5 of 86 came from combined inspections (standard and complaint).

Breakdown of citation severity (last 2 years)
Critical Health citations More info
0
100% better than Nevada average

Nevada average: 0.1


Serious Health citations More info 2
300% worse than Nevada average

Nevada average: 0.5

0 critical citations More info Nevada average: 0.1

2 serious citations More info Nevada average: 0.5

84 moderate citations More info Nevada average: 35

0 minor citations More info Nevada average: 0.5
Citations history (last 2 years)
Abuse/Neglect serious citation Info Issues related to protecting resident's from harm, including abuse, neglect, or mistreatment. Sep 04, 2025
Corrected

Abuse/Neglect moderate citation Info Issues related to protecting resident's from harm, including abuse, neglect, or mistreatment. Sep 04, 2025
Corrected

Administration moderate citation Info Issues related to how the facility is managed, including policies, procedures, and compliance with regulations. Sep 04, 2025
Corrected

Administration moderate citation Info Issues related to how the facility is managed, including policies, procedures, and compliance with regulations. Sep 04, 2025
Corrected

Financial Assistance for
Nursing Home in Nevada

Highland Village of Fallon is located in Fallon, Nevada.
Here are the financial assistance programs available to residents in Nevada.

Get Financial aid guidance

Home and Community Based Waiver

Nevada Medicaid HCBW

Age 65+ or disabled
General Nevada resident, Medicaid-eligible, nursing home-level care need.
Income Limits (2025) ~$2,829/month 300% FBR, individual
Asset Limits $2,000 (individual), $3,000 (couple).
NV

High urban demand (e.g., Las Vegas); rural challenges.

Benefits
Personal care (5-7 hours/day) Respite (240 hours/year) Home modifications ($1,500 avg.) Meals ($6/meal)

Nevada Senior Services Program

NV SSP

Age 60+
General Nevada resident, at risk of decline.
Income Limits ~$1,800/month individual, varies
Asset Limits $5,000 individual
NV

Limited funding; rural focus.

Benefits
In-home care (3-5 hours/week) Respite (up to 10 days/year) Transportation (~5 trips/month)

Personal Care Services (PCS)

Nevada Personal Care Services

Age 19+ (65+ for seniors focus)
General Nevada resident, Medicaid-eligible, needs help with 1+ ADL.
Income Limits (2025) ~$967/month (individual); spenddown allowed.
Asset Limits $2,000 (individual), $3,000 (couple).
NV

Self-directed (family can be paid); statewide via DHHS.

Benefits
Personal care (4-6 hours/day) Limited homemaker services Respite (~200 hours/year)

Senior Rx Program

Nevada Senior Rx Program

Age 65+
General Nevada resident, enrolled in Medicare Part D, income below limit.
Income Limits (2025) ~$2,510/month (individual), ~$3,380/month (couple).
Asset Limits Not assessed.
NV

Covers up to $38.75/month premium; funded by tobacco settlement.

Benefits
Prescription drug premium assistance (~$465/year) Reducing out-of-pocket costs

Medicare Savings Program (MSP)

Nevada Medicare Savings Program

Age 65+ or disabled
General Nevada resident, Medicare Part A/B.
Income Limits (2025) ~$2,510/month (QMB), ~$3,380/month (SLMB), ~$3,598/month (QI)—individual.
Asset Limits $9,430 (individual), $14,130 (couple).
NV

Three tiers; no waitlist; includes Extra Help for Part D.

Benefits
Covers Part B premiums ($174.70/month) Deductibles ($240/year) Copays (~20%)

Nevada Caregiver Support Program (via NFCSP)

Nevada Caregiver Support Program

Age
General Caregivers of 60+ needing care or 55+ caregivers of others; Nevada resident; functional needs (2+ ADLs).
Income Limits (2025) Prioritizes ~$24,980/year (individual); no strict cap.
Asset Limits Not assessed; need-based.
NV

5 AAAs; prioritizes rural, low-income caregivers.

Benefits
Respite (4-6 hours/week or 5 days/year) Adult day care ($60/day) Training Supplies (~$500/year)

VA Aid and Attendance (A&A) and Housebound Benefits

Nevada VA Aid and Attendance/Housebound

Age 65+ or disabled veteran/spouse
General Nevada resident, wartime service, need for ADL help (A&A) or homebound.
Income Limits (2025) Net income < ~$1,984/month (veteran with dependent, A&A); pension offsets income.
Asset Limits ~$155,356 net worth limit
NV

High veteran demand in urban/rural areas.

Benefits
Cash (~$1,433-$2,642/month veteran, ~$951-$1,318 spouse) for care costs (e.g., in-home, assisted living)

Places of interest near Highland Village of Fallon

Address 1.0 miles from city center Info Estimated distance in miles from Fallon's city center to Highland Village of Fallon's address, calculated via Google Maps.

Calculate Travel Distance to Highland Village of Fallon

Add your location

Address

Staffing Data (Q2 2025)

This data corresponds to Q2 2025 and is based on CMS Payroll-Based Journal.

Total staff 101
Employees 87
Contractors 14
Staff to resident ratio 1.12:1
28% worse than Nevada average

Nevada average ratio: 1.57:1

Avg staff/day 38
Average shift 8.7 hours
0% compared with Nevada average

Nevada average: 8.8 hours

Total staff hours (quarter) 29,928
Nursing staff breakdown
Registered Nurse

Manages medical care and health needs.

Total count 8
Average shift length Info Average shift length. Calculated as total hours divided by days worked and average staff per day. 10 hours

No contractors work on this role.

Licensed Practical Nurse

Assists with medical care and medications.

Total count 17
Average shift length Info Average shift length. Calculated as total hours divided by days worked and average staff per day. 9.4 hours

No contractors work on this role.

Certified Nursing Assistant

Helps with daily care and mobility.

Total count 39
Average shift length Info Average shift length. Calculated as total hours divided by days worked and average staff per day. 9.7 hours

No contractors work on this role.

Contractor staffing

Total hours from contractors

2.8%

836 contractor hours this quarter

Respiratory Therapy Technician: 3 Speech Language Pathologist: 2 Qualified Social Worker: 2 Physical Therapy Aide: 2 Physical Therapy Assistant: 1 Medical Director: 1 Dietitian: 1 Occupational Therapy Aide: 1 Occupational Therapy Assistant: 1
Staff by category
Certified Nursing Assistant3903914,26191100%9.7
Licensed Practical Nurse170175,32191100%9.4
Registered Nurse8082,0568897%10
Other Dietary Services Staff6061,87491100%6.8
Nurse Aide in Training8081,7518897%9.6
Dental Services Staff4041,1606673%7.6
Clinical Nurse Specialist2029806673%8
Nurse Practitioner1017286875%10.7
Administrator1015166673%7.8
RN Director of Nursing1014465459%8.3
Physical Therapy Assistant0112436369%3.9
Respiratory Therapy Technician0331496268%2.3
Occupational Therapy Aide0111041820%5.8
Qualified Social Worker022903437%2.7
Medical Director011902426%3.8
Speech Language Pathologist022754954%1.5
Physical Therapy Aide022624044%1.5
Dietitian0111878%2.5
Occupational Therapy Assistant011633%2
39 Certified Nursing Assistant
% of Days 100%
17 Licensed Practical Nurse
% of Days 100%
8 Registered Nurse
% of Days 97%
6 Other Dietary Services Staff
% of Days 100%
8 Nurse Aide in Training
% of Days 97%
4 Dental Services Staff
% of Days 73%
2 Clinical Nurse Specialist
% of Days 73%
1 Nurse Practitioner
% of Days 75%
1 Administrator
% of Days 73%
1 RN Director of Nursing
% of Days 59%
1 Physical Therapy Assistant
% of Days 69%
3 Respiratory Therapy Technician
% of Days 68%
1 Occupational Therapy Aide
% of Days 20%
2 Qualified Social Worker
% of Days 37%
1 Medical Director
% of Days 26%
2 Speech Language Pathologist
% of Days 54%
2 Physical Therapy Aide
% of Days 44%
1 Dietitian
% of Days 8%
1 Occupational Therapy Assistant
% of Days 3%

Facility Characteristics

Source: CMS Long-Term Care Facility Characteristics (Data as of Jan 2026)

Total residents 90
Medicare
13
14.4% of residents
Medicaid
65
72.2% of residents
Private pay or other
12
13.3% of residents
Programs & Services
Residents Group

Residents meet regularly to discuss policies, care quality, and activities

Active Resident Council

Organized group of residents that meets regularly to discuss facility policies, quality of life, and activities.

Quality of care over time

These measures show how residents usually do over time at this home, based on health outcomes and preventive care.

High-risk clinical events score Info A composite score based on pressure ulcers, falls with injury, weight loss, walking ability decline, and activities of daily living decline. 12.0
24% worse than Nevada average

Nevada average: 9.7

Functional decline score Info A composite score based on activities of daily living decline, walking ability decline, and incontinence. 22.7
30% worse than Nevada average

Nevada average: 17.5

Long-stay resident measures
Below average Nevada avg: 3.1 Info CMS star rating based on long-stay quality measure performance. 5 stars = significantly above average, 1 star = significantly below average.
Need for Help with Daily Activities Increased Info Percent of long-stay residents whose need for help with daily activities has increased 24.7%
59% worse than Nevada average

Nevada average: 15.6%

Walking Ability Worsened Info Percent of long-stay residents whose ability to move independently worsened 25.0%
20% worse than Nevada average

Nevada average: 20.8%

Low Risk Residents with Bowel/Bladder Incontinence Info Percent of low risk long-stay residents who lose control of their bowels or bladder 18.4%
9% worse than Nevada average

Nevada average: 16.9%

Falls with Major Injury Info Percent of long-stay residents experiencing one or more falls with major injury 2.1%
17% better than Nevada average

Nevada average: 2.5%

High Risk Residents with Pressure Ulcers Info Percent of long-stay high risk residents with pressure ulcers 2.1%
62% better than Nevada average

Nevada average: 5.5%

Urinary Tract Infection Info Percent of long-stay residents with a urinary tract infection 2.9%
107% worse than Nevada average

Nevada average: 1.4%

Lost Too Much Weight Info Percent of long-stay residents who lose too much weight 6.2%
14% worse than Nevada average

Nevada average: 5.4%

Depressive Symptoms Info Percent of long-stay residents who have depressive symptoms 5.3%
25% worse than Nevada average

Nevada average: 4.2%

Antipsychotic Use Info Percent of long-stay residents who received an antipsychotic medication 11.0%
22% better than Nevada average

Nevada average: 14.1%

Pneumococcal Vaccine Info Percent of long-stay residents assessed and appropriately given the pneumococcal vaccine 98.3%
8% better than Nevada average

Nevada average: 91.0%

Influenza Vaccine Info Percent of long-stay residents assessed and appropriately given the seasonal influenza vaccine 90.7%
In line with Nevada average

Nevada average: 89.6%

Hospitalizations per 1,000 days Info Number of hospitalizations per 1,000 long-stay resident days. 2.29
26% worse than Nevada average

Nevada average: 1.82

ED visits per 1,000 days Info Number of outpatient emergency department visits per 1,000 long-stay resident days. 3.34
123% worse than Nevada average

Nevada average: 1.50

Short-stay resident measures
Above average Nevada avg: 3.1 Info CMS star rating based on short-stay quality measure performance. 5 stars = much above average, 1 star = much below average.
Pneumococcal Vaccine Info Percent of short-stay residents assessed and appropriately given the pneumococcal vaccine 88.1%
5% better than Nevada average

Nevada average: 83.9%

Antipsychotic medication increase Info Percent of short-stay residents who newly received an antipsychotic medication 0.8%
59% better than Nevada average

Nevada average: 2.0%

Influenza Vaccine Info Percent of short-stay residents assessed and appropriately given the seasonal influenza vaccine 79.6%
In line with Nevada average

Nevada average: 80.7%

Re-hospitalized after SNF stay Info Percentage of short-stay residents who were re-hospitalized after their nursing home admission. 19.4%
17% better than Nevada average

Nevada average: 23.4%

Emergency department visits Info Percentage of short-stay residents who had an outpatient emergency department visit. 11.8%
20% worse than Nevada average

Nevada average: 9.8%

Falls with major injury Info Percentage of SNF residents who experience falls with major injury during their stay. 0.0%
100% better than Nevada average

Nevada average: 0.8%

Ability to care for self at discharge Info Percentage of residents at or above expected ability to care for themselves at discharge. 57.9%
8% better than Nevada average

Nevada average: 53.7%

Successful return to home or community Info Rate of successful return to home or community from a skilled nursing facility. 45.3%
10% worse than Nevada average

Nevada average: 50.6%

Penalties and fines

Federal penalties imposed by CMS for regulatory violations, including civil money penalties (fines) and denials of payment for new Medicare/Medicaid admissions.

Source: CMS Penalties Database (Data as of Jan 2026)

Total fines amount $53K
55% higher than Nevada average

Nevada average: $34K

Number of fines 2
42% more fines than Nevada average

Nevada average: 1.4

Payment Denials Info Serious action where Medicare and/or Medicaid temporarily stops payments for new residents until issues are fixed. 1
1250% more payment denials than Nevada average

Nevada average: 0.1

Fines amount comparison
This facility $53K
Nevada average $34K
Penalty History

Penalties are imposed by CMS for violations of federal nursing home regulations.

3 penalties in the past 3 years

Multiple penalties were reported in the last 3 years.

Civil Money Penalty Info Fines imposed for noncompliance, which can be assessed per day or per instance of violation. Nov 12, 2024
$19K
Civil Money Penalty Info Fines imposed for noncompliance, which can be assessed per day or per instance of violation. Jun 8, 2023
$34K
Payment Denial Info Serious action where Medicare and/or Medicaid temporarily stops payments for new residents until issues are fixed. Jun 8, 2023
34 days

Last updated: Jan 2026

Compare Nursing Home around Nevada The information below is reported by the Nevada Department of Health and Human Services, Bureau of Health Care Quality and Compliance.

5 facilities compared · CMS & NV Dept. of Health data · Updated May 2026

Filter by care type
Alpine Skilled Nursing and Rehabilitation Center
NH

Nursing Home Licensed facility providing 24/7 skilled nursing care for residents with complex, ongoing medical needs. Staffed by RNs, LPNs, and CNAs. Inspected and star-rated annually by CMS. Accepts Medicare (short-term rehab) and Medicaid (long-term care).

AL

Assisted Living A licensed, long-term care setting for seniors or individuals with disabilities who need help with daily activities — like bathing, dressing, and medication management — but not 24-hour skilled nursing. Offers housing, meals, and around-the-clock support while aiming to maximize resident independence.

Reno189 58.9% -28%3.07 -28%-24%0496.12152 60 Gray Estate Holdings Llc$23.2M$7.0M30.2%295043
Highland Village of Fallon
NH

Nursing Home Licensed facility providing 24/7 skilled nursing care for residents with complex, ongoing medical needs. Staffed by RNs, LPNs, and CNAs. Inspected and star-rated annually by CMS. Accepts Medicare (short-term rehab) and Medicaid (long-term care).

AL

Assisted Living A licensed, long-term care setting for seniors or individuals with disabilities who need help with daily activities — like bathing, dressing, and medication management — but not 24-hour skilled nursing. Offers housing, meals, and around-the-clock support while aiming to maximize resident independence.

IL

Independent Living Lifestyle-focused communities for older adults offering dining, activities, and transportation with minimal personal care. Best for active, independent seniors who want community without medical support.

Fallon102 67.2% -18%3.40 -44%-16%2869.6288 25 Fallon Health Care, Llc$7.8M$4.1M52.9%295085
Charleston Post Acute -
NH

Nursing Home Licensed facility providing 24/7 skilled nursing care for residents with complex, ongoing medical needs. Staffed by RNs, LPNs, and CNAs. Inspected and star-rated annually by CMS. Accepts Medicare (short-term rehab) and Medicaid (long-term care).

AL

Assisted Living A licensed, long-term care setting for seniors or individuals with disabilities who need help with daily activities — like bathing, dressing, and medication management — but not 24-hour skilled nursing. Offers housing, meals, and around-the-clock support while aiming to maximize resident independence.

Las Vegas148--------0---- 71 -----
Desert Willow Post Acute -
NH

Nursing Home Licensed facility providing 24/7 skilled nursing care for residents with complex, ongoing medical needs. Staffed by RNs, LPNs, and CNAs. Inspected and star-rated annually by CMS. Accepts Medicare (short-term rehab) and Medicaid (long-term care).

AL

Assisted Living A licensed, long-term care setting for seniors or individuals with disabilities who need help with daily activities — like bathing, dressing, and medication management — but not 24-hour skilled nursing. Offers housing, meals, and around-the-clock support while aiming to maximize resident independence.

Las Vegas155--------0---- 46 -----
Fernley Estates -
NH

Nursing Home Licensed facility providing 24/7 skilled nursing care for residents with complex, ongoing medical needs. Staffed by RNs, LPNs, and CNAs. Inspected and star-rated annually by CMS. Accepts Medicare (short-term rehab) and Medicaid (long-term care).

AL

Assisted Living A licensed, long-term care setting for seniors or individuals with disabilities who need help with daily activities — like bathing, dressing, and medication management — but not 24-hour skilled nursing. Offers housing, meals, and around-the-clock support while aiming to maximize resident independence.

Fernley72--------0---- 47 -----

Guides for Better Senior Living

Care Cost Calculator: See Prices in Your Area

Nursing Home Data Explorer

Don’t Wait Too Long: 7 Red Flag Signs Your Parent Needs Assisted Living Now

The True Cost of Assisted Living in 2025 – And How Families Are Paying For It

Understanding Senior Living Costs: Pricing Models, Discounts & Financial Assistance

Frequently Asked Questions about Highland Village of Fallon

What neighborhood is Highland Village of Fallon in?

Highland Village of Fallon is in the Fallon neighborhood.

Is Highland Village of Fallon in a walkable area?

Highland Village of Fallon has a walk score of 25. Somewhat walkable. A few nearby services may be reachable on foot, but most trips require transportation.

What is the address of Highland Village of Fallon?

Highland Village of Fallon is located at 550 Sherman St, Fallon, NV 89406.

What is the phone number of Highland Village of Fallon?

(775) 423-7800 will put you in contact with the team at Highland Village of Fallon.

Is Highland Village of Fallon Medicare or Medicaid certified?

Yes — Highland Village of Fallon is a CMS-certified provider of Medicare and Medicaid.

Explore Open Rooms
1 Contact details
2 What type of senior care service are you looking for?
3 What budget do you have in mind for senior care?
4 How soon do you need to find care?
5 Additional details

Thank you for your interest!

Our team will be in touch shortly to help with next steps.