


Total health inspections
2
State average N/A
Last Health inspection on Dec 2023
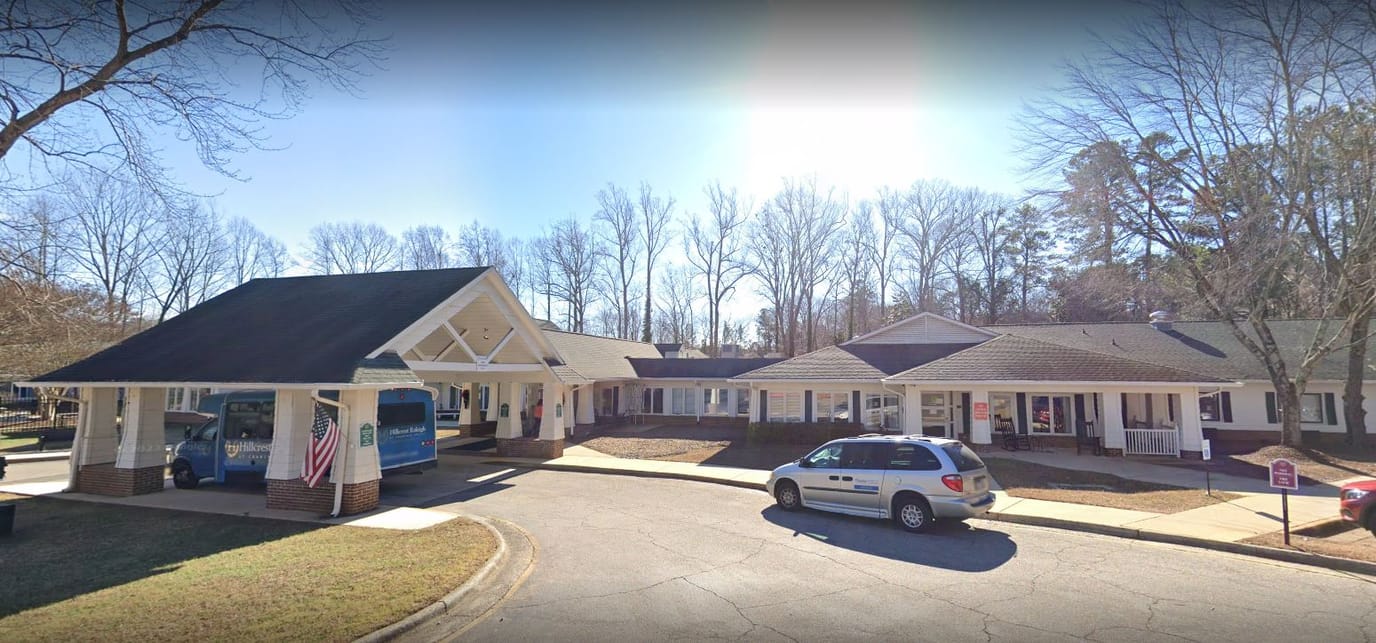
Hillcrest Raleigh has been providing unparalleled care for over seven decades. Located in Crabtree Valley, Hillcrest Raleigh is an ideal location for a restful stay. Residents can benefit from a range of care services, including short-term rehab, long-term care, specialized care, and home health, in fully-appointed private rooms. Patient comfort is of utmost importance. The facility offers a concierge service to assist with patient needs, and licensed nursing staff to provide exceptional care. Geriatric psychiatry services are also available to address emotional or mental health concerns.
The facility boasts a unique and stylish interior, offering cozy nooks where patients can unwind and step outside to enjoy the beautiful weather. On top of these, the expansive rehab gym is fully equipped to provide patients with the resources needed to get back on their feet. Residents can experience the difference for themselves and see why Hillcrest Raleigh is the premier destination for quality care in Raleigh.
| Staff type | Hours / Day / Resident | vs state avg |
|---|---|---|
|
Registered Nurse (RN)
| 48m per day | ▲ 37% State avg: 35m per day · National avg: 41m per day |
|
LPN / LVN
| 1h 2m per day | ▲ 20% State avg: 52m per day · National avg: 52m per day |
|
Nurse Aide
| 2h 53m per day | ▲ 24% State avg: 2h 19m per day · National avg: 2h 21m per day |
|
Weekend Total Nursing
| 4h 16m per day | ▲ 28% State avg: 3h 20m per day · National avg: 3h 26m per day |
|
Physical Therapist
| 17m per day | ▲ 238% State avg: 5m per day · National avg: 4m per day |
|
Weekend RN
| 44m per day | ▲ 93% State avg: 23m per day · National avg: 29m per day |
Key information about the people who lead and staff this community.
In North Carolina, the Department of Health and Human Services, Division of Health Service Regulation conducts unannounced surveys to ensure nursing and adult care homes meet safety standards.
Deficiencies
| This Facility | NC Average | vs. NC Avg |
|---|---|---|---|
|
Total deficiencies
| 12 | 46 | This facility has 74% fewer total deficiencies than a typical North Carolina assisted living residence (12 vs. NC avg 46).↓ 74% better |
|
Deficiencies per year
| 3 | 11.5 | This facility has 74% fewer deficiencies per year than a typical North Carolina assisted living residence (3 vs. NC avg 11.5).↓ 74% better |
State average N/A
Last Health inspection on Dec 2023
State average N/A
State average N/A
Health citations are formal notices following inspections when they fail to comply with safety and care standards.
11 of 12 citations resulted from standard inspections; and 1 of 12 came from combined inspections (standard and complaint).
State average: N/A
State average: N/A
Reporting period: October 1 – December 31, 2025 (Q4 2025). Source: CMS Payroll-Based Journal report.
State average ratio: 0 : 0
State average: 0 hours
Manages medical care and health needs.
Assists with medical care and medications.
Helps with daily care and mobility.
Total hours from contractors
11,153 contractor hours this quarter
| Certified Nursing Assistant | 127 | 22 | 149 | 22,900 | 92 | 100% | 7.9 |
| Licensed Practical Nurse | 34 | 7 | 41 | 9,462 | 92 | 100% | 8.7 |
| Registered Nurse | 32 | 7 | 39 | 6,444 | 92 | 100% | 8.1 |
| Medication Aide/Technician | 11 | 0 | 11 | 3,364 | 88 | 96% | 7.7 |
| Respiratory Therapy Technician | 0 | 18 | 18 | 2,571 | 92 | 100% | 6.9 |
| Physical Therapy Aide | 0 | 6 | 6 | 1,591 | 77 | 84% | 7.5 |
| Qualified Social Worker | 0 | 6 | 6 | 1,284 | 77 | 84% | 6.8 |
| Physical Therapy Assistant | 0 | 7 | 7 | 1,221 | 86 | 93% | 7 |
| Administrator | 2 | 0 | 2 | 1,056 | 66 | 72% | 8 |
| Speech Language Pathologist | 0 | 5 | 5 | 842 | 75 | 82% | 5.7 |
| Qualified Activities Professional | 0 | 6 | 6 | 749 | 92 | 100% | 7.5 |
| Dental Services Staff | 2 | 0 | 2 | 594 | 69 | 75% | 7.7 |
| Other Dietary Services Staff | 1 | 0 | 1 | 573 | 73 | 79% | 7.8 |
| Nurse Practitioner | 1 | 0 | 1 | 528 | 66 | 72% | 8 |
| Dietitian | 1 | 0 | 1 | 494 | 66 | 72% | 7.5 |
| Therapeutic Recreation Specialist | 0 | 1 | 1 | 486 | 62 | 67% | 7.8 |
| Clinical Nurse Specialist | 2 | 0 | 2 | 305 | 35 | 38% | 8.7 |
| Occupational Therapy Aide | 1 | 1 | 2 | 199 | 36 | 39% | 5.5 |
| Occupational Therapy Assistant | 0 | 2 | 2 | 76 | 48 | 52% | 1.6 |
Includes penalties issued in 2023
Federal penalties imposed by CMS for regulatory violations, including civil money penalties (fines) and denials of payment for new Medicare/Medicaid admissions.
Source: CMS Penalties Database (Data as of Jan 2026)
State average: $76K
State average: 2.3
State average: 0.4
Penalties are imposed by CMS for violations of federal nursing home regulations.
1 penalty in the past 3 years
Dec 15, 2023 · $17K
Last updated: Jan 2026
These measures show how residents usually do over time at this home, based on health outcomes and preventive care.
State average: 11.5
State average: 20.6
State average: 17.5%
State average: 23.3%
State average: 21.4%
State average: 3.6%
State average: 6.3%
State average: 2.6%
State average: 7.4%
State average: 4.4%
State average: 13.4%
State average: 91.6%
State average: 94.1%
State average: 1.77
State average: 1.82
State average: 79.9%
State average: 1.5%
State average: 78.1%
State average: 22.9%
State average: 13.2%
State average: 0.8%
State average: 53.7%
State average: 50.6%
Quality measures are calculated from Minimum Data Set (MDS) assessments. For most measures, lower percentages indicate better care quality.
54% of new residents, usually for short-term rehab.
44% of new residents, often for short stays.
2% of new residents, often for long-term daily care.
Source: CMS Long-Term Care Facility Characteristics (Data as of Jan 2026)
Residents meet regularly to discuss policies, care quality, and activities
Organized group of residents that meets regularly to discuss facility policies, quality of life, and activities.
Data sourced from CMS Long-Term Care Facility Characteristics quarterly report. Payer mix reflects the current resident census by primary payment source.
Historical financial and operational data for Hillcrest Raleigh At Crabtree Valley from 2012–2023, based on CMS SNF Cost Reports.
Based on CMS SNF Cost Report for fiscal year ending in 09/2023.
Most residents typically stay for a few weeks or months before returning home or moving on.
Most new residents arrive under Medicare (54% of admissions), and a typical Medicare stay runs around 24 days.
Coverage residents most often arrive under.
Coverage residents most often leave under.
![]() 4.3 miles from city center
4.3 miles from city center
![]() Estimated distance in miles from Raleigh's city center to Hillcrest Raleigh At Crabtree Valley's address, calculated via Google Maps.
Estimated distance in miles from Raleigh's city center to Hillcrest Raleigh At Crabtree Valley's address, calculated via Google Maps.
Add your location
The information below is reported by the North Carolina Department of Health and Human Services, Division of Health Service Regulation.
| Hillcrest Raleigh At Crabtree Valley | NH HC NC | Raleigh (North Hills) | - | 134 | - | 31 | - |
| The Cypress of Charlotte | NH AL HC IL MC | Charlotte (Beverly Woods) | - | 65 | - | 15 | 1 Bed / 2 Bed |
| Givens Highland Farms | NH HC IL NC RC | Black Mountain | - | 60 | - | 12 | Studio / 1 Bed / 2 Bed / 3 Bed |
| The Oaks at Whitaker Glen | NH AL HC IL MC | Raleigh (Five Points) | - | 139 | A+ | 28 | - |
| Piedmont Crossing | NH AL HC IL MC RC | Thomasville (Hedrick Drive) | - | 104 | - | 4 | 1 Bed / 2 Bed |
Hillcrest Raleigh At Crabtree Valley is in the North Hills neighborhood of Raleigh.
Hillcrest Raleigh At Crabtree Valley has a walk score of 31. Somewhat walkable. A few nearby services may be reachable on foot, but most trips require transportation.
Hillcrest Raleigh At Crabtree Valley's occupancy is 73.7%.
Hillcrest Raleigh At Crabtree Valley is registered as a for-profit in NC.
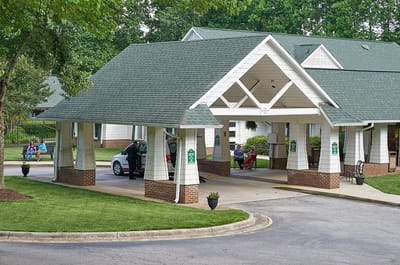
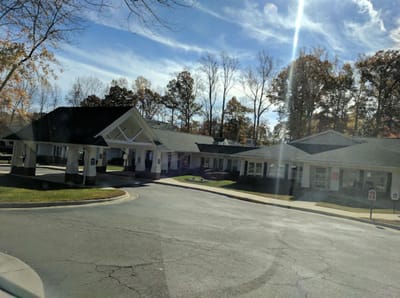
Yes — there are 3 photos of Hillcrest Raleigh At Crabtree Valley in the photo gallery on this page.
Hillcrest Raleigh At Crabtree Valley is located at 3830 Blue Ridge Rd, Raleigh, NC 27612.
(919) 781-4900 will put you in contact with the team at Hillcrest Raleigh At Crabtree Valley.
Care Cost Calculator: See Prices in Your Area
Nursing Home Data Explorer
Don’t Wait Too Long: 7 Red Flag Signs Your Parent Needs Assisted Living Now
The True Cost of Assisted Living in 2025 – And How Families Are Paying For It
Understanding Senior Living Costs: Pricing Models, Discounts & Financial Assistance


