


Total staff
197
Employees
154
Contractors
43
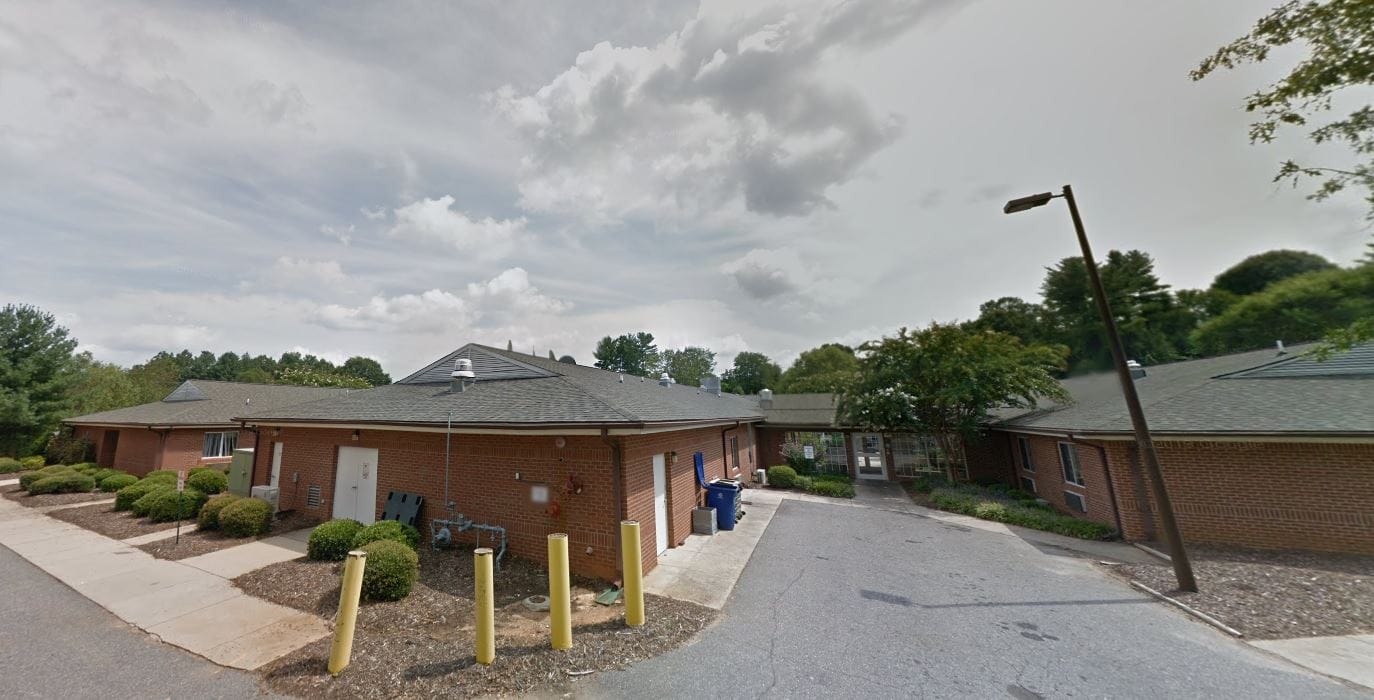
Built for residents needing skilled nursing care and rehabilitation, College Pines Health and Rehabilitation Center is a 100-bed nursing home in Connelly Springs, near Raleigh, North Carolina. Medicare, Medicaid, and private pay are accepted to create flexible payment options for short-term rehabilitation stays and longer-term care. Averaging a stay length of 98 days, the home serves occupants in early recovery and those requiring continuous nursing support.
The facility is staffed with nursing professionals committed to daily diligent care. Total nursing support averages roughly 3 hours 59 minutes per resident day, combining registered nurses, licensed practical nurses, and certified nursing aides. The registered nurse component totals 34 minutes per resident daily, ensuring clinical oversight of resident care. Therapy services form a central part of College Pines Health and Rehabilitation Center’s rehabilitation focus. Physical therapists, occupational therapists, and speech-language pathologists work with occupants to bolster recovery and functional improvement. The home maintains an active resident council where residents meet regularly to discuss facility policies, life quality, and activities, giving them a voice in community decisions. Connelly Springs is car-dependent, with limited nearby walkable options, so visiting family and friends must plan for a brief drive. The facility runs at high occupancy, typically around 92 percent, denoting stable demand for its services in the area.
| Staff type | Hours / Day / Resident | vs state avg |
|---|---|---|
|
Registered Nurse (RN)
| 34m per day | ▼ 4% State avg: 35m per day · National avg: 41m per day |
|
LPN / LVN
| 57m per day | ▲ 9% State avg: 52m per day · National avg: 52m per day |
|
Nurse Aide
| 2h 50m per day | ▲ 22% State avg: 2h 19m per day · National avg: 2h 21m per day |
|
Weekend Total Nursing
| 3h 37m per day | ▲ 9% State avg: 3h 20m per day · National avg: 3h 26m per day |
|
Physical Therapist
| 4m per day | ▼ 27% State avg: 5m per day · National avg: 4m per day |
|
Weekend RN
| 35m per day | ▲ 52% State avg: 23m per day · National avg: 29m per day |
Reporting period: October 1 – December 31, 2025 (Q4 2025). Source: CMS Payroll-Based Journal report.
Manages medical care and health needs.
Assists with medical care and medications.
Helps with daily care and mobility.
Total hours from contractors
4,722 contractor hours this quarter
| Certified Nursing Assistant | 93 | 0 | 93 | 24,147 | 92 | 100% | 8.5 |
| Licensed Practical Nurse | 29 | 0 | 29 | 7,076 | 92 | 100% | 9.2 |
| Registered Nurse | 16 | 0 | 16 | 4,316 | 92 | 100% | 9.3 |
| Speech Language Pathologist | 0 | 15 | 15 | 1,769 | 88 | 96% | 6.7 |
| Other Dietary Services Staff | 4 | 0 | 4 | 1,115 | 92 | 100% | 6.6 |
| RN Director of Nursing | 3 | 0 | 3 | 1,072 | 64 | 70% | 8 |
| Physical Therapy Aide | 0 | 6 | 6 | 1,053 | 82 | 89% | 7.3 |
| Physical Therapy Assistant | 0 | 5 | 5 | 543 | 79 | 86% | 6.1 |
| Respiratory Therapy Technician | 0 | 5 | 5 | 521 | 76 | 83% | 6.8 |
| Qualified Social Worker | 0 | 7 | 7 | 501 | 66 | 72% | 7 |
| Nurse Practitioner | 1 | 0 | 1 | 488 | 61 | 66% | 8 |
| Administrator | 1 | 0 | 1 | 465 | 59 | 64% | 7.9 |
| Mental Health Service Worker | 1 | 0 | 1 | 421 | 54 | 59% | 7.8 |
| Dietitian | 1 | 0 | 1 | 374 | 54 | 59% | 6.9 |
| Nurse Aide in Training | 2 | 0 | 2 | 271 | 27 | 29% | 6.6 |
| Occupational Therapy Aide | 0 | 2 | 2 | 139 | 66 | 72% | 1.9 |
| Occupational Therapy Assistant | 0 | 1 | 1 | 118 | 13 | 14% | 9.1 |
| Medical Director | 0 | 1 | 1 | 60 | 10 | 11% | 6 |
| Clinical Nurse Specialist | 2 | 1 | 3 | 42 | 6 | 7% | 7 |
| Other Physician | 1 | 0 | 1 | 5 | 1 | 1% | 5 |
Includes penalties issued in 2024
Federal penalties imposed by CMS for regulatory violations, including civil money penalties (fines) and denials of payment for new Medicare/Medicaid admissions.
Source: CMS Penalties Database (Data as of Jan 2026)
North Carolina average: $76K
North Carolina average: 2.3
North Carolina average: 0.4
Penalties are imposed by CMS for violations of federal nursing home regulations.
2 penalties in the past 3 years
Multiple penalties were reported in the last 3 years.
Last updated: Jan 2026
These measures show how residents usually do over time at this home, based on health outcomes and preventive care.
North Carolina average: 11.5
North Carolina average: 20.6
North Carolina average: 17.5%
North Carolina average: 23.3%
North Carolina average: 21.4%
North Carolina average: 3.6%
North Carolina average: 6.3%
North Carolina average: 2.6%
North Carolina average: 7.4%
North Carolina average: 4.4%
North Carolina average: 13.4%
North Carolina average: 91.6%
North Carolina average: 94.1%
North Carolina average: 1.77
North Carolina average: 1.82
North Carolina average: 79.9%
North Carolina average: 1.5%
North Carolina average: 78.1%
North Carolina average: 22.9%
North Carolina average: 13.2%
North Carolina average: 0.8%
North Carolina average: 53.7%
North Carolina average: 50.6%
Quality measures are calculated from Minimum Data Set (MDS) assessments. For most measures, lower percentages indicate better care quality.
52% of new residents, usually for short-term rehab.
40% of new residents, often for short stays.
8% of new residents, often for long-term daily care.
Source: CMS Long-Term Care Facility Characteristics (Data as of Jan 2026)
Residents meet regularly to discuss policies, care quality, and activities
Organized group of residents that meets regularly to discuss facility policies, quality of life, and activities.
Data sourced from CMS Long-Term Care Facility Characteristics quarterly report. Payer mix reflects the current resident census by primary payment source.
Historical financial and operational data for College Pines Health and Rehabilitation Center from 2011–2023, based on CMS SNF Cost Reports.
Key figures below are for fiscal year ending in 12/2023.
Based on CMS SNF Cost Report for fiscal year ending in 12/2023.
Most residents typically stay for a few weeks or months before returning home or moving on.
Most new residents arrive under Medicare (52% of admissions), and a typical Medicare stay runs around 1 - 2 months.
Coverage residents most often arrive under.
Coverage residents most often leave under.
![]() 0.4 miles from city center
0.4 miles from city center
![]() Estimated distance in miles from Connelly Springs's city center to College Pines Health and Rehabilitation Center's address, calculated via Google Maps.
— 7.73 miles to nearest hospital (UNC Health Blue Ridge)
Estimated distance in miles from Connelly Springs's city center to College Pines Health and Rehabilitation Center's address, calculated via Google Maps.
— 7.73 miles to nearest hospital (UNC Health Blue Ridge)
Add your location
The information below is reported by the North Carolina Department of Health and Human Services, Division of Health Service Regulation.
| The Rosewood Health Center – The Cypress of Raleigh | NH MC SNF | Raleigh (North Raleigh) | 57
Facility
57
NC AVG
72
Rank
#278 / 388 |
80.4%
Facility
80.4%
NC AVG
68
Rank
#98 / 240 | +18% | 7.06
Facility
7.06
NC AVG
3.98
Rank
#7 / 97 | +2% | +78% | $0
Facility
$0
NC AVG
$74.6k
Rank
#1 / 105 | 4
Facility
4
NC AVG
20.9
Rank
#12 / 101 | 2.0
Facility
2.0
NC AVG
5.0
Rank
#13 / 101 | - | 46 | - |
71
Facility
71
NC AVG
33
Rank
#28 / 573 | The Cypress Of Raleigh LLC | $28.0MFiscal year ending 12/2023
Facility
$28.0MFiscal year ending 12/2023
NC AVG
$13.2M
Rank
#15 / 104 | $15.8MFiscal year ending 12/2023
Facility
$15.8MFiscal year ending 12/2023
NC AVG
$4.9M
Rank
#10 / 104 | 56.4%Fiscal year ending 12/2023
Facility
56.4%Fiscal year ending 12/2023
NC AVG
39.8%
Rank
#57 / 104 | 345546 | ||||
| Perry Creek Health & Rehabilitation Center | NH SNF | Raleigh (Northeast Raleigh) | 90
Facility
90
NC AVG
72
Rank
#117 / 388 |
84.0%
Facility
84.0%
NC AVG
68
Rank
#81 / 240 | +24% | 3.81
Facility
3.81
NC AVG
3.98
Rank
#58 / 97 | +33% | -4% | $0
Facility
$0
NC AVG
$74.6k
Rank
#1 / 105 | 2
Facility
2
NC AVG
20.9
Rank
#8 / 101 | 2.0
Facility
2.0
NC AVG
5.0
Rank
#13 / 101 | - | 76 | - |
24
Facility
24
NC AVG
33
Rank
#350 / 573 | - | $10.3MFiscal year ending 12/2023
Facility
$10.3MFiscal year ending 12/2023
NC AVG
$13.2M
Rank
#69 / 104 | $5.5MFiscal year ending 12/2023
Facility
$5.5MFiscal year ending 12/2023
NC AVG
$4.9M
Rank
#80 / 104 | 53.1%Fiscal year ending 12/2023
Facility
53.1%Fiscal year ending 12/2023
NC AVG
39.8%
Rank
#59 / 104 | 345003 | ||||
| College Pines Health and Rehabilitation Center | NH SNF | Connelly Springs (Locust Street) | 100
Facility
100
NC AVG
72
Rank
#78 / 388 |
93.7%
Facility
93.7%
NC AVG
68
Rank
#44 / 240 | +38% | 3.98
Facility
3.98
NC AVG
3.98
Rank
#43 / 97 | -11% | 0% | $16.8k
Facility
$16.8k
NC AVG
$74.6k
Rank
#67 / 105 | 4
Facility
4
NC AVG
20.9
Rank
#12 / 101 | 2.0
Facility
2.0
NC AVG
5.0
Rank
#13 / 101 | 2 | 94 | - |
6
Facility
6
NC AVG
33
Rank
#485 / 573 | - | $14.2MFiscal year ending 12/2023
Facility
$14.2MFiscal year ending 12/2023
NC AVG
$13.2M
Rank
#51 / 104 | $6.4MFiscal year ending 12/2023
Facility
$6.4MFiscal year ending 12/2023
NC AVG
$4.9M
Rank
#43 / 104 | 45.2%Fiscal year ending 12/2023
Facility
45.2%Fiscal year ending 12/2023
NC AVG
39.8%
Rank
#23 / 104 | 345446 | ||||
| Capital Nursing And Rehabilitation Center | NH AL HOS IL | Raleigh (East Raleigh) | 125
Facility
125
NC AVG
72
Rank
#29 / 388 |
79.9%
Facility
79.9%
NC AVG
68
Rank
#103 / 240 | +18% | 3.43
Facility
3.43
NC AVG
3.98
Rank
#76 / 97 | +1% | -14% | $0
Facility
$0
NC AVG
$74.6k
Rank
#1 / 105 | 14
Facility
14
NC AVG
20.9
Rank
#50 / 101 | 2.8
Facility
2.8
NC AVG
5.0
Rank
#30 / 101 | - | 100 | - |
43
Facility
43
NC AVG
33
Rank
#207 / 573 | Liberty Commons Nursing And Rehabilitation Center Of Wake County, LLC | $12.0MFiscal year ending 09/2023
Facility
$12.0MFiscal year ending 09/2023
NC AVG
$13.2M
Rank
#61 / 104 | $6.2MFiscal year ending 09/2023
Facility
$6.2MFiscal year ending 09/2023
NC AVG
$4.9M
Rank
#52 / 104 | 51.3%Fiscal year ending 09/2023
Facility
51.3%Fiscal year ending 09/2023
NC AVG
39.8%
Rank
#22 / 104 | 345202 | ||||
| Zebulon Rehabilitation Center | NH RC SNF | Zebulon (West Gannon Avenue) | 60
Facility
60
NC AVG
72
Rank
#231 / 388 |
94.3%
Facility
94.3%
NC AVG
68
Rank
#39 / 240 | +39% | 3.24
Facility
3.24
NC AVG
3.98
Rank
#89 / 97 | -29% | -19% | $0
Facility
$0
NC AVG
$74.6k
Rank
#1 / 105 | 11
Facility
11
NC AVG
20.9
Rank
#39 / 101 | 3.7
Facility
3.7
NC AVG
5.0
Rank
#43 / 101 | - | 57 | - |
50
Facility
50
NC AVG
33
Rank
#150 / 573 | Gabriella Skillen | $8.1MFiscal year ending 12/2023
Facility
$8.1MFiscal year ending 12/2023
NC AVG
$13.2M
Rank
#89 / 104 | $3.8MFiscal year ending 12/2023
Facility
$3.8MFiscal year ending 12/2023
NC AVG
$4.9M
Rank
#96 / 104 | 46.4%Fiscal year ending 12/2023
Facility
46.4%Fiscal year ending 12/2023
NC AVG
39.8%
Rank
#71 / 104 | 345104 |
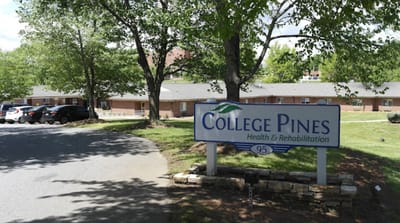
College Pines Health and Rehabilitation Center is located in Connelly Springs, North Carolina.
Here are the financial assistance programs available to residents in North Carolina.
College Pines Health and Rehabilitation Center is in the Locust Street neighborhood.
College Pines Health and Rehabilitation Center has a walk score of 6. Car-dependent. Most errands require a car, with limited nearby walkable options.
College Pines Health and Rehabilitation Center's occupancy is 88.6%.
No, College Pines Health and Rehabilitation Center has a no-pet policy.
College Pines Health and Rehabilitation Center is registered as a for-profit.
Yes — there are 2 photos of College Pines Health and Rehabilitation Center in the photo gallery on this page.
College Pines Health and Rehabilitation Center is located at 95 Locust St, Connelly Springs, NC 28612.
Care Cost Calculator: See Prices in Your Area
Nursing Home Data Explorer
Don’t Wait Too Long: 7 Red Flag Signs Your Parent Needs Assisted Living Now
The True Cost of Assisted Living in 2025 – And How Families Are Paying For It
Understanding Senior Living Costs: Pricing Models, Discounts & Financial Assistance


