Explore Open Rooms

1 Contact details
2 What type of senior care service are you looking for?
3 What budget do you have in mind for senior care?
4 How soon do you need to find care?
5 Additional details

Thank you for your interest!

Our team will be in touch shortly to help with next steps.

Nursing Home

Hillside Nursing & Rehab

Nursing Home

Hillside Nursing & Rehab

968 Wait Ave, Wake Forest, NC 27587 View map
Overview of Hillside Nursing & Rehab

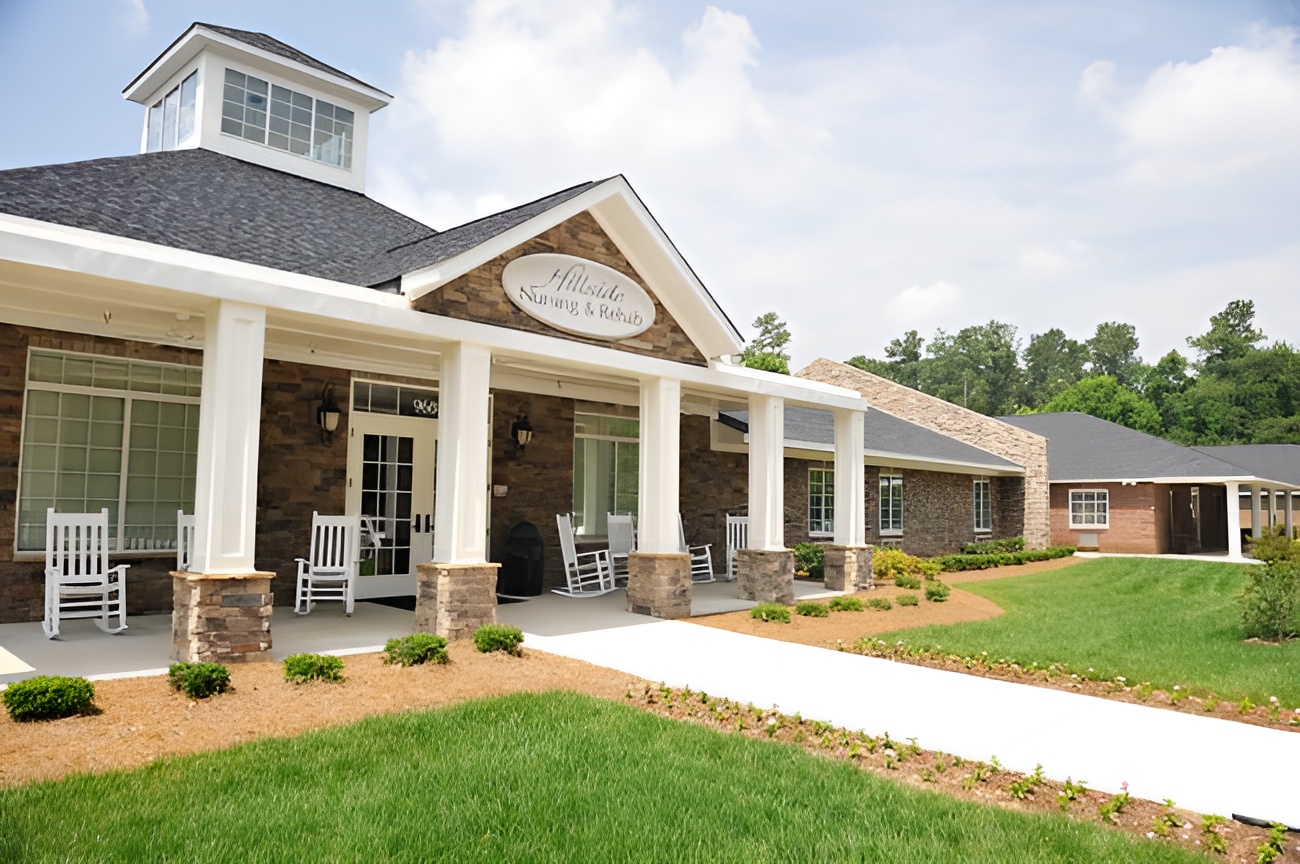
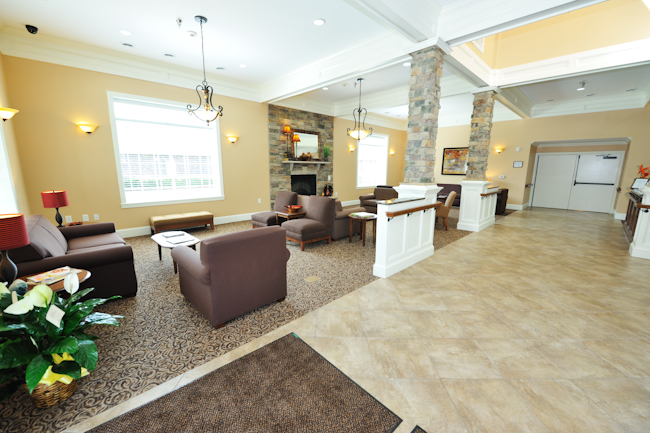
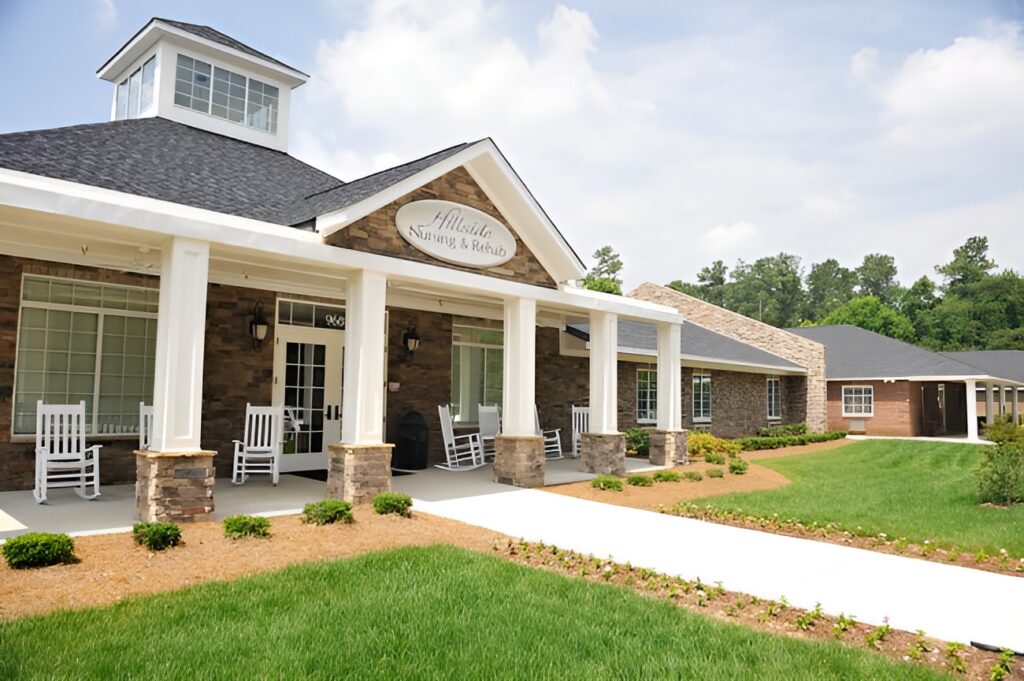
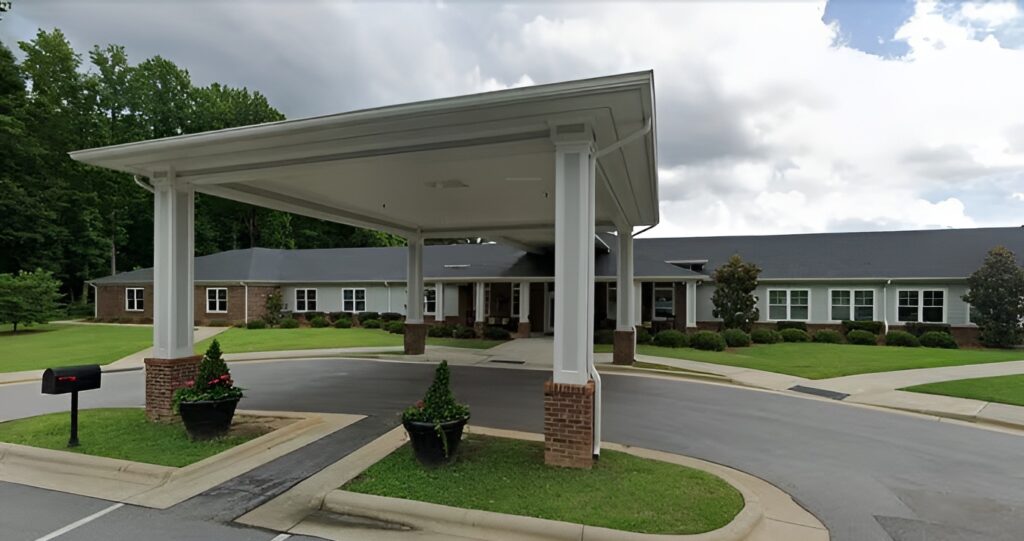
Enjoy an improved quality of life with Hillside Nursing & Rehab, a compassionate community in Wake Forest, NC, offering assisted living, rehabilitation, and skilled nursing services. Residents here are given a warm and comforting environment where they can receive round-the-clock care, supervision, and assistance with their daily living activities. Those living with chronic illnesses and require long-term care have access to comprehensive nursing care and physician services from Hillside’s Medical Directors.

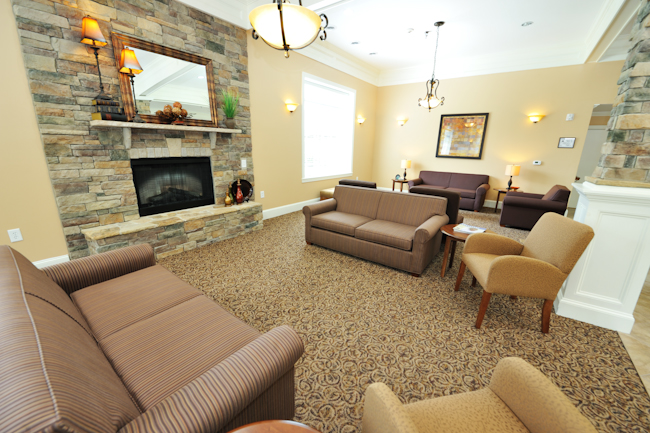
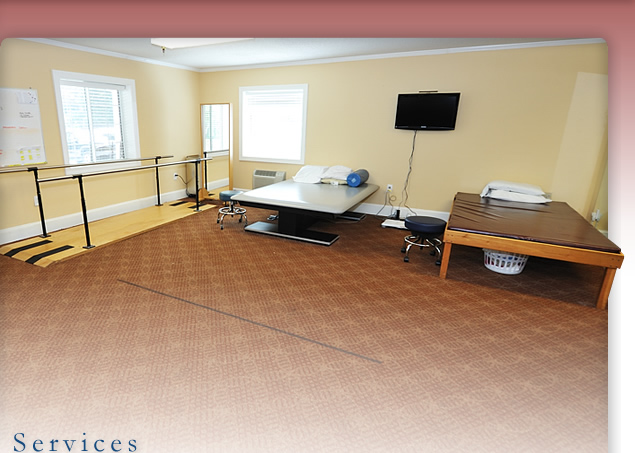
With access to physical, occupational, and speech therapy services, residents recovering from an injury or hospitalization can enjoy a quick and smooth healing journey in the community. They also feature a vibrant activity program designed to keep residents moving and actively engaged in their community. Proper nutrition is always observed by their registered dietitian who carefully curates residents’ meal plans. At Hillside Nursing & Rehab, residents are given diverse opportunities to enjoy life even as they face serious illness or recover from an injury.

(919) 556-4082

Managed by William Burroughs

Administrator

William Burroughs serves as the Administrator at Hillside Nursing and Rehab. He is the primary contact for the facility and is responsible for overseeing its operations and ensuring compliance with policies related to care and services.

Quality ratings

Measured by Centers for Medicare & Medicaid Services (CMS)

Overall rating Info The Overall CMS Rating combines results from health inspections, staffing levels and quality measures. Health inspections carry the most weight. Staffing and quality scores can increase or decrease the final rating based on performance compared to state and national standards.
5/5
North Carolina average: 3.5/5
Health Inspection Info Based on the results of the facility's three most recent standard inspections and any complaint investigations. CMS reviews the number, scope, and severity of deficiencies, with more recent findings weighted more heavily.
5/5
North Carolina average: 3.4/5
Staffing Info Measures average nursing staff hours per resident per day, including Registered Nurses (RNs) and total nursing staff. Ratings are adjusted based on the level of care residents require and are compared to state and national benchmarks.
3/5
North Carolina average: 3.3/5
Quality Measures Info Based on clinical and physical health indicators reported to CMS, such as hospital readmissions, falls, pressure ulcers, and improvements in mobility. These measures reflect how well residents' health needs are being managed.
2/5
North Carolina average: 3.7/5

Nursing care per resident

Info This shows how many total hours of nursing staff time are available per resident each day. Higher numbers usually mean more staff support.
4h 3m per day

This home provides 18% less nursing time per resident than the North Carolina average.

North Carolina average: 4h 57m per day

Staffing hours breakdown

Info Hours of care per resident per day, broken down by staff type. Data from CMS Medicare.
Staff type Facility State avg National avg
Registered Nurse (RN) Info Registered nurse hours per resident per day. 34m per day 35m per day 41m per day
Nurse Aide Info Nurse aide hours per resident per day. 2h 34m per day 2h 19m per day 2h 21m per day
Total Nursing (Weekend) Info Total number of nurse staff hours per resident per day on weekends. 3h 25m per day 3h 20m per day 3h 26m per day
Physical Therapist Info Physical therapist staff hours per resident per day. 9m per day 5m per day 4m per day
RN (Weekend) Info Registered nurse hours per resident per day on weekends. 26m per day 23m per day 29m per day

Capacity and availability

Medium-capacity home

Offers a balance of services and community atmosphere.

Total beds 150

This home usually has availability

Lower occupancy suggests more openings may be available.

Lower demand than the North Carolina average
Occupancy rate 74.1%
Residents per day (avg) 111
Occupancy rate
74.1%
Residents per day (avg)
111

Who this home usually serves

TYPE OF STAY

Mostly short-term rehab stays

Most residents typically stay for a few weeks or months before returning home or moving on.

Might be optimal for
Short stays Recovery Medicare-covered care

Breakdown by payment type

Medicare

73% of new residents, usually for short-term rehab.

Typical stay 1 months

Private pay

23% of new residents, often for short stays.

Typical stay 7 - 8 months

Medicaid

4% of new residents, often for long-term daily care.

Typical stay 4 years

Finances and operations

Privately-owned community
Operated by a business corporation.
Home revenue
$15.7M
Profit
$865.3K
Privately-owned community Operated by a business corporation.
Home revenue
$15,661,298.00
Profit
$865,280.00
Payroll costs Info The portion of the home's budget spent on staff, including nurses, caregivers, and other employees who support care and operations.
$7.0M
44.5% of revenue
Other operating costs Info All remaining costs needed to run the home, such as food, utilities, building maintenance, supplies and administrative expenses.
$7.8M
Total costs $14.8M
Walk Score
Walk Score: 19 / 100
Car-dependent. Most errands require a car, with limited nearby walkable options.
BBB Rating
BBB Rating: A+ (Not Accredited)
An independent rating from the Better Business Bureau based on factors such as complaint history, transparency, and business practices.
How BBB ratings work

About this community

Staffing

Key information about the people who lead and staff this community.

Leadership

Contact: Mr. Larry Celeste

Care Services

Nursing Services
Rehabilitation Services
Skilled Nursing
Licensed Nurses/CNAs
24-Hour Staffing
Short-Term Rehab

All Levels of Care

Skilled Nursing
Rehabilitation
Assisted Living
Outpatient Therapy

Amenities & Lifestyle

24-hour Licensed Supervision
Rehabilitative Services (Speech
Occupational
and Physical therapy)
Restorative Therapy
Stroke Rehabilitation
Post Operative Care
Wound Care Management
Pain Management
Therapeutic Diets
Scheduled Transportation
Physician services
Peripheral & PICC Lines
Enteral Nutrition via G-tube
Planned social functions
Full service on site beauty salon

Programs & Activities

Specific Programs
Extended stay skilled nursing care, Short-term/Post Acute Rehabilitative Services, Assisted Living, Out Patient Rehabilitation Services
Operating Hours
24 hours per day, seven days per week

What does this home offer?

Housing options icon

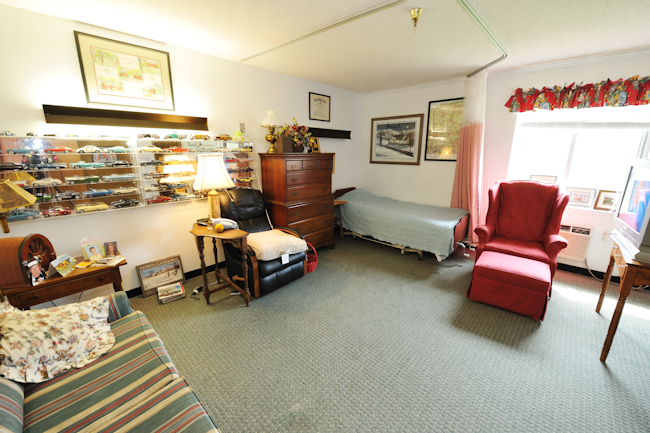
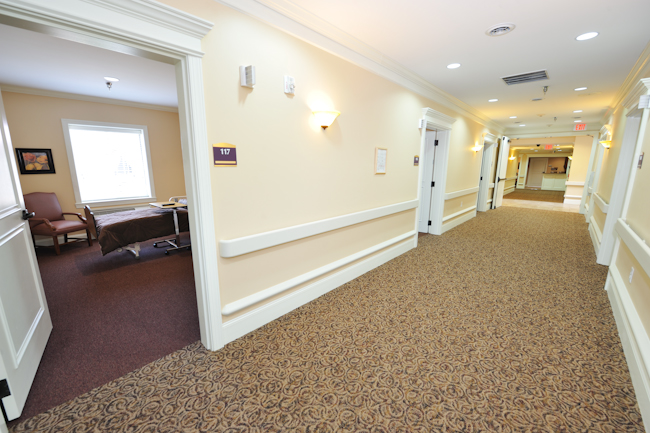
Housing Options: Private Rooms

Building type icon
Building type icon

Building Type: Single-story
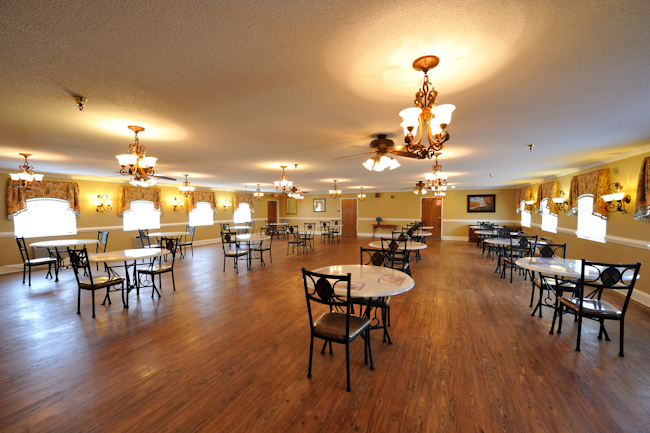
Dining services icon

Dining Services

Beauty services icon

Beauty Services

Transportation services icon

Transportation Services

Recreational activities icon

Recreational Activities

Exercise program icon

Exercise Programs

Types of Care at Hillside Nursing & Rehab

Nursing Home Assisted Living
Contact Hillside Nursing & Rehab

Inspection History

In North Carolina, the Department of Health and Human Services, Division of Health Service Regulation conducts unannounced surveys to ensure nursing and adult care homes meet safety standards.

3 visits/inspections

Results

1 with issues

2 without issues

Latest inspection

Date:September 5, 2025
Type:Annual Inspection

1 deficiency

Deficiencies indicate regulatory issues. A higher number implies the facility had several areas requiring improvement.

Health Inspection History

Inspections
Total health inspections 1

North Carolina average 4


Last Health inspection on Jun 2023

Total health citations 1

North Carolina average 20.9

Citations per inspection
1

North Carolina average 4.99


Health citations are formal notices following inspections when they fail to comply with safety and care standards.

All 1 citation resulted from standard inspections.

Breakdown of citation severity (last 3 years)
Critical Health citations More info 0
100% better than North Carolina average

North Carolina average: 1.3


Serious Health citations More info 0
100% better than North Carolina average

North Carolina average: 0.9

0 critical citations More info North Carolina average: 1.3

0 serious citations More info North Carolina average: 0.9

1 moderate citation More info North Carolina average: 17.1

0 minor citations More info North Carolina average: 1.6
Citations history (last 3 years)
Pharmacy moderate citation Info Issues related to medication management, including how drugs are stored, administered, and monitored. Jun 08, 2023
Corrected

Compare Nursing Homes around Wake County The information below is reported by the North Carolina Department of Health and Human Services, Division of Health Service Regulation.

5 facilities compared · CMS & NC Dept. of Health data · Updated Mar 2026

Hillside Nursing & Rehab
AL

Assisted Living A licensed, long-term care setting for seniors or individuals with disabilities who need help with daily activities — like bathing, dressing, and medication management — but not 24-hour skilled nursing. Offers housing, meals, and around-the-clock support while aiming to maximize resident independence.

NH

Nursing Home Licensed facility providing 24/7 skilled nursing care for residents with complex, ongoing medical needs. Staffed by RNs, LPNs, and CNAs. Inspected and star-rated annually by CMS. Accepts Medicare (short-term rehab) and Medicaid (long-term care).

Wake Forest
150
74.1%
-3%
4.05
+12%
+2%
0
1
0
111
A+
19
Clifton, Mary Margaret
$15,5M
$7,0M
45.1%
345417
Private Rooms
BellaRose Nursing and Rehab
NH

Nursing Home Licensed facility providing 24/7 skilled nursing care for residents with complex, ongoing medical needs. Staffed by RNs, LPNs, and CNAs. Inspected and star-rated annually by CMS. Accepts Medicare (short-term rehab) and Medicaid (long-term care).

Garner
100
92.0%
+20%
3.20
+24%
-20%
0
2
0
91
-
4
Burroughs, William
$16,4M
$7,0M
42.4%
345574
Private / Semi-Private Suites
Sunnybrook Rehabilitation Center
NH

Nursing Home Licensed facility providing 24/7 skilled nursing care for residents with complex, ongoing medical needs. Staffed by RNs, LPNs, and CNAs. Inspected and star-rated annually by CMS. Accepts Medicare (short-term rehab) and Medicaid (long-term care).

Raleigh (East Raleigh)
95
89.5%
+17%
3.86
+42%
-3%
4
15
4
86
-
49
Mcintyre, Hannah
$14,6M
$5,1M
35.2%
345077
Private / Semi-Private Suites
Litchford Falls Health & Rehabilitation Center
NH

Nursing Home Licensed facility providing 24/7 skilled nursing care for residents with complex, ongoing medical needs. Staffed by RNs, LPNs, and CNAs. Inspected and star-rated annually by CMS. Accepts Medicare (short-term rehab) and Medicaid (long-term care).

Raleigh (North Raleigh)
114
65.6%
-14%
3.53
-36%
-11%
2
16
3
86
-
51
Universal Health Care / Raleigh, Inc
$7,8M
$4,3M
55.4%
345499
Private / Shared Rooms
Perry Creek Health & Rehabilitation Center
-
NH

Nursing Home Licensed facility providing 24/7 skilled nursing care for residents with complex, ongoing medical needs. Staffed by RNs, LPNs, and CNAs. Inspected and star-rated annually by CMS. Accepts Medicare (short-term rehab) and Medicaid (long-term care).

Raleigh (Northeast Raleigh)
-
-
-
-
-
-
-
-
-
0
0
0
-
-
24
-
-
-
-
-
Private / Shared Rooms

Places of interest near Hillside Nursing & Rehab

Address 4.3 miles from city center
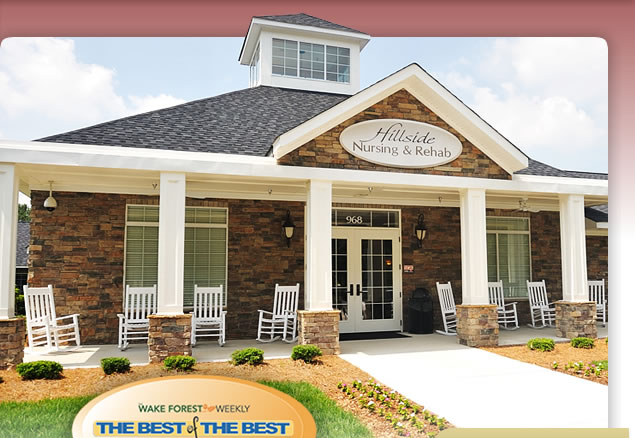
Address 968 Wait Ave, Wake Forest, NC 27587

Calculate Travel Distance to Hillside Nursing & Rehab

Add your location

Address

Staffing Data (Q2 2025)

This data corresponds to Q2 2025 and is based on CMS Payroll-Based Journal.

Total staff 158
Employees 156
Contractors 2
Staff to resident ratio 1.41:1
24% worse than North Carolina average

North Carolina average ratio: 1.85:1

Avg staff/day 64
Average shift 8.1 hours
0% compared with North Carolina average

North Carolina average: 8 hours

Total staff hours (quarter) 47,443
Nursing staff breakdown
Registered Nurse

Manages medical care and health needs.

Total count 16
Average shift length Info Average shift length. Calculated as total hours divided by days worked and average staff per day. 9.6 hours

This role is partially covered by contractors.

Licensed Practical Nurse

Assists with medical care and medications.

Total count 21
Average shift length Info Average shift length. Calculated as total hours divided by days worked and average staff per day. 9.1 hours

No contractors work on this role.

Certified Nursing Assistant

Helps with daily care and mobility.

Total count 82
Average shift length Info Average shift length. Calculated as total hours divided by days worked and average staff per day. 8 hours

No contractors work on this role.

Contractor staffing

Total hours from contractors

2.3%

1,102 contractor hours this quarter

Registered Nurse: 2
Staff by category
Certified Nursing Assistant8208225,35991100%8
Licensed Practical Nurse210217,93191100%9.1
Registered Nurse142163,69291100%9.6
RN Director of Nursing4041,8557886%8.3
Respiratory Therapy Technician6061,7747785%7.1
Medication Aide/Technician4049898695%10.8
Physical Therapy Assistant4049387785%5.5
Physical Therapy Aide4048616875%6.5
Clinical Nurse Specialist3037656268%9.2
Speech Language Pathologist4047238189%6.3
Dietitian2025947077%7.8
Mental Health Service Worker2025336875%7.8
Administrator1015206571%8
Nurse Practitioner1015206571%8
Qualified Social Worker4043896673%5.2
82 Certified Nursing Assistant
% of Days 100%
21 Licensed Practical Nurse
% of Days 100%
16 Registered Nurse
% of Days 100%
4 RN Director of Nursing
% of Days 86%
6 Respiratory Therapy Technician
% of Days 85%
4 Medication Aide/Technician
% of Days 95%
4 Physical Therapy Assistant
% of Days 85%
4 Physical Therapy Aide
% of Days 75%
3 Clinical Nurse Specialist
% of Days 68%
4 Speech Language Pathologist
% of Days 89%
2 Dietitian
% of Days 77%
2 Mental Health Service Worker
% of Days 75%
1 Administrator
% of Days 71%
1 Nurse Practitioner
% of Days 71%
4 Qualified Social Worker
% of Days 73%

Facility Characteristics

Source: CMS Long-Term Care Facility Characteristics (Data as of Jan 2026)

Total census
112 residents
Residents by payment source
Medicare
25 residents (22.3%)
Medicaid
54 residents (48.2%)
Private pay or other
33 residents (29.5%)
Programs & Services
Residents' Group

Residents meet regularly to discuss policies, care quality, and activities

Active Resident Council

Organized group of residents that meets regularly to discuss facility policies, quality of life, and activities.

Quality of care over time

These measures show how residents usually do over time at this home, based on health outcomes and preventive care.

High-risk clinical events score Info A composite score based on pressure ulcers, falls with injury, weight loss, walking ability decline, and activities of daily living decline. 21.3
86% worse than North Carolina average

North Carolina average: 11.5

Functional decline score Info A composite score based on activities of daily living decline, walking ability decline, and incontinence. 36.2
75% worse than North Carolina average

North Carolina average: 20.6

Long-stay resident measures
Significantly below average North Carolina avg: 2.9 Info CMS star rating based on long-stay quality measure performance. 5 stars = significantly above average, 1 star = significantly below average.
Need for Help with Daily Activities Increased Info Percent of long-stay residents whose need for help with daily activities has increased 32.0%
82% worse than North Carolina average

North Carolina average: 17.5%

Walking Ability Worsened Info Percent of long-stay residents whose ability to move independently worsened 52.7%
127% worse than North Carolina average

North Carolina average: 23.3%

Low Risk Residents with Bowel/Bladder Incontinence Info Percent of low risk long-stay residents who lose control of their bowels or bladder 23.9%
12% worse than North Carolina average

North Carolina average: 21.4%

Falls with Major Injury Info Percent of long-stay residents experiencing one or more falls with major injury 5.6%
54% worse than North Carolina average

North Carolina average: 3.6%

High Risk Residents with Pressure Ulcers Info Percent of long-stay high risk residents with pressure ulcers 6.1%
In line with North Carolina average

North Carolina average: 6.3%

Urinary Tract Infection Info Percent of long-stay residents with a urinary tract infection 2.8%
8% worse than North Carolina average

North Carolina average: 2.6%

Lost Too Much Weight Info Percent of long-stay residents who lose too much weight 10.0%
36% worse than North Carolina average

North Carolina average: 7.4%

Depressive Symptoms Info Percent of long-stay residents who have depressive symptoms 0.0%
100% better than North Carolina average

North Carolina average: 4.4%

Antipsychotic Use Info Percent of long-stay residents who received an antipsychotic medication 14.9%
11% worse than North Carolina average

North Carolina average: 13.4%

Pneumococcal Vaccine Info Percent of long-stay residents assessed and appropriately given the pneumococcal vaccine 97.5%
6% better than North Carolina average

North Carolina average: 91.6%

Influenza Vaccine Info Percent of long-stay residents assessed and appropriately given the seasonal influenza vaccine 100.0%
6% better than North Carolina average

North Carolina average: 94.1%

Hospitalizations per 1,000 days Info Number of hospitalizations per 1,000 long-stay resident days. 3.26
84% worse than North Carolina average

North Carolina average: 1.77

ED visits per 1,000 days Info Number of outpatient emergency department visits per 1,000 long-stay resident days. 1.28
30% better than North Carolina average

North Carolina average: 1.82

Short-stay resident measures
Above average North Carolina avg: 2.7 Info CMS star rating based on short-stay quality measure performance. 5 stars = much above average, 1 star = much below average.
Pneumococcal Vaccine Info Percent of short-stay residents assessed and appropriately given the pneumococcal vaccine 88.2%
10% better than North Carolina average

North Carolina average: 79.9%

Antipsychotic medication increase Info Percent of short-stay residents who newly received an antipsychotic medication 1.6%
In line with North Carolina average

North Carolina average: 1.5%

Influenza Vaccine Info Percent of short-stay residents assessed and appropriately given the seasonal influenza vaccine 78.9%
In line with North Carolina average

North Carolina average: 78.1%

Re-hospitalized after SNF stay Info Percentage of short-stay residents who were re-hospitalized after their nursing home admission. 33.7%
47% worse than North Carolina average

North Carolina average: 22.9%

Emergency department visits Info Percentage of short-stay residents who had an outpatient emergency department visit. 8.1%
39% better than North Carolina average

North Carolina average: 13.2%

Falls with major injury Info Percentage of SNF residents who experience falls with major injury during their stay. 0.8%
In line with North Carolina average

North Carolina average: 0.8%

Ability to care for self at discharge Info Percentage of residents at or above expected ability to care for themselves at discharge. 59.4%
11% better than North Carolina average

North Carolina average: 53.7%

Successful return to home or community Info Rate of successful return to home or community from a skilled nursing facility. 54.9%
9% better than North Carolina average

North Carolina average: 50.6%

Guides for Better Senior Living

Care Cost Calculator: See Prices in Your Area

Nursing Home Data Explorer

Don’t Wait Too Long: 7 Red Flag Signs Your Parent Needs Assisted Living Now

The True Cost of Assisted Living in 2025 – And How Families Are Paying For It

Understanding Senior Living Costs: Pricing Models, Discounts & Financial Assistance

Financial Aid for North Carolina Seniors

Get financial aid guidance

Community Alternatives Program for Disabled Adults

NC Medicaid CAP/DA

Age 65+ or disabled, North Carolina resident, Medicaid- eligible, nursing home-level care need.

~$2,829/month (300% FBR, individual).

$2,000 (individual), $3,000 (couple).

High demand; waitlists common in urban areas.

North Carolina Senior Care Options

NC SCO (via NFCSP)

Caregiver of someone 60+ (or with dementia), North Carolina resident.

No strict limit; prioritizes low-income.

Not applicable.

Limited slots; rural/urban balance.

Program of All-Inclusive Care for the Elderly (PACE)

North Carolina PACE (e.g., PACE of the Triad)

Age 55+, NC resident (specific counties), NFLOC, safe with PACE support.

~$2,829/month (Medicaid-eligible); private pay option available.

$2,000 (individual), $3,000 (couple) for Medicaid enrollees.

Available in 10+ counties (e.g., Guilford, Wake); multiple providers (e.g., PACE of the Southern Piedmont).

In-Home Aide Services

North Carolina In-Home Aide Services

Age 60+, NC resident, unable to perform 1+ ADL, at risk of nursing home placement.

No strict cap; prioritizes low-income (~$24,980/year).

Not assessed; need-based.

Family can be aides; varies by county funding.

Medicare Savings Program (MSP)

North Carolina Medicare Savings Program

Age 65+ or disabled, NC resident, Medicare Part A/B.

~$2,510/month (QMB), ~$3,380/month (SLMB), ~$3,598/month (QI)—individual.

$9,430 (individual), $14,130 (couple).

Three tiers; no waitlist; includes Extra Help for Part D.

Low-Income Energy Assistance Program (LIHEAP)

North Carolina LIHEAP

Age 60+ prioritized, NC resident, low-income household.

~$3,970/month (individual, 185% FPL).

Not assessed; income-focused.

Covers oil, gas, electric; emergency aid via Crisis Intervention Program (CIP).

Senior Community Service Employment Program (SCSEP)

North Carolina SCSEP

Age 55+, unemployed, low-income, NC resident.

~$1,983/month (125% FPL).

Not specified; income-focused.

Priority for veterans, rural residents; AARP partnership.

VA Aid and Attendance (A&A) and Housebound Benefits

North Carolina VA Aid and Attendance/Housebound

Age 65+ or disabled veteran/spouse, NC resident, wartime service, need for ADL help (A&A) or homebound.

Net income < ~$1,984/month (veteran with dependent, A&A); pension offsets income.

~$155,356 (net worth limit).

High veteran demand in rural/urban areas.

Urgent Repair Program (URP)

North Carolina Urgent Repair Program

Age 60+ prioritized, NC resident, homeowner, low-income.

~$30,258/year (50% AMI, varies by county).

Not strictly assessed; home value considered.

Forgivable at $2,000/year; statewide via local partners.

State/County Special Assistance (SA)

North Carolina Special Assistance

Age 65+ (or disabled), NC resident, in licensed adult care home, low-income.

~$1,255/month (individual, 100% FPL); varies by facility rate.

$2,000 (individual).

Covers assisted living; counties supplement state funds.

Tour Icon
Planning a tour? Check our touring checklist.
Chat Icon
Thinking of living here? We can help you speak to a current resident