Litchford Falls Health & Rehabilitation Center
CMS overall rating Info CMS (the Centers for Medicare & Medicaid Services) is the federal agency that rates nursing home quality. Its Overall Rating runs from 1 to 5 stars, combining health inspections, staffing, and quality measures, with inspections weighted most heavily.

Litchford Falls Health & Rehabilitation Center

CMS overall rating Info CMS (the Centers for Medicare & Medicaid Services) is the federal agency that rates nursing home quality. Its Overall Rating runs from 1 to 5 stars, combining health inspections, staffing, and quality measures, with inspections weighted most heavily.
Calculator: See prices in your area
Litchford Falls Health & Rehabilitation Center accepts Medicare, Medicaid, and private pay.

Overview of Litchford Falls Health & Rehabilitation Center

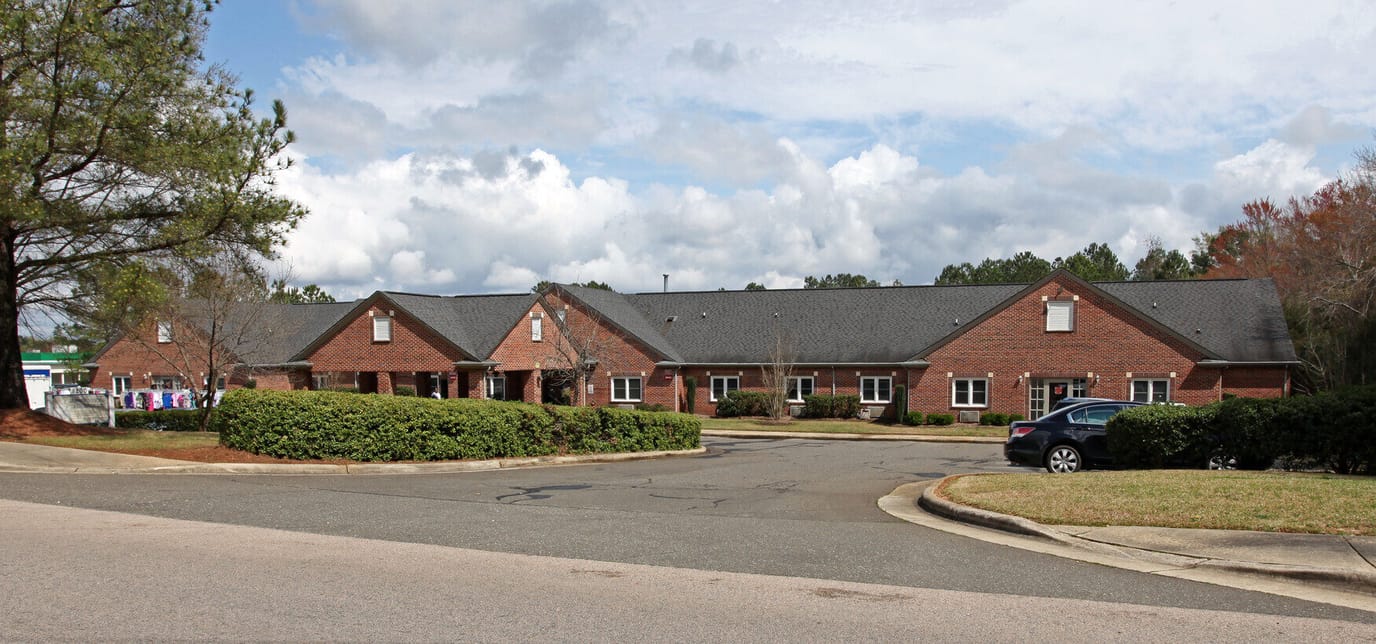
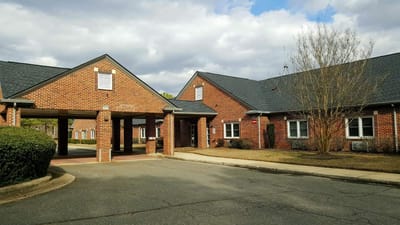
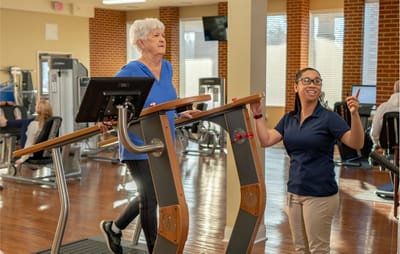
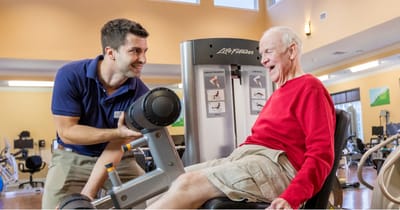
Maintain your maximum potential with Litchford Falls Health & Rehabilitation Center, a dedicated community in Raleigh, NC for those needing short-term rehabilitation and long-term care. Their compassionate and reliable care rehab team uses advanced therapy technology and equipment to help residents achieve excellent outcomes from their rehabilitation journey. Physicians and nursing team members are also available to help residents living with chronic illnesses or requiring more complex care services maintain a high quality of life.

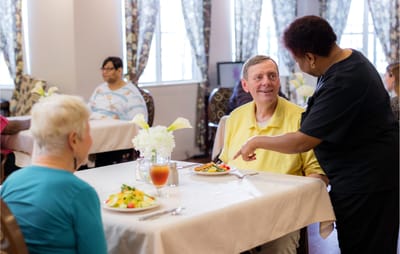
Bright and spacious accommodations are provided with housekeeping and maintenance services, ensuring residents remain in a safe and organized environment without the hassles. Meals are prepared by talented chefs and served restaurant-style in a cozy dining room. With an array of activities designed based on residents’ abilities and interests, residents can make the most of their lives even as they recover or face the challenges of a health condition.

Quality ratings

Measured by Centers for Medicare & Medicaid Services (CMS)

Overall rating Info The Overall CMS Rating combines results from health inspections, staffing levels and quality measures. Health inspections carry the most weight. Staffing and quality scores can increase or decrease the final rating based on performance compared to state and national standards.
▼ 64.2% Below NC avg. ▼ 64.2% Below NC avg.NC average: 2.8Click the badge to see the full State ranking.Click here to see the full State ranking.
Health Inspection Info Based on the results of the facility's three most recent standard inspections and any complaint investigations. CMS reviews the number, scope, and severity of deficiencies, with more recent findings weighted more heavily.
▼ 29.2% Below NC avg. ▼ 29.2% Below NC avg.NC average: 2.8Click the badge to see the full State ranking.Click here to see the full State ranking.
Staffing Info Measures average nursing staff hours per resident per day, including Registered Nurses (RNs) and total nursing staff. Ratings are adjusted based on the level of care residents require and are compared to state and national benchmarks.
▼ 62.4% Below NC avg. ▼ 62.4% Below NC avg.NC average: 2.7Click the badge to see the full State ranking.Click here to see the full State ranking.
Quality Measures Info Based on clinical and physical health indicators reported to CMS, such as hospital readmissions, falls, pressure ulcers, and improvements in mobility. These measures reflect how well residents' health needs are being managed.
▼ 37.0% Below NC avg. ▼ 37.0% Below NC avg.NC average: 3.2Click the badge to see the full State ranking.Click here to see the full State ranking.

Staffing hours breakdown

Info Daily nursing hours per resident by staff type, reported to CMS. Higher is generally better — compare this facility to state and national averages to see where staffing stands.

Hours per resident per day — compared to North Carolina state averages

Total nursing care / resident Info This home is ranked 73rd out of 97 homes in North Carolina for nurse hours. Total adjusted nursing hours per resident per day, combining RN, LPN, and aide time. CMS adjusts this for case-mix so facilities can be fairly compared.
3h 32m per day
Rank #73 / 97Nurse hours — State benchmarkedThis home is ranked 73rd out of 97 homes in North Carolina. Shows adjusted nurse hours per resident per day benchmarked to the North Carolina average, with a ranking across 97 North Carolina facilities. More hours mean more direct care. The national average is about 3.5 hrs; below 3.0 is a red flag.Rankings are based only on facilities in North Carolina that report data for that category. Facilities without available data are excluded from the ranking.Click the rank badge to see the full State ranking.Click here to see the full State ranking.
This facility North Carolina avg (3h 59m per day)
vs North Carolina avg
-11%

2 of 6 metrics below state avg

Standout metric Physical Therapist is +58% above state avg
Staff typeHours / Day / Residentvs state avg
Registered Nurse (RN) Info RNs hold the highest nursing license and can assess residents, interpret test results, and direct care plans. More RN hours per day often signals stronger clinical oversight and faster response to health changes. 27m per day ▼ 22% State avg: 35m per day · National avg: 41m per day
LPN / LVN Info Licensed Practical Nurses (LPNs) or Licensed Vocational Nurses (LVNs) deliver routine hands-on care — medication administration, wound dressing, and monitoring vital signs. They work under RN supervision and make up a large share of daily bedside care. 50m per day ▼ 3% State avg: 52m per day · National avg: 52m per day
Nurse Aide Info Certified Nurse Aides (CNAs) provide the most direct day-to-day assistance: bathing, dressing, feeding, and mobility. Nurse aide hours are typically the largest staffing category and directly affect residents' quality of life. 2h 18m per day ■ Avg State avg: 2h 19m per day · National avg: 2h 21m per day
Weekend Total Nursing Info Combined nursing hours (RN + LPN + Nurse Aide) per resident per day on weekends. Staffing often drops on weekends — this figure reveals whether the facility maintains adequate coverage outside of weekday hours. 3h 18m per day ■ Avg State avg: 3h 20m per day · National avg: 3h 26m per day
Physical Therapist Info Hours per resident per day provided by licensed Physical Therapists (PTs) or PT Assistants. PT services help residents recover mobility after injury or illness and are especially important for post-acute (short-stay) rehabilitation. 8m per day ▲ 58% State avg: 5m per day · National avg: 4m per day
Weekend RN Info Registered nurse hours specifically on weekends. Facilities sometimes reduce RN presence on Saturdays and Sundays — a low weekend RN figure compared to weekday hours can indicate reduced clinical oversight when most administrative staff are absent. 23m per day ■ Avg State avg: 23m per day · National avg: 29m per day

Capacity and availability

This home usually has availability

Lower occupancy than the North Carolina average: 76.4%
Occupancy rate
65.6% Rank #174 / 271Occupancy rate — State benchmarkedThis home is ranked 174th out of 271 homes in North Carolina. Shows this facility's occupancy rate versus the North Carolina average, with its Statewide rank out of 271. Higher occupancy signals strong local demand and financial stability.Rankings are based only on facilities in North Carolina that report data for that category. Facilities without available data are excluded from the ranking.Click the rank badge to see the full State ranking.Click here to see the full State ranking.
Avg. Length of Stay
87 days
Bed community size
90-bed community Rank #119 / 390Bed count — State benchmarkedThis home is ranked 119th out of 390 homes in North Carolina. Shows this facility's certified or reported bed count compared to other North Carolina facilities. Larger communities may offer more amenities, programs, and on-site services for residents and families.Rankings are based only on facilities in North Carolina that report data for that category. Facilities without available data are excluded from the ranking.Click the rank badge to see the full State ranking.Click here to see the full State ranking.
A larger shared setting that may offer more common spaces and organized community services.
Walk Score
Walk Score: 51 / 100 Rank #137 / 572Walk Score — State benchmarkedThis home is ranked 137th out of 572 homes in North Carolina. Shows how walkable this facility's neighborhood is compared to the average Walk Score across North Carolina facilities. Higher scores benefit residents, families, and staff.Rankings are based only on facilities in North Carolina that report data for that category. Facilities without available data are excluded from the ranking.Click the rank badge to see the full State ranking.Click here to see the full State ranking.
Moderately walkable. Some errands can be accomplished on foot, with a mix of nearby amenities.

Therapy & Rehabilitation

1 service
Rehabilitation Services

Amenities & Lifestyle

State-Of-The-Art Gym
Restaurant-Style Dining
Culture Of Caring
Specific ProgramsLifeWorks Rehab, Center Features, Options for Care, Recovery from Planned Surgeries, Recovery from Accidents & Illnesses

Contact Litchford Falls Health & Rehabilitation Center

Staffing Data

Reporting period: October 1 – December 31, 2025 (Q4 2025). Source: CMS Payroll-Based Journal report.

Total staff 167
Employees 149
Contractors 18
Staff to resident ratio 1.90 : 1
5% more staff per resident than North Carolina average
North Carolina average ratio: 1.80 : 1 North Carolina average ratio: 1.80 : 1See full North Carolina ranking
Avg staff/day 49
Average shift 7.7 hours
0% compared with North Carolina average
North Carolina average: 8 hours North Carolina average shift: 8 hoursSee full North Carolina ranking
Total staff hours (quarter) 34,568

Nursing staff breakdown

Q4 2025 · Oct 1 – Dec 31 More info This data comes from the CMS Payroll-Based Journal report covering October 1 – December 31, 2025.
Registered Nurse

Manages medical care and health needs.

RN Staff Info All 10 RN Staff are full-time employees. No contractors work on this role. 10
Average shift length Info Average shift length. Calculated as total hours divided by days worked and average staff per day. 8.2 hours
Licensed Practical Nurse

Assists with medical care and medications.

LPN Staff Info 31 total: 24 full-time employees and 7 contractors. 31
Average shift length Info Average shift length. Calculated as total hours divided by days worked and average staff per day. 7.6 hours
Certified Nursing Assistant

Helps with daily care and mobility.

CNA Staff Info 66 total: 55 full-time employees and 11 contractors. 66
Average shift length Info Average shift length. Calculated as total hours divided by days worked and average staff per day. 7.9 hours

Contractor staffing

Q4 2025 · Oct 1 – Dec 31 More info This data comes from the CMS Payroll-Based Journal report covering October 1 – December 31, 2025.

Total hours from contractors

1.1%

389 contractor hours this quarter

Certified Nursing Assistant: 11 Licensed Practical Nurse: 7

Staff by category

Q4 2025 · Oct 1 – Dec 31 More info This data comes from the CMS Payroll-Based Journal report covering October 1 – December 31, 2025.
Certified Nursing Assistant55116616,33892100%7.9
Licensed Practical Nurse247315,81892100%7.6
Medication Aide/Technician4041,77092100%9.8
Registered Nurse100101,7249199%8.2
Clinical Nurse Specialist9091,53492100%7.4
Respiratory Therapy Technician8081,0418087%6.7
Physical Therapy Aide9099998592%6.7
Speech Language Pathologist6069847177%6.5
RN Director of Nursing3037866571%7.6
Physical Therapy Assistant6065917683%6.6
Qualified Social Worker7075056874%6.5
Dental Services Staff1014996874%7.3
Other Dietary Services Staff1014405762%7.7
Administrator2024395863%7.4
Dietitian1014295762%7.5
Nurse Practitioner2023504852%7.3
Mental Health Service Worker1013224347%7.5
66 Certified Nursing Assistant
% of Days 100%
31 Licensed Practical Nurse
% of Days 100%
4 Medication Aide/Technician
% of Days 100%
10 Registered Nurse
% of Days 99%
9 Clinical Nurse Specialist
% of Days 100%
8 Respiratory Therapy Technician
% of Days 87%
9 Physical Therapy Aide
% of Days 92%
6 Speech Language Pathologist
% of Days 77%
3 RN Director of Nursing
% of Days 71%
6 Physical Therapy Assistant
% of Days 83%
7 Qualified Social Worker
% of Days 74%
1 Dental Services Staff
% of Days 74%
1 Other Dietary Services Staff
% of Days 62%
2 Administrator
% of Days 63%
1 Dietitian
% of Days 62%
2 Nurse Practitioner
% of Days 52%
1 Mental Health Service Worker
% of Days 47%

Penalties and fines

Includes penalties issued in 2023-2024

Federal penalties imposed by CMS for regulatory violations, including civil money penalties (fines) and denials of payment for new Medicare/Medicaid admissions.

Source: CMS Penalties Database (Data as of Jan 2026)

Total fines amount $169K Rank #99 / 105Federal fines — State benchmarkedThis home is ranked 99th out of 105 homes in North Carolina. Shows this facility's cumulative CMS federal fine dollars versus the North Carolina average among facilities with fines, and where it ranks among 105 facilities in the pool. Lower total dollars mean a better rank.Rankings are based only on facilities in North Carolina that report data for that category. Facilities without available data are excluded from the ranking.Click the rank badge to see the full State ranking.Click here to see the full State ranking.
122% higher than North Carolina average

North Carolina average: $76K

Number of fines 2
15% fewer fines than North Carolina average

North Carolina average: 2.3

Payment Denials Info Serious action where Medicare and/or Medicaid temporarily stops payments for new residents until issues are fixed. 0
100% fewer payment denials than North Carolina average

North Carolina average: 0.4

Fines amount comparison
This facility $169K
North Carolina average $76K
Penalty History

Penalties are imposed by CMS for violations of federal nursing home regulations.

2 penalties in the past 3 years

Multiple penalties were reported in the last 3 years.

Civil Money Penalty Info Fines imposed for noncompliance, which can be assessed per day or per instance of violation. Dec 17, 2024
$165K
Civil Money Penalty Info Fines imposed for noncompliance, which can be assessed per day or per instance of violation. Sep 28, 2023
$4K

Last updated: Jan 2026

Quality of care over time

These measures show how residents usually do over time at this home, based on health outcomes and preventive care.

High-risk clinical events score Info A composite score based on pressure ulcers, falls with injury, weight loss, walking ability decline, and activities of daily living decline. 14.2
24% worse than North Carolina average

North Carolina average: 11.5

Functional decline score Info A composite score based on activities of daily living decline, walking ability decline, and incontinence. 22.5
9% worse than North Carolina average

North Carolina average: 20.6

Long-stay resident measures
Below average North Carolina avg: 2.9 Info CMS star rating based on long-stay quality measure performance. 5 stars = significantly above average, 1 star = significantly below average.
Need for Help with Daily Activities Increased Info Percent of long-stay residents whose need for help with daily activities has increased 15.6%
11% better than North Carolina average

North Carolina average: 17.5%

Walking Ability Worsened Info Percent of long-stay residents whose ability to move independently worsened 36.3%
56% worse than North Carolina average

North Carolina average: 23.3%

Low Risk Residents with Bowel/Bladder Incontinence Info Percent of low risk long-stay residents who lose control of their bowels or bladder 15.6%
27% better than North Carolina average

North Carolina average: 21.4%

Falls with Major Injury Info Percent of long-stay residents experiencing one or more falls with major injury 5.0%
37% worse than North Carolina average

North Carolina average: 3.6%

High Risk Residents with Pressure Ulcers Info Percent of long-stay high risk residents with pressure ulcers 4.5%
29% better than North Carolina average

North Carolina average: 6.3%

Urinary Tract Infection Info Percent of long-stay residents with a urinary tract infection 0.9%
65% better than North Carolina average

North Carolina average: 2.6%

Lost Too Much Weight Info Percent of long-stay residents who lose too much weight 9.5%
28% worse than North Carolina average

North Carolina average: 7.4%

Depressive Symptoms Info Percent of long-stay residents who have depressive symptoms 11.8%
169% worse than North Carolina average

North Carolina average: 4.4%

Antipsychotic Use Info Percent of long-stay residents who received an antipsychotic medication 11.4%
15% better than North Carolina average

North Carolina average: 13.4%

Pneumococcal Vaccine Info Percent of long-stay residents assessed and appropriately given the pneumococcal vaccine 74.2%
19% worse than North Carolina average

North Carolina average: 91.6%

Influenza Vaccine Info Percent of long-stay residents assessed and appropriately given the seasonal influenza vaccine 100.0%
6% better than North Carolina average

North Carolina average: 94.1%

Hospitalizations per 1,000 days Info Number of hospitalizations per 1,000 long-stay resident days. 2.36
33% worse than North Carolina average

North Carolina average: 1.77

ED visits per 1,000 days Info Number of outpatient emergency department visits per 1,000 long-stay resident days. 2.28
25% worse than North Carolina average

North Carolina average: 1.82

Short-stay resident measures
Significantly below average North Carolina avg: 2.9 Info CMS star rating based on short-stay quality measure performance. 5 stars = much above average, 1 star = much below average.
Pneumococcal Vaccine Info Percent of short-stay residents assessed and appropriately given the pneumococcal vaccine 76.3%
In line with North Carolina average

North Carolina average: 79.9%

Antipsychotic medication increase Info Percent of short-stay residents who newly received an antipsychotic medication 1.8%
24% worse than North Carolina average

North Carolina average: 1.5%

Influenza Vaccine Info Percent of short-stay residents assessed and appropriately given the seasonal influenza vaccine 83.0%
6% better than North Carolina average

North Carolina average: 78.1%

Re-hospitalized after SNF stay Info Percentage of short-stay residents who were re-hospitalized after their nursing home admission. 27.8%
21% worse than North Carolina average

North Carolina average: 22.9%

Emergency department visits Info Percentage of short-stay residents who had an outpatient emergency department visit. 17.1%
30% worse than North Carolina average

North Carolina average: 13.2%

Falls with major injury Info Percentage of SNF residents who experience falls with major injury during their stay. 1.7%
117% worse than North Carolina average

North Carolina average: 0.8%

Ability to care for self at discharge Info Percentage of residents at or above expected ability to care for themselves at discharge. 70.9%
32% better than North Carolina average

North Carolina average: 53.7%

Successful return to home or community Info Rate of successful return to home or community from a skilled nursing facility. 56.0%
11% better than North Carolina average

North Carolina average: 50.6%

Breakdown by payment type

Medicare

33% of new residents, usually for short-term rehab.

Typical stay 29 days

Private pay

61% of new residents, often for short stays.

Typical stay 1 - 2 months

Medicaid

5% of new residents, often for long-term daily care.

Typical stay 2 - 3 years

Facility Characteristics

Source: CMS Long-Term Care Facility Characteristics (Data as of Jan 2026)

Total residents 88
Medicare
29
33% of residents
Medicaid
38
43.2% of residents
Private pay or other
21
23.9% of residents
Programs & Services
Residents Group

Residents meet regularly to discuss policies, care quality, and activities

Active Resident Council

Organized group of residents that meets regularly to discuss facility policies, quality of life, and activities.

Finances and operations

Based on CMS SNF Cost Report for fiscal year ending in 12/2023.

For-profit
Operated by a single business entity.
Net patient revenue Info Net patient revenue — what the home actually collects for resident care, after contractual allowances, bad debt and discounts are subtracted from its gross charges (CMS cost report, Worksheet G-3). It covers resident care only; money the home earns from other sources is shown separately as "Other income."
$9.1M
Net patient income Info Net patient income: net patient revenue minus the home's total operating expenses. A positive figure means it earns more from resident care than it spends to deliver it; a negative figure means the opposite. It excludes non-operating "other income."
-$330.2K
For-profit Operated by a single business entity.
Net patient revenue Info Net patient revenue — what the home actually collects for resident care, after contractual allowances, bad debt and discounts are subtracted from its gross charges (CMS cost report, Worksheet G-3). It covers resident care only; money the home earns from other sources is shown separately as "Other income."
$9.1M Rank #97 / 104Revenue — State benchmarkedThis home is ranked 97th out of 104 homes in North Carolina. Shows this facility's annual revenue compared to the North Carolina average. Higher revenue generally means more resources for staffing and capital — read alongside Payroll %.Rankings are based only on facilities in North Carolina that report data for that category. Facilities without available data are excluded from the ranking.Click the rank badge to see the full State ranking.Click here to see the full State ranking.
Net patient income Info Net patient income: net patient revenue minus the home's total operating expenses. A positive figure means it earns more from resident care than it spends to deliver it; a negative figure means the opposite. It excludes non-operating "other income."
-$330.2K
Other income Info Money the home earns outside of resident care — such as investments, grants, rentals and other non-operating sources (CMS cost report, Worksheet G-3). It is tracked separately from net patient revenue: it is not part of that figure, and it is not included in net patient income.
$276.2K
Payroll costs Info Staff salaries plus wage-related costs — benefits such as payroll taxes, health insurance and retirement — from the home's own accounting records (CMS cost report, Worksheet A). Contract or agency labor is counted separately, under other operating costs. Rank #85 / 104Payroll — State benchmarkedThis home is ranked 85th out of 104 homes in North Carolina. Shows total annual staff payroll benchmarked to the North Carolina average. Higher payroll investment relative to peers often signals better staffing and less reliance on cheaper contract labor.Rankings are based only on facilities in North Carolina that report data for that category. Facilities without available data are excluded from the ranking.Click the rank badge to see the full State ranking.Click here to see the full State ranking.
$5.0M 54.5% of net patient revenue Info Payroll as a share of revenue: staff salaries and wage-related benefits divided by net patient revenue. A higher figure means more of each revenue dollar goes to staff pay. Rank #10 / 104Payroll % — State benchmarkedThis home is ranked 10th out of 104 homes in North Carolina. Shows payroll as a percentage of revenue versus the North Carolina average. Well-run North Carolina facilities typically land around 49–62% — the top third Statewide. Below 25% may signal understaffing or heavy agency use — read with Staffing ratings.Rankings are based only on facilities in North Carolina that report data for that category. Facilities without available data are excluded from the ranking.Click the rank badge to see the full State ranking.Click here to see the full State ranking.
Other operating costs Info Everything it costs to run the home apart from payroll — food, utilities, supplies, maintenance, contract labor and administration. Calculated as total operating expense minus payroll (staff salaries and wage-related benefits).
$4.5M
Total costs Info The home's total operating expense for the year — all the costs of running it, salaries included (CMS cost report, Worksheet G-3).
$9.4M

What does this home offer?

Housing options icon

Housing Options: Private / Shared Rooms

Building type icon
Building type icon

Building Type: Single-story

Exercise program icon

Exercise Programs

Recreational activities icon

Recreational Activities

Health Programs icon

Health Programs

Who this home usually serves

TYPE OF STAY

Primarily short stays

Residents typically stay for brief periods, with frequent admissions and discharges throughout the year.

Most new residents arrive under private pay (61% of admissions), and a typical private pay stay runs around 1 - 2 months.

Admissions
334 total

Coverage residents most often arrive under.

Medicare 33%
Private pay 61%
Medicaid 5%
Discharges
312 total

Coverage residents most often leave under.

Medicare 28%
Private pay 63%
Medicaid 10%

Places of interest near Litchford Falls Health & Rehabilitation Center

Address 1.0 miles from city center Info Estimated distance in miles from Raleigh's city center to Litchford Falls Health & Rehabilitation Center's address, calculated via Google Maps.

Calculate Travel Distance to Litchford Falls Health & Rehabilitation Center

Add your location

Address

Compare Nursing Homes around Raleigh

The information below is reported by the North Carolina Department of Health and Human Services, Division of Health Service Regulation.

5 facilities compared · CMS & NC Dept. of Health data

Perry Creek Health & Rehabilitation Center
NH
Raleigh (Northeast Raleigh)
90
Facility 90
NC AVG 72
Rank #119 / 390
86.7%
Facility 86.7%
NC AVG 76.4%
Rank #70 / 271
+13%
3.81
Facility 3.81
NC AVG 3.98
Rank #58 / 97
+33%-4%
$0
Facility $0
NC AVG $74.6k
Rank #1 / 105
2
Facility 2
NC AVG 20.9
Rank #8 / 101
2.0
Facility 2.0
NC AVG 5.0
Rank #13 / 101
-76-
24
Facility 24
NC AVG 33
Rank #349 / 572
-
$10.3M
Facility $10.3M
NC AVG $13.2M
Rank #69 / 104
$5.5M
Facility $5.5M
NC AVG $4.9M
Rank #79 / 104
53.1%
Facility 53.1%
NC AVG 39.8%
Rank #59 / 104
345003
Capital Nursing And Rehabilitation Center
NH
AL
HC
IL
Raleigh (East Raleigh)
125
Facility 125
NC AVG 72
Rank #29 / 390
75.9%
Facility 75.9%
NC AVG 76.4%
Rank #128 / 271
-1%
3.43
Facility 3.43
NC AVG 3.98
Rank #76 / 97
+1%-14%
$0
Facility $0
NC AVG $74.6k
Rank #1 / 105
14
Facility 14
NC AVG 20.9
Rank #50 / 101
2.8
Facility 2.8
NC AVG 5.0
Rank #30 / 101
-100-
43
Facility 43
NC AVG 33
Rank #206 / 572
Liberty Commons Nursing And Rehabilitation Center Of Wake County, LLC
$12.0M
Facility $12.0M
NC AVG $13.2M
Rank #61 / 104
$6.2M
Facility $6.2M
NC AVG $4.9M
Rank #52 / 104
51.3%
Facility 51.3%
NC AVG 39.8%
Rank #22 / 104
345202
Sunnybrook Rehabilitation Center
NH
RC
Raleigh (East Raleigh)
95
Facility 95
NC AVG 72
Rank #110 / 390
89.5%
Facility 89.5%
NC AVG 76.4%
Rank #54 / 271
+17%
3.86
Facility 3.86
NC AVG 3.98
Rank #52 / 97
+9%-3%
$72.9k
Facility $72.9k
NC AVG $74.6k
Rank #89 / 105
15
Facility 15
NC AVG 20.9
Rank #57 / 101
2.1
Facility 2.1
NC AVG 5.0
Rank #23 / 101
487-
49
Facility 49
NC AVG 33
Rank #161 / 572
Hannah Mcintyre
$11.9M
Facility $11.9M
NC AVG $13.2M
Rank #56 / 104
$5.7M
Facility $5.7M
NC AVG $4.9M
Rank #67 / 104
48.2%
Facility 48.2%
NC AVG 39.8%
Rank #58 / 104
345077
Litchford Falls Health & Rehabilitation Center
NH
Raleigh (North Raleigh)
90
Facility 90
NC AVG 72
Rank #119 / 390
65.6%
Facility 65.6%
NC AVG 76.4%
Rank #174 / 271
-14%
3.53
Facility 3.53
NC AVG 3.98
Rank #73 / 97
-34%-11%
$181.9k
Facility $181.9k
NC AVG $74.6k
Rank #99 / 105
16
Facility 16
NC AVG 20.9
Rank #59 / 101
3.2
Facility 3.2
NC AVG 5.0
Rank #38 / 101
386-
51
Facility 51
NC AVG 33
Rank #137 / 572
Universal Health Care / Raleigh, Inc
$9.1M
Facility $9.1M
NC AVG $13.2M
Rank #97 / 104
$5.0M
Facility $5.0M
NC AVG $4.9M
Rank #85 / 104
54.5%
Facility 54.5%
NC AVG 39.8%
Rank #10 / 104
345499
The Oaks at Whitaker Glen -
NH
AL
HC
IL
MC
Raleigh (Five Points)
139
Facility 139
NC AVG 72
Rank #18 / 390
-------------A+
28
Facility 28
NC AVG 33
Rank #328 / 572
$8.8M
Facility $8.8M
NC AVG $13.2M
Rank #90 / 104
$4.5M
Facility $4.5M
NC AVG $4.9M
Rank #90 / 104
50.5%
Facility 50.5%
NC AVG 39.8%
Rank #37 / 104
345009

Financial Assistance for
Nursing Home in North Carolina

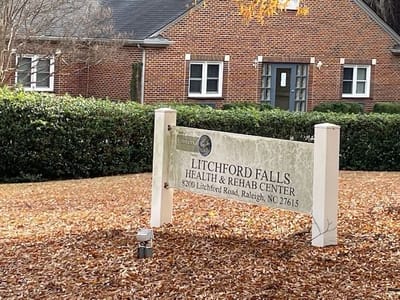
Litchford Falls Health & Rehabilitation Center is located in Raleigh, North Carolina.
Here are the financial assistance programs available to residents in North Carolina.

Get Financial aid guidance

Community Alternatives Program for Disabled Adults

NC Medicaid CAP/DA

Age 65+ or disabled
General North Carolina resident, Medicaid- eligible, nursing home-level care need.
Income Limits (2025) ~$2,829/month 300% FBR, individual
Asset Limits $2,000 (individual), $3,000 (couple).
NC

High demand; waitlists common in urban areas.

Benefits
Personal care (5-7 hours/day) Respite (240 hours/year) Adult day care ($60/day) Home modifications ($1,500 avg.)

North Carolina Senior Care Options

NC SCO (via NFCSP)

Age Caregiver of someone 60+ (or with dementia)
General North Carolina resident.
Income Limits No strict limit; prioritizes low-income.
Asset Limits Not applicable.
NC

Limited slots; rural/urban balance.

Benefits
In-home respite (4-6 hours/day) Adult day care (~$60/day) Short-term facility care (up to 5 days)

Program of All-Inclusive Care for the Elderly (PACE)

North Carolina PACE (e.g., PACE of the Triad)

Age 55+
General NC resident (specific counties), NFLOC, safe with PACE support.
Income Limits (2025) ~$2,829/month (Medicaid-eligible); private pay option available.
Asset Limits $2,000 (individual), $3,000 (couple) for Medicaid enrollees.
NC

Available in 10+ counties (e.g., Guilford, Wake); multiple providers (e.g., PACE of the Southern Piedmont).

Benefits
Personal care (5-7 hours/day) Medical care Meals Transportation Respite Therapies

In-Home Aide Services

North Carolina In-Home Aide Services

Age 60+
General NC resident, unable to perform 1+ ADL, at risk of nursing home placement.
Income Limits (2025) No strict cap; prioritizes low-income ~$24,980/year
Asset Limits Not assessed; need-based.
NC

Family can be aides; varies by county funding.

Benefits
Personal care (5-20 hours/week) Meal prep Respite (~5 days/year) Errands

Medicare Savings Program (MSP)

North Carolina Medicare Savings Program

Age 65+ or disabled
General NC resident, Medicare Part A/B.
Income Limits (2025) ~$2,510/month (QMB), ~$3,380/month (SLMB), ~$3,598/month (QI)—individual.
Asset Limits $9,430 (individual), $14,130 (couple).
NC

Three tiers; no waitlist; includes Extra Help for Part D.

Benefits
Covers Part B premiums ($174.70/month) Deductibles ($240/year) Copays (~20%)

VA Aid and Attendance (A&A) and Housebound Benefits

North Carolina VA Aid and Attendance/Housebound

Age 65+ or disabled veteran/spouse
General NC resident, wartime service, need for ADL help (A&A) or homebound.
Income Limits (2025) Net income < ~$1,984/month (veteran with dependent, A&A); pension offsets income.
Asset Limits ~$155,356 net worth limit
NC

High veteran demand in rural/urban areas.

Benefits
Cash (~$1,433-$2,642/month veteran, ~$951-$1,318 spouse) for care costs (e.g., in-home, assisted living)

Urgent Repair Program (URP)

North Carolina Urgent Repair Program

Age 60+ prioritized
General NC resident, homeowner, low-income.
Income Limits (2025) ~$30,258/year 50% AMI, varies by county
Asset Limits Not strictly assessed; home value considered.
NC

Forgivable at $2,000/year; statewide via local partners.

Benefits
Repairs (~$8,000-$12,000 avg.) for safety (e.g., roofs, heating, accessibility)

State/County Special Assistance (SA)

North Carolina Special Assistance

Age 65+ (or disabled)
General NC resident, in licensed adult care home, low-income.
Income Limits (2025) ~$1,255/month (individual, 100% FPL); varies by facility rate.
Asset Limits $2,000 individual
NC

Covers assisted living; counties supplement state funds.

Benefits
Cash (~$1,200-$1,500/month) for room/board; Medicaid covers care services

Frequently Asked Questions about Litchford Falls Health & Rehabilitation Center

What neighborhood is Litchford Falls Health & Rehabilitation Center in?

Litchford Falls Health & Rehabilitation Center is in the North Raleigh neighborhood.

Is Litchford Falls Health & Rehabilitation Center in a walkable area?

Litchford Falls Health & Rehabilitation Center has a walk score of 51. Moderately walkable. Some errands can be accomplished on foot, with a mix of nearby amenities.

What is the occupancy rate at Litchford Falls Health & Rehabilitation Center?

Litchford Falls Health & Rehabilitation Center's occupancy is 65.6%.

Does Litchford Falls Health & Rehabilitation Center operate as a for-profit or non-profit?

Litchford Falls Health & Rehabilitation Center is registered as a for-profit.

Are there photos of Litchford Falls Health & Rehabilitation Center?

Yes — there are 9 photos of Litchford Falls Health & Rehabilitation Center in the photo gallery on this page.

What is the address of Litchford Falls Health & Rehabilitation Center?

Litchford Falls Health & Rehabilitation Center is located at 8200 Litchford Rd, Raleigh, NC 27615.

What is the phone number of Litchford Falls Health & Rehabilitation Center?

(919) 878-7772 will put you in contact with the team at Litchford Falls Health & Rehabilitation Center.

Guides for Better Senior Living

Care Cost Calculator: See Prices in Your Area

Nursing Home Data Explorer

Don’t Wait Too Long: 7 Red Flag Signs Your Parent Needs Assisted Living Now

The True Cost of Assisted Living in 2025 – And How Families Are Paying For It

Understanding Senior Living Costs: Pricing Models, Discounts & Financial Assistance