


Total staff
122
Employees
122
Contractors
0
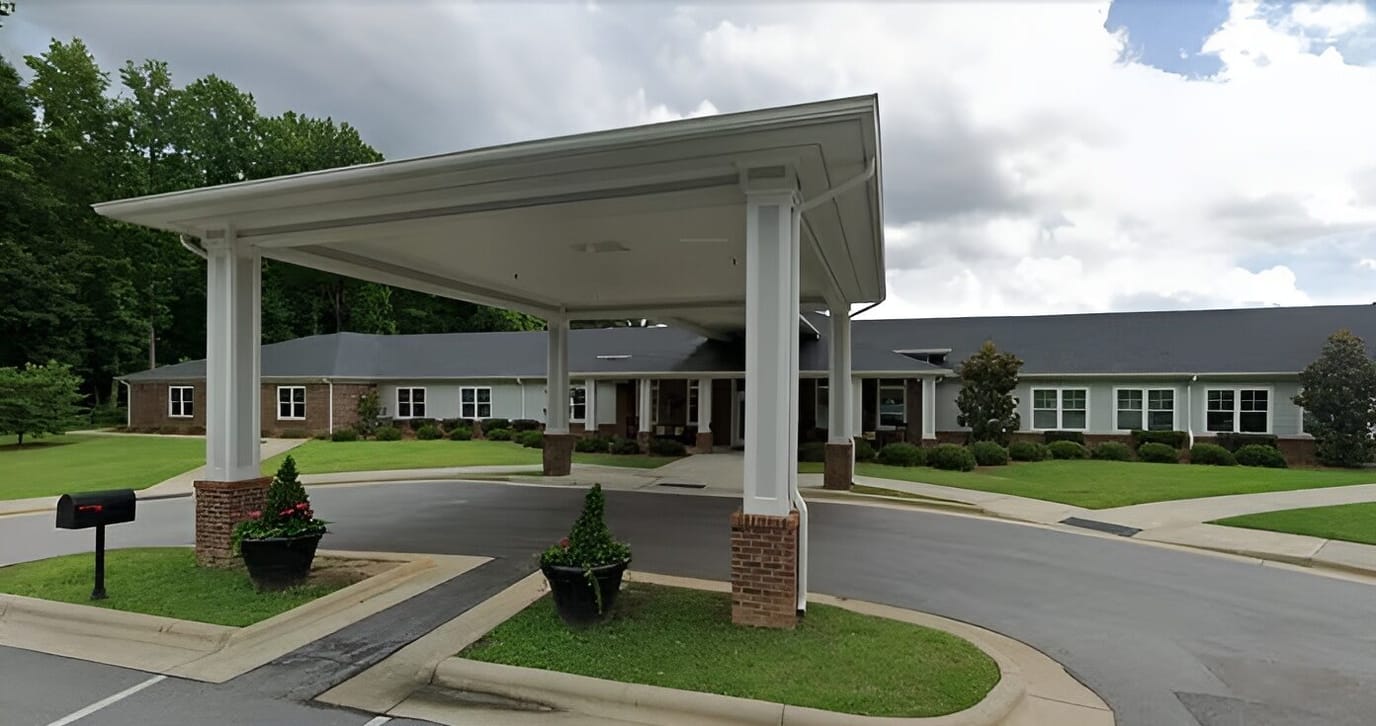
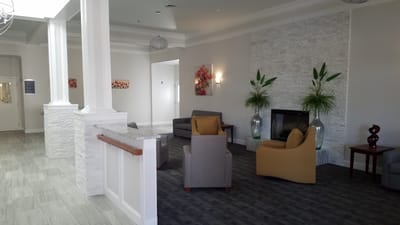
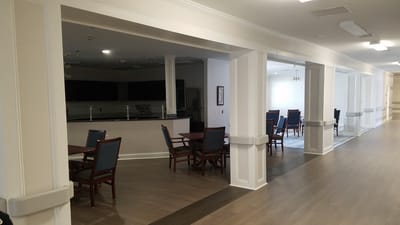
BellaRose Nursing and Rehab is a warm and welcoming community in Garner, NC, offering excellent rehabilitation and long-term care services. Compassionate and highly skilled caregivers are always available to serve residents’ unique needs and assist them with their daily living activities for their convenience. Access to physical, speech, and occupational therapy services is regular to ensure residents’ treatment plans are always regularly updated and progress is seen quickly.
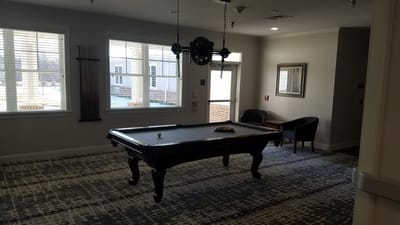
With fun and exciting activities available regularly, residents are encouraged to stay active and engaged in their community. The convenience of housekeeping and laundry services is complemented by the comfort of spa and salon services, allowing residents to maintain their wellness without worries. Here at BellaRose Nursing and Rehab, they provide everything residents need to enjoy their life in comfort or recover quickly, including quality care, enriching experiences, and thoughtful conveniences.
| Staff type | Hours / Day / Resident | vs state avg |
|---|---|---|
|
Registered Nurse (RN)
| 24m per day | ▼ 32% State avg: 35m per day · National avg: 41m per day |
|
LPN / LVN
| 1h 28m per day | ▲ 69% State avg: 52m per day · National avg: 52m per day |
|
Nurse Aide
| 2h 35m per day | ▲ 11% State avg: 2h 19m per day · National avg: 2h 21m per day |
|
Weekend Total Nursing
| 3h 47m per day | ▲ 14% State avg: 3h 20m per day · National avg: 3h 26m per day |
|
Physical Therapist
| 11m per day | ▲ 125% State avg: 5m per day · National avg: 4m per day |
|
Weekend RN
| 19m per day | ▼ 17% State avg: 23m per day · National avg: 29m per day |
Reporting period: October 1 – December 31, 2025 (Q4 2025). Source: CMS Payroll-Based Journal report.
Manages medical care and health needs.
Assists with medical care and medications.
Helps with daily care and mobility.
| Certified Nursing Assistant | 56 | 0 | 56 | 22,294 | 92 | 100% | 7.8 |
| Licensed Practical Nurse | 30 | 0 | 30 | 10,831 | 92 | 100% | 7.8 |
| Registered Nurse | 8 | 0 | 8 | 2,888 | 92 | 100% | 8.6 |
| RN Director of Nursing | 4 | 0 | 4 | 1,853 | 83 | 90% | 7.4 |
| Respiratory Therapy Technician | 6 | 0 | 6 | 1,621 | 85 | 92% | 6.6 |
| Physical Therapy Assistant | 4 | 0 | 4 | 1,318 | 67 | 73% | 7.5 |
| Qualified Social Worker | 6 | 0 | 6 | 1,304 | 75 | 82% | 6.6 |
| Other Dietary Services Staff | 2 | 0 | 2 | 501 | 61 | 66% | 6.6 |
| Administrator | 1 | 0 | 1 | 488 | 61 | 66% | 8 |
| Nurse Practitioner | 1 | 0 | 1 | 480 | 60 | 65% | 8 |
| Speech Language Pathologist | 1 | 0 | 1 | 463 | 64 | 70% | 7.2 |
| Physical Therapy Aide | 1 | 0 | 1 | 421 | 67 | 73% | 6.3 |
| Mental Health Service Worker | 1 | 0 | 1 | 318 | 39 | 42% | 8.2 |
| Clinical Nurse Specialist | 1 | 0 | 1 | 51 | 10 | 11% | 5.1 |
Federal penalties imposed by CMS for regulatory violations, including civil money penalties (fines) and denials of payment for new Medicare/Medicaid admissions.
Source: CMS Penalties Database
No penalties in the past 3 years
No civil money penalties or payment denials were reported in the last 3 years.
These measures show how residents usually do over time at this home, based on health outcomes and preventive care.
North Carolina average: 11.5
North Carolina average: 20.6
North Carolina average: 17.5%
North Carolina average: 23.3%
North Carolina average: 21.4%
North Carolina average: 3.6%
North Carolina average: 6.3%
North Carolina average: 2.6%
North Carolina average: 7.4%
North Carolina average: 4.4%
North Carolina average: 13.4%
North Carolina average: 91.6%
North Carolina average: 94.1%
North Carolina average: 1.77
North Carolina average: 1.82
North Carolina average: 79.9%
North Carolina average: 1.5%
North Carolina average: 78.1%
North Carolina average: 22.9%
North Carolina average: 13.2%
North Carolina average: 0.8%
North Carolina average: 53.7%
North Carolina average: 50.6%
Quality measures are calculated from Minimum Data Set (MDS) assessments. For most measures, lower percentages indicate better care quality.
60% of new residents, usually for short-term rehab.
37% of new residents, often for short stays.
3% of new residents, often for long-term daily care.
Source: CMS Long-Term Care Facility Characteristics (Data as of Jan 2026)
Residents meet regularly to discuss policies, care quality, and activities
State-approved Nurse Aide Training and Competency Evaluation Program on-site
Organized group of residents that meets regularly to discuss facility policies, quality of life, and activities.
Data sourced from CMS Long-Term Care Facility Characteristics quarterly report. Payer mix reflects the current resident census by primary payment source.
Historical financial and operational data for BellaRose Nursing and Rehab from 2019–2023, based on CMS SNF Cost Reports.
Key figures below are for fiscal year ending in 09/2023.
Based on CMS SNF Cost Report for fiscal year ending in 09/2023.
No pets allowed
Housing Options: Private / Semi-Private Suites
Building Type: Single-story
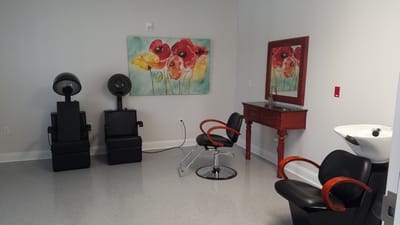
Beauty Services
Housekeeping Services
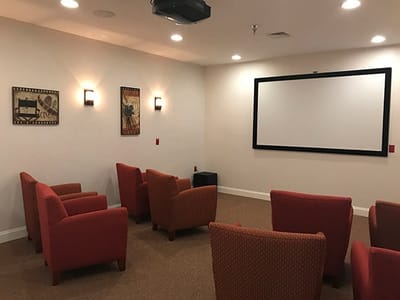
Recreational Activities
Exercise Programs
Most residents typically stay for a few weeks or months before returning home or moving on.
Most new residents arrive under Medicare (60% of admissions), and a typical Medicare stay runs around 29 days.
Coverage residents most often arrive under.
Coverage residents most often leave under.
![]() 2.1 miles from city center
2.1 miles from city center
![]() Estimated distance in miles from Garner's city center to BellaRose Nursing and Rehab's address, calculated via Google Maps.
Estimated distance in miles from Garner's city center to BellaRose Nursing and Rehab's address, calculated via Google Maps.
Add your location
The information below is reported by the North Carolina Department of Health and Human Services, Division of Health Service Regulation.
| Hillside Nursing & Rehab | NH AL SNF | Wake Forest | 130
Facility
130
NC AVG
72
Rank
#24 / 388 |
85.6%
Facility
85.6%
NC AVG
68
Rank
#75 / 240 | +26% | 4.05
Facility
4.05
NC AVG
3.98
Rank
#43 / 97 | +3% | +2% | $0
Facility
$0
NC AVG
$74.6k
Rank
#1 / 105 | 1
Facility
1
NC AVG
20.9
Rank
#1 / 101 | 1.0
Facility
1.0
NC AVG
5.0
Rank
#1 / 101 | - | 111 | - |
19
Facility
19
NC AVG
33
Rank
#385 / 573 | Mary Margaret Clifton | $13.7MFiscal year ending 09/2023
Facility
$13.7MFiscal year ending 09/2023
NC AVG
$13.2M
Rank
#49 / 104 | $7.8MFiscal year ending 09/2023
Facility
$7.8MFiscal year ending 09/2023
NC AVG
$4.9M
Rank
#42 / 104 | 56.6%Fiscal year ending 09/2023
Facility
56.6%Fiscal year ending 09/2023
NC AVG
39.8%
Rank
#26 / 104 | 345417 | ||||
| BellaRose Nursing and Rehab | NH HOS RC SNF | Garner | 100
Facility
100
NC AVG
72
Rank
#78 / 388 |
93.9%
Facility
93.9%
NC AVG
68
Rank
#43 / 240 | +38% | 3.20
Facility
3.20
NC AVG
3.98
Rank
#89 / 97 | -28% | -20% | $0
Facility
$0
NC AVG
$74.6k
Rank
#1 / 105 | 2
Facility
2
NC AVG
20.9
Rank
#8 / 101 | 2.0
Facility
2.0
NC AVG
5.0
Rank
#13 / 101 | - | 94 | - |
4
Facility
4
NC AVG
33
Rank
#507 / 573 | William Burroughs | $13.4MFiscal year ending 09/2023
Facility
$13.4MFiscal year ending 09/2023
NC AVG
$13.2M
Rank
#42 / 104 | $7.8MFiscal year ending 09/2023
Facility
$7.8MFiscal year ending 09/2023
NC AVG
$4.9M
Rank
#41 / 104 | 58.2%Fiscal year ending 09/2023
Facility
58.2%Fiscal year ending 09/2023
NC AVG
39.8%
Rank
#42 / 104 | 345574 |
BellaRose Nursing and Rehab is located in Garner, North Carolina.
Here are the financial assistance programs available to residents in North Carolina.
BellaRose Nursing and Rehab is in the Garner neighborhood.
BellaRose Nursing and Rehab has a walk score of 4. Car-dependent. Most errands require a car, with limited nearby walkable options.
BellaRose Nursing and Rehab's occupancy is 92.0%.
No, BellaRose Nursing and Rehab has a no-pet policy.
BellaRose Nursing and Rehab is registered as a for-profit.
Yes — there are 6 photos of BellaRose Nursing and Rehab in the photo gallery on this page.
BellaRose Nursing and Rehab is located at 200 Bellarose Lake Way, Garner, NC 27529.
Care Cost Calculator: See Prices in Your Area
Nursing Home Data Explorer
Don’t Wait Too Long: 7 Red Flag Signs Your Parent Needs Assisted Living Now
The True Cost of Assisted Living in 2025 – And How Families Are Paying For It
Understanding Senior Living Costs: Pricing Models, Discounts & Financial Assistance


