









Hillwood Memory Care Home
Memory Care & Assisted Living · Bethesda, MD
Hillwood Memory Care Home
Memory Care & Assisted Living · Bethesda, MD
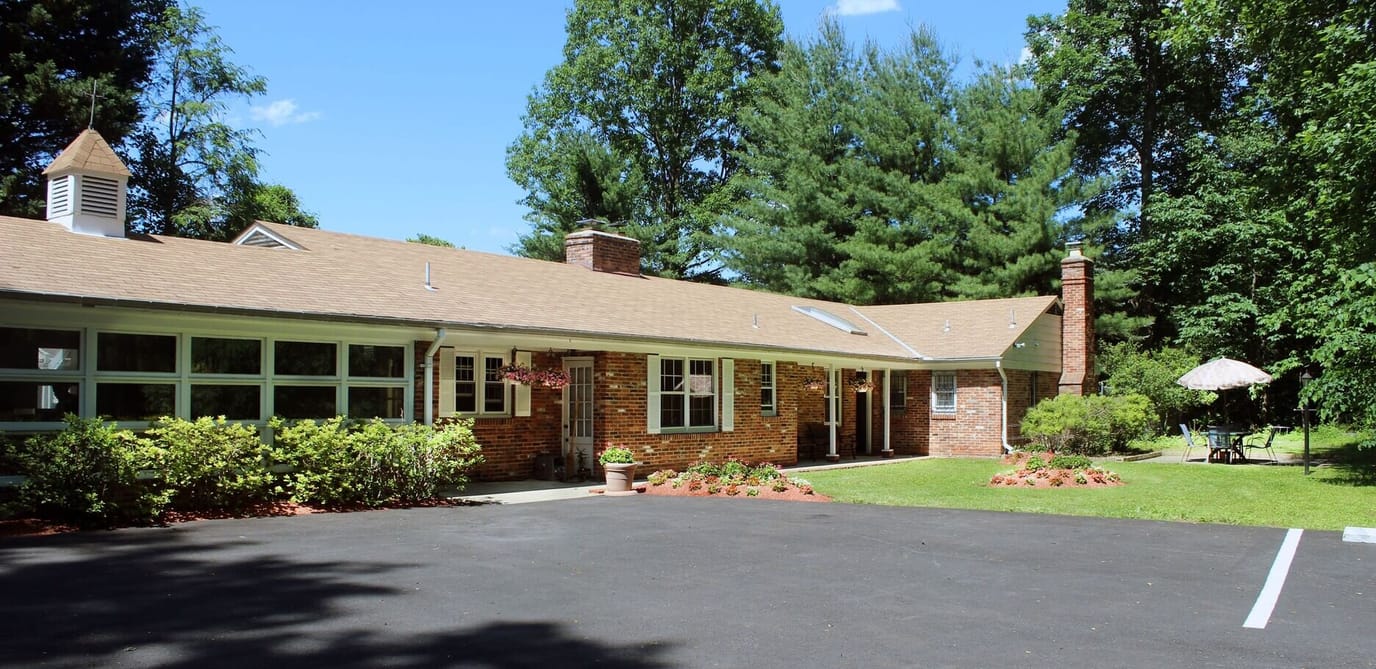
A blissful community located in the harmonious neighborhood of Bradley Boulevard, Bethesda, MD, Hillwood Memory Care Home focuses on memory care. With dedicated and specially designed amenities, the community strives to accommodate up to eight residents and provide them with the highest quality of care and assistance around the clock. Providing care since 1995, the community takes pride in its experienced team, ensuring the finest comfort and safety for residents.
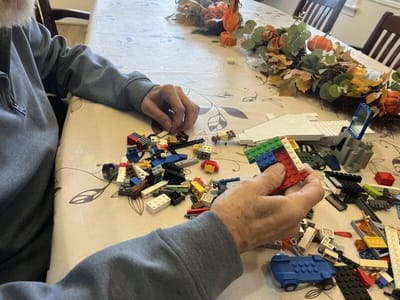
The community also conducts stimulating activities and enriching programs, encouraging residents to live with purpose and meet new friends. Delicious and healthy meals are also served to meet dietary needs and foster comfort for a delightful dining experience. Cherish every moment of your golden years with the community’s genuine care and state-of-the-art amenities designed to enhance cognition.

Walk Score: 9 / 100 Rank #853 / 985Walk Score — State benchmarkedThis home is ranked 853rd out of 985 homes in Maryland. Shows how walkable this facility's neighborhood is compared to the average Walk Score across Maryland facilities. Higher scores benefit residents, families, and staff.Rankings are based only on facilities in Maryland that report data for that category. Facilities without available data are excluded from the ranking.Click the rank badge to see the full State ranking.Click here to see the full State ranking.
Car-dependent. Most errands require a car, with limited nearby walkable options.
What does this home offer?

Housing Options: Private Rooms

Staff to Resident Ratio: 1 Staff : 4 Residents

Building Type: Single-story

Housekeeping Services

Recreational Activities

Exercise Programs
Places of interest near Hillwood Memory Care Home
 3.8 miles from city center
 Estimated distance in miles from Bethesda's city center to Hillwood Memory Care Home's address, calculated via Google Maps.
Calculate Travel Distance to Hillwood Memory Care Home
Add your location
Compare Memory Care around Bethesda
The information below is reported by the Maryland Department of Health, Office of Health Care Quality.
| Sunrise of Bethesda | MC AL | Bethesda (Battery Lane) | 108
Facility
108
MD AVG
43
Rank
#103 / 697 | Yes |
90
Facility
90
MD AVG
43
Rank
#29 / 985 | Studio / 1 Bed / 2 Bed | 8
Facility
8
MD AVG
21
Rank
#162 / 208 |
29% Male Residents — State Benchmarked 29% of residents are male, compared to the Maryland average of 31%. This facility caters to a majority female resident pool (71% female), consistent with the broader assisted living trend where women significantly outnumber men. |
71% Female Residents — State Benchmarked 71% of residents are female, compared to the Maryland average of 69%. Women comprise the large majority, consistent with national assisted living demographics where women live longer and enter care facilities at higher rates. |
79% White Residents — State Benchmarked 79% of residents are reported as White, compared to the Maryland average of 81%. Close to the average for this category among assisted living facilities in Maryland with reported race/ethnicity data. |
6% African American Residents — State Benchmarked 6% of residents are reported as African American or Black, compared to the Maryland average of 13%. In line with the Maryland average for African American residents among facilities reporting this breakdown. |
15% Other Ethnicity Residents — State Benchmarked 15% of residents fall into categories other than White or African American (combined), compared to the Maryland average of 6%. This column aggregates Hispanic, Asian, multiracial, and any other labeled groups that are not classified as White or African American. Reported subgroups in this total: Other (8%), Asian (4%), Hispanic (2%), Mixed Race (2%). |
6% Residents Age 65–74 — State Benchmarked 6% of residents are 65–74, compared to the Maryland average of 13%. Fewer younger seniors suggests the resident population skews older, likely requiring higher acuity care and more hands-on support. |
40% Residents Age 75–84 — State Benchmarked 40% of residents are 75–84, compared to the Maryland average of 31%. A high concentration in this mid-range bracket, where residents typically need moderate support with daily activities. |
44% Residents Age 85–94 — State Benchmarked 44% of residents are 85–94, compared to the Maryland average of 44%. This is typically the most common age bracket in assisted living — this facility is in line with the statewide norm. |
8% Residents Age 95+ — State Benchmarked 8% of residents are 95 or older, compared to the Maryland average of 16%. Most residents here have not yet reached the oldest-old bracket, suggesting a younger overall community. |
| Sunrise at Fox Hill | MC AL HOS RC | Bethesda (Burdette Road) | 105
Facility
105
MD AVG
43
Rank
#107 / 697 | Yes |
16
Facility
16
MD AVG
43
Rank
#772 / 985 | Studio / Suite / 1 Bed | 17
Facility
17
MD AVG
21
Rank
#120 / 208 |
45% Male Residents — State Benchmarked 45% of residents are male, compared to the Maryland average of 31%. A relatively balanced gender mix for assisted living, where facilities typically skew heavily female. |
55% Female Residents — State Benchmarked 55% of residents are female, compared to the Maryland average of 69%. Closer to an even gender split than most assisted living facilities, which typically have 65–75% female residents. |
81% White Residents — State Benchmarked 81% of residents are reported as White, compared to the Maryland average of 81%. Close to the average for this category among assisted living facilities in Maryland with reported race/ethnicity data. |
0% African American Residents — State Benchmarked 0% of residents are reported as African American or Black, compared to the Maryland average of 13%. A lower African American share than is typical in Maryland; local markets still vary widely. |
19% Other Ethnicity Residents — State Benchmarked 19% of residents fall into categories other than White or African American (combined), compared to the Maryland average of 6%. This column aggregates Hispanic, Asian, multiracial, and any other labeled groups that are not classified as White or African American. Reported subgroups in this total: Asian (6%), Mixed Race (6%), Hawaiian/Pacific Islander (4%), Hispanic (4%). |
6% Residents Age 65–74 — State Benchmarked 6% of residents are 65–74, compared to the Maryland average of 13%. Fewer younger seniors suggests the resident population skews older, likely requiring higher acuity care and more hands-on support. |
23% Residents Age 75–84 — State Benchmarked 23% of residents are 75–84, compared to the Maryland average of 31%. Below the state norm — the resident mix may skew either younger or older than this typical middle bracket. |
58% Residents Age 85–94 — State Benchmarked 58% of residents are 85–94, compared to the Maryland average of 44%. A high concentration of very elderly residents signals a higher-acuity facility with experience caring for advanced age-related needs. |
11% Residents Age 95+ — State Benchmarked 11% of residents are 95 or older, compared to the Maryland average of 16%. Most residents here have not yet reached the oldest-old bracket, suggesting a younger overall community. |
| Brightview Bethesda Grosvenor | MC AL | Bethesda (Pooks Hill) | 104
Facility
104
MD AVG
43
Rank
#110 / 697 | No |
36
Facility
36
MD AVG
43
Rank
#563 / 985 | Deluxe Apartments | 5
Facility
5
MD AVG
21
Rank
#182 / 208 |
45% Male Residents — State Benchmarked 45% of residents are male, compared to the Maryland average of 31%. A relatively balanced gender mix for assisted living, where facilities typically skew heavily female. |
55% Female Residents — State Benchmarked 55% of residents are female, compared to the Maryland average of 69%. Closer to an even gender split than most assisted living facilities, which typically have 65–75% female residents. |
90% White Residents — State Benchmarked 90% of residents are reported as White, compared to the Maryland average of 81%. A higher White share than is typical for assisted living in Maryland in this dataset — compare with peer facilities for local context. |
0% African American Residents — State Benchmarked 0% of residents are reported as African American or Black, compared to the Maryland average of 13%. A lower African American share than is typical in Maryland; local markets still vary widely. |
10% Other Ethnicity Residents — State Benchmarked 10% of residents fall into categories other than White or African American (combined), compared to the Maryland average of 6%. This column aggregates Hispanic, Asian, multiracial, and any other labeled groups that are not classified as White or African American. Reported subgroups in this total: Asian (6%), Hispanic (3%), Hawaiian/Pacific Islander (1%). |
4% Residents Age 65–74 — State Benchmarked 4% of residents are 65–74, compared to the Maryland average of 13%. Fewer younger seniors suggests the resident population skews older, likely requiring higher acuity care and more hands-on support. |
25% Residents Age 75–84 — State Benchmarked 25% of residents are 75–84, compared to the Maryland average of 31%. Below the state norm — the resident mix may skew either younger or older than this typical middle bracket. |
60% Residents Age 85–94 — State Benchmarked 60% of residents are 85–94, compared to the Maryland average of 44%. A high concentration of very elderly residents signals a higher-acuity facility with experience caring for advanced age-related needs. |
10% Residents Age 95+ — State Benchmarked 10% of residents are 95 or older, compared to the Maryland average of 16%. Most residents here have not yet reached the oldest-old bracket, suggesting a younger overall community. |
| Maplewood Park Place | MC AL IL NH SNF | Bethesda (Pooks Hill) | 29
Facility
29
MD AVG
43
Rank
#254 / 697 | Yes |
38
Facility
38
MD AVG
43
Rank
#542 / 985 | 1 Bed / 2 Bed | 30
Facility
30
MD AVG
21
Rank
#44 / 208 |
18% Male Residents — State Benchmarked 18% of residents are male, compared to the Maryland average of 31%. This facility caters to a majority female resident pool (82% female), consistent with the broader assisted living trend where women significantly outnumber men. |
82% Female Residents — State Benchmarked 82% of residents are female, compared to the Maryland average of 69%. Women comprise the large majority, consistent with national assisted living demographics where women live longer and enter care facilities at higher rates. |
100% White Residents — State Benchmarked 100% of residents are reported as White, compared to the Maryland average of 81%. A higher White share than is typical for assisted living in Maryland in this dataset — compare with peer facilities for local context. |
0% African American Residents — State Benchmarked 0% of residents are reported as African American or Black, compared to the Maryland average of 13%. A lower African American share than is typical in Maryland; local markets still vary widely. |
0% Other Ethnicity Residents — State Benchmarked 0% of residents fall into categories other than White or African American (combined), compared to the Maryland average of 6%. This column aggregates Hispanic, Asian, multiracial, and any other labeled groups that are not classified as White or African American. | - |
6% Residents Age 75–84 — State Benchmarked 6% of residents are 75–84, compared to the Maryland average of 31%. Below the state norm — the resident mix may skew either younger or older than this typical middle bracket. |
24% Residents Age 85–94 — State Benchmarked 24% of residents are 85–94, compared to the Maryland average of 44%. The population here skews younger than the statewide norm, which may indicate a more active, lower-acuity community. |
71% Residents Age 95+ — State Benchmarked 71% of residents are 95 or older, compared to the Maryland average of 16%. A high proportion of the oldest-old suggests strong end-of-life care experience and very-high-acuity capabilities. |
| Hillwood Memory Care Home | MC AL | Bethesda | 8 Residents | No |
9
Facility
9
MD AVG
43
Rank
#853 / 985 | Private Rooms | - | - | - | - | - | - | - | - | - | - |
Financial Assistance for
Memory Care in Maryland
Hillwood Memory Care Home is located in Bethesda, Maryland.
Here are the financial assistance programs available to residents in Maryland.

Frequently Asked Questions about Hillwood Memory Care Home
Is Hillwood Memory Care Home in a walkable area?
Hillwood Memory Care Home has a walk score of 9. Car-dependent. Most errands require a car, with limited nearby walkable options.
Are there photos of Hillwood Memory Care Home?
Yes — there are 2 photos of Hillwood Memory Care Home in the photo gallery on this page.
What is the address of Hillwood Memory Care Home?
Hillwood Memory Care Home is located at 7401 Bradley Blvd, Bethesda, MD 20817.
What is the phone number of Hillwood Memory Care Home?
(301) 701-3541 will put you in contact with the team at Hillwood Memory Care Home.
Guides for Better Senior Living
Updated on


